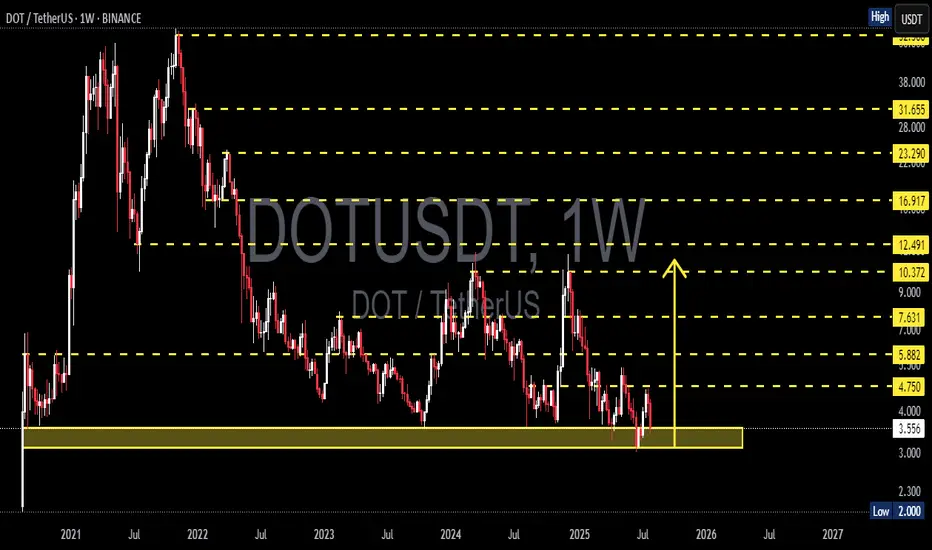
DOTUSDT On the Edge of a Major Rebound or a Devastating BreakdowPolkadot (DOT) is once again retesting one of its strongest macro support zones between $4.00 – $3.55, a historically significant demand area that has provided major price bounces since mid-2022.
This isn’t just a random level—it’s a critical accumulation base where large buyers have consistently shown interest. With price now hovering around this zone again, the next move could be decisive for DOT's mid- to long-term trend.
---
🔍 Price Structure & Key Patterns
Extended Accumulation Phase: DOT has been trading in a sideways range for over 80 weeks, indicating a potential bottoming structure forming after a prolonged downtrend.
Strong Historical Demand: The $4.00 – $3.55 region has acted as a key support multiple times since 2022, reinforcing its importance as a make-or-break zone.
Potential Trap Setup: Current price action could be forming either a bull trap or bear trap, depending on whether price rebounds or breaks down. Weekly candle confirmation will be key.
---
🟢 Bullish Scenario (Upside Reversal)
If price holds and prints a strong bullish candle (e.g., bullish engulfing or long-tailed hammer), expect the following upside targets:
Short-term: $4.75 – $5.88
Mid-term: $7.63 – $9.00
Long-term: $10.37 – $12.49, aligning with prior distribution zones
✅ A breakout from this long accumulation base could trigger a massive short squeeze and renewed buying momentum.
---
🔴 Bearish Scenario (Breakdown)
If DOT closes below $3.55 on the weekly chart:
Confirms breakdown from macro support
Opens downside risk toward $2.30 – $2.00
Would print a new lower low, extending the bear market phase and potentially triggering capitulation
⚠️ Speculative long positions should include tight risk management below $3.50.
---
🧠 Market Sentiment & Strategy
DOT appears to be in a "Capitulation meets Hope" phase—selling pressure is exhausting, but bullish conviction hasn't yet taken control.
Ideal entry zones lie within the current demand range, with tight stops.
Watch for a daily breakout or bullish momentum confirmation next week before committing to positions.
---
📌 Final Takeaway
> DOT is standing at the edge of a cliff—or a launchpad. The $3.55–$4.00 zone has repeatedly been the foundation for rebounds. If history repeats, this may be the beginning of a new uptrend. If not—brace for deeper downside.
⏳ The market is watching. Will DOT break out… or break down?
#DOTUSDT #Polkadot #CryptoTechnicalAnalysis #SupportResistance #CryptoRebound #BearishOrBullish #AltcoinOutlook #CryptoBreakdown #WeeklyChart #AccumulationZone #DOTAnalysis
DOTUSDTPERP
Price floor: The opportunity to buy has arrived.Hello friends🙌
According to the decline we had, you can see that the price has reached its historical low, which has given good profits whenever it reaches this low. Now, with capital and risk management, we can buy within the limits of the low and move with it to the specified targets.
🔥Follow us for more signals🔥
*Trade safely with us*

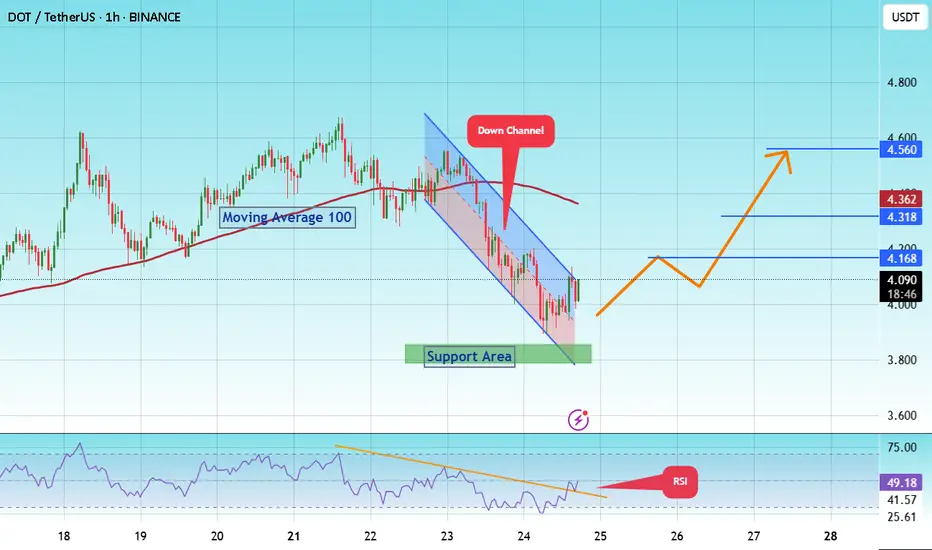
#DOT/Eyes 15% Rally, Targeting Key $ 4.560 Resistance Level#DOT
The price is moving within a descending channel on the 1-hour frame and is expected to break and continue upward.
We have a trend to stabilize above the 100 moving average once again.
We have a downtrend on the RSI indicator that supports the upward break.
We have a support area at the lower limit of the channel at 3,870, acting as strong support from which the price can rebound.
We have a major support area in green that pushed the price higher at 3,800.
Entry price: 4.084
First target: 4.168
Second target: 4.318
Third target: 4.560
To manage risk, don't forget stop loss and capital management.
When you reach the first target, save some profits and then change your stop order to an entry order.
For inquiries, please comment.
Thank you.
DOTUSDT - A Sleeping Giant in the Bull Market?Polkadot (DOT) has always been one of the leading assets during bull markets
A $10 target now seems inevitable after a clean breakout above the main trendline, followed by a successful retest.🎯
This $10 level has historically acted as a major resistance zone, often manipulated during each bull cycle — price touches it, then sharply pulls back.
But the big question is:
Will DOT break this psychological barrier this time?
Why not?
With many investors losing faith in the crypto market and considering leaving altogether, this might actually be the perfect setup for a massive price explosion.
Historically, the craziest pumps tend to come when confidence is at its lowest.🚀
Best regards Ceciliones 🎯
DOT/USDT Weekly Accumulation or Annihilation?📌 Overview & Market Context
Polkadot (DOT) is currently testing one of the most critical technical zones in its price history. Price action is revisiting a multi-year demand zone between $2.70 and $3.60, which has previously served as the springboard for explosive upward moves — including the 2021 rally to all-time highs near $55.
This weekly chart reveals that DOT may be transitioning from a prolonged downtrend into an accumulation phase, often seen before major bullish expansions.
🧱 Historical Support Zone & Technical Validation
🔹 The yellow demand zone ($2.70–$3.60) has acted as a strong support multiple times since 2020.
🔹 Price has once again bounced from this area, forming a potential triple bottom or accumulation base pattern, consistent with Wyckoff Accumulation Theory.
🔹 A confirmed bullish candlestick (e.g., bullish engulfing, hammer, or long-tail doji) on the weekly timeframe could signal early institutional accumulation and a potential macro trend reversal.
🟢 📈 Bullish Scenario: Strong Reversal Potential
If DOT successfully holds this support and forms a higher low, we could see a multi-leg bullish breakout, targeting the following resistance levels:
🎯 Target Price Level Significance
TP1 $4.75 First structural breakout
TP2 $5.88 Minor historical resistance
TP3 $7.63 Previous consolidation zone
TP4 $10.37 Major weekly resistance
TP5 $12.49–14.00 Extension zone during strong rallies
🧠 Note: A move from the current level to $14 represents a potential 250%+ upside — a major opportunity if confirmed by momentum and market sentiment.
🔴 📉 Bearish Scenario: Breakdown from Historic Support
A clean break below $2.70 with high volume would invalidate the bullish setup and signal:
Breakdown from a multi-year base structure.
Possible entry into a new bearish price discovery phase.
Next psychological support at around $2.00 or lower.
This scenario could materialize if:
Bitcoin or broader crypto markets turn bearish.
Macro factors worsen.
No strong demand appears from long-term holders.
⚖️ Strategy & Investor Insights
Swing Traders: Consider aggressive entries near current levels with tight stops below $2.70.
Mid-Term Investors: This is an ideal zone for DCA (dollar-cost averaging), with attractive long-term risk-reward.
Confirmation Needed: Watch for structure breakouts above $4.75 and momentum from RSI/volume indicators.
🧠 Market Psychology: Fear Breeds Opportunity
DOT is currently in what can be described as the “boredom phase” — the stage in market cycles when most traders have given up, and smart money quietly accumulates.
As Warren Buffet famously said:
> “Be fearful when others are greedy, and greedy when others are fearful.”
#DOTUSDT #Polkadot #CryptoReversal #AltcoinSetup #TechnicalAnalysis #SmartMoneyMoves #AccumulationPhase #SupportZone #BullishCrypto #BearishBreakdown

Dot have potential to catch move like EthereumBullish trend making HH may go down for HL
Rsi divergence
Reversal pattern falling wedge
Manage your risk before entering position in real account.

DOTUSDT 1W AnalysisDOT ~ 1W Analysis
#DOT Buy back gradually from this support block with a short term target of at least 20%+ from this support.

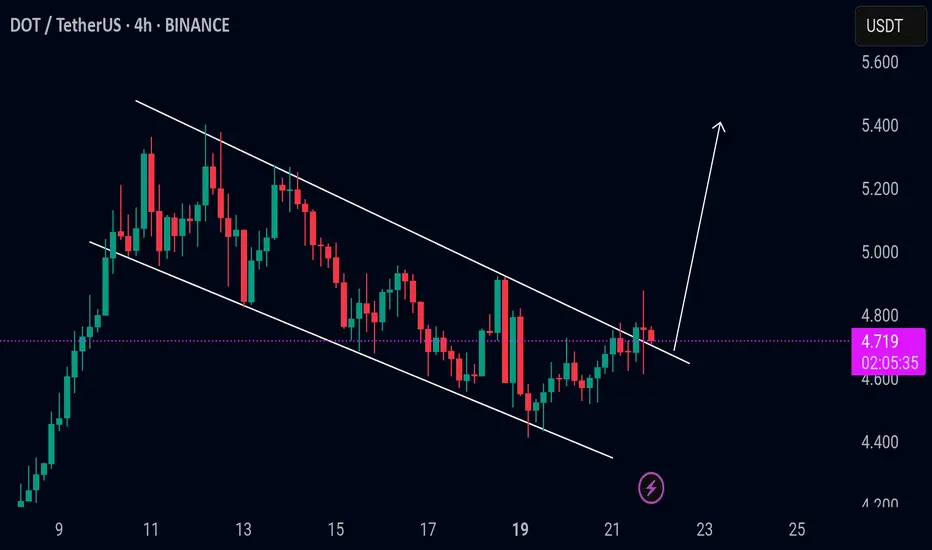
DOT/USDT – Trendline breakout confirmedHere’s a trading idea for DOT/USDT:
---
DOT/USDT – Trendline breakout confirmed
DOT has confirmed a breakout above its descending trendline, signaling a potential shift in momentum. If the price holds above the breakout level, a 10–20% pump could follow in the short term.
Key levels to watch:
– Breakout support zone
– Volume confirmation
– Immediate resistance ahead
Hold above the trendline could lead to further bullish continuation. Keep it on your radar.

#DOT/USDT#DOT
The price is moving within a descending channel on the 1-hour frame, adhering well to it, and is heading towards a strong breakout and retest.
We are experiencing a rebound from the lower boundary of the descending channel, which is support at 4.120.
We are experiencing a downtrend on the RSI indicator, which is about to break and retest, supporting the upward trend.
We are heading towards stability above the 100 Moving Average.
Entry price: 4.170
First target: 4.220
Second target: 4.246
Third target: 4.323

DOTUSDT 1D AnalysisDOT ~ 1D Analysis
#DOT Maybe you can consider this support block to start buying back from here with a short term target of at least 10%+, long term target $11.5

Polkadot Eyes $5.38 – Is a 17% Rally on the Horizon?As of May 26, 2025, DOT/USDT is showing signs of a potential bullish reversal on the 4-hour chart, forming a strong setup for upward movement. Key technical levels and chart structures support this bullish outlook.
1. Strong Support Zone
• Zone: $4.30 – $4.37
• This area has acted as a major support, where buyers previously stepped in, leading to strong upward moves. Currently, the price has rebounded from this support zone, suggesting renewed bullish pressure.
• A bounce from this zone with increasing volume confirms the strength of this level and validates it as a demand zone.
2. Bullish Entry Setup
• The entry appears to be positioned slightly above the support zone, near $4.60.
• The risk-to-reward ratio is favorable (~2.7), indicating a well-placed setup for swing traders.
• A small stop-loss (~6.36%) below the support at $4.30 protects against a false breakdown.
3. Key Resistance and Target Levels
• TP1 / Recent Resistance: $4.93
This level marks a recent swing high and minor resistance. A breakout above this would confirm short-term bullish continuation.
• TP2 / Major Resistance: $5.38
This is the major resistance level and final take-profit zone. It aligns with a previous market top, and its breach could lead to further bullish continuation into a higher timeframe breakout.
4. Projected Path and Price Action
• The chart outlines a bullish projection path, anticipating higher lows and higher highs forming a stair-step rally.
• This dotted path suggests a bullish trend structure with gradual momentum buildup.
• Buyers may continue pushing the price upward through TP1 toward TP2 in the coming sessions, especially if macro conditions or Bitcoin price action remain favorable.
5. Market Structure & Candlestick Behavior
• The market recently transitioned from a short-term downtrend into a consolidation phase.
• Bullish candlestick formations around the support zone imply accumulation.
• The recent bullish engulfing near the support further confirms buyer dominance and a potential trend reversal.
6. Risk Management and Outlook
• Stop-Loss: Below $4.30 to manage downside risk.
• Target Zones: $4.93 (TP1), $5.38 (TP2).
• A break below $4.30 would invalidate the bullish thesis and suggest caution.
• As long as DOT remains above the $4.37 zone, the bullish scenario remains intact.
Conclusion
DOT/USDT is currently in a bullish setup on the 4-hour chart with a high-probability reversal from the support zone. Traders may look for confirmation candles and volume support to enter long positions with TP1 at $4.93 and TP2 at $5.38. Risk remains contained below the $4.30 level.

DOT/USDT breakout alertDOT/USDT breakout alert
DOT has broken out of the bull flag pattern and is currently showing bullish momentum. The bull flag is a continuation pattern, and this breakout suggests the potential for further upward movement if the breakout holds with strong volume.
However, if the price falls back into the flag channel, it could be a fakeout, so it's important to monitor closely.
Key levels to watch:
* Breakout confirmation zone
* Flag support area
* Volume strength for confirmation
Keep an eye on DOT — a confirmed move above the flag could trigger the next leg up.
DOT MASSIVE PUMP LOADINGDOTUSDT did bullish BOS and now its retesting it and also trying to fill internal liquidity FVG. i will buy here as a swing trade.

DOTUSDT 1D AnalysisDOT ~ 1D Analysis
#DOT Buy when re -testing this support with a short -term target of at least 10%+ from here.

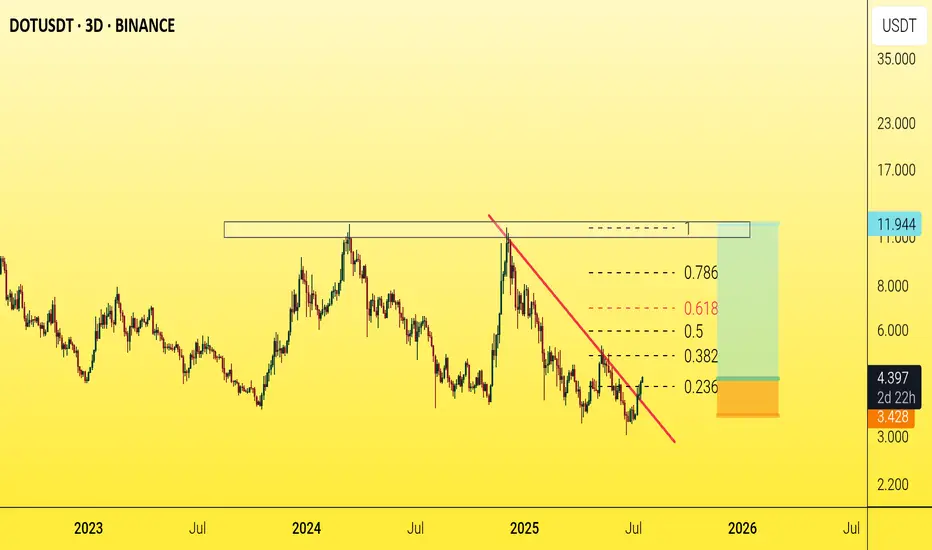
DOTUSDT - U should have some DOT in ur portfolio3D chart shows breakout a falling wedge pattern after a drop of 70% ... this is a strong buy signal
so keep ur eye on it! ... target is 12$
Best regards Ceciliones🎯

#DOT/USDT#DOT
The price is moving within a descending channel on the 1-hour frame, adhering well to it, and is heading towards a strong breakout and retest.
We are seeing a bounce from the lower boundary of the descending channel, which is support at 4.05.
We have a downtrend on the RSI indicator that is about to be broken and retested, which supports the upward trend.
We are looking for stability above the 100 moving average.
Entry price: 4.08
First target: 4.10
Second target: 4.15
Third target: 4.20

DOTUSDT: On The Way To $12 By End Of Year ? BINANCE:DOTUSDT The price of BINANCE:DOTUSDT has taken a turn, and it looks like it’s gonna follow the same pattern. Right now, the market is bullish, and we can see the price heading towards our target in the coming weeks.
Good luck with your trades
Thanks for your support! 😊
If you want to help us out, here are a few things you can do:
- Like our ideas
- Comment on our ideas
- Share our ideas
Team Setupsfx_
❤️

#DOT/USDT#DOT
The price is moving within a descending channel on the 1-hour frame, adhering well to it, and is heading for a strong breakout and retest.
We are seeing a bounce from the lower boundary of the descending channel, which is support at 4.40.
We have a downtrend on the RSI indicator that is about to be broken and retested, supporting the upward trend.
We are looking for stability above the 100 Moving Average.
Entry price: 4.43
First target: 4.50
Second target: 4.57
Third target: 4.64

#DOT/USDT#DOT
The price is moving within a descending channel on the 1-hour frame, adhering well to it, and is heading for a strong breakout and retest.
We are seeing a bounce from the lower boundary of the descending channel, which is support at 4.22.
We have a downtrend on the RSI indicator that is about to be broken and retested, supporting the upward trend.
We are looking for stability above the 100 Moving Average.
Entry price: 4.30
First target: 4.37
Second target: 4.46
Third target: 4.57

DOTUSDT 1WDOT ~ 1W Analysis
#DOT The lowest support that needs to be maintained, or this coin will experience further decline.

DOT Reaching Oversold Levels – Buy the Dip?DOT/USDT is currently trading within a well-defined range, with a key support zone around $3.50 - $4.00 and a major resistance zone near $10 - $11. The price has bounced multiple times from support and faced repeated rejections at resistance, highlighting a strong consolidation phase.
The Stochastic RSI is oversold, indicating that a potential reversal from support could be in play. If buyers step in at this level, DOT may attempt another move toward the resistance zone.
DYOR, NFA

#DOT/USDT#DOT
The price is moving in a descending channel on the 1-hour frame and is expected to continue upwards
We have a trend to stabilize above the moving average 100 again
We have a descending trend on the RSI indicator that supports the rise by breaking it upwards
We have a support area at the lower limit of the channel at a price of 4.50
Entry price 4.60
First target 4.72
Second target 4.85
Third target 4.99

#DOT/USDT#DOT
The price is moving in a descending channel on the 1-hour frame and is adhering to it well and is heading to break it upwards strongly
We have a bounce from the lower limit of the descending channel, this support is at a price of 4.10
We have a downtrend on the RSI indicator that is about to be broken, which supports the rise
We have a trend to stabilize above the moving average 100
Entry price 4.60
First target 5.40
Second target 6.02
Third target 6.80
