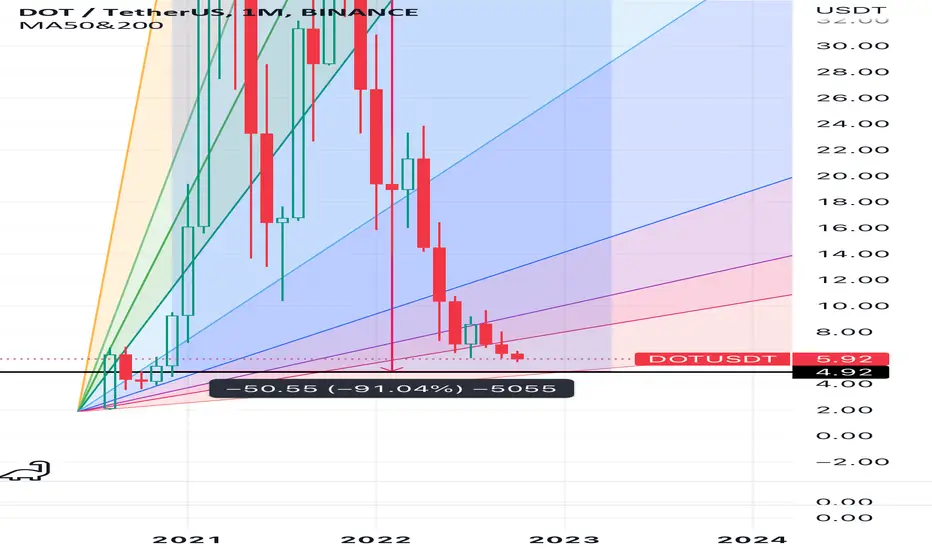
Polkadot DOT price growth is still aheadIt is very likely that the DOTUSDT price is currently in the process of forming a global reversal trend pattern - "Inverted Head and Shoulders"
Of course, the final confirmation of the pattern's formation will come after the DOT price is firmly established above $10, and buyers will need to make a lot of effort to achieve this.
Looking at the chart, we can say that the rebound of the DOTUSD price from the bottom can be called quite weak compared to other altcoins.
Buyers of Polkadot token have not broken "shorts stops" yet, which are most likely hiding above levels $7.20 and $8.20, which are the first targets for growth.
Once this target will reach - when the shorts' stops are broken - a price correction may begin.
The medium-term target for DOT price is growth to $10+.
Long-term target - growth in the range of $19-23.5
_____________________
Did you like our analysis? Leave a comment, like, and follow to get more
DOTUSDTPERP

"DOTUSDT" SHORT NEXT MOVE!!!!!!!!!Here we can see that "DOTUSDT" in 1 day time frame has a RESISTANCE at the zone at "6.363" and it can take REJECTION from that zone. And it take correction to the zone "5.024" as there is a 0.6 fibbonachi level.
ENJOY!!!!!!!!!!!!

DOT USDT POTINTAL MOVE !!!The dot recently broke its weekly downtrend and is currently in a consolidation zone. If the market remains stable, we may see a good rally in the dot.

DOTUSDT LONGHello guys, how are you ? I hope you are doing great
Today I came with a DOTUSDT buying opportunity since January 2023 polkadot has shown strength and upside move and it was able to break 2 levels which is the level of 4.587 and 5.725 and now we are retesting the zone between 5.544-5.814 most importantly we are retesting the broken trend line that has a great strength to the market . Drop down to a smaller time frame something like the four hour or hourly chart and find a double bottom or inverted head and shoulder pattern inside the zone is a wise way to trade long
Have a good day !

DOTUSD - one more leg down - SHORTDOTUSD remains in the downtrend.
A small pump to get rejected from the downsloping resistance line is still possible, however in our opinion one more leg down is coming. RSI has not been oversold yet.
The buy zone for the next bull market is between $4,70 and $3,50.
Don´t rush to buy.
Patience is a key

#DOT is going to reach 35$ before December 2023DOT broke the strong dynamic resistance weekly, and it will hit the first resistance zone under 10$ between 8-10$.
In the next six months, DOT will reach 19 & 23 $
In my view, DOT is going to reach 36$ before December 2023
The first resistance zone is 8.8--9.7, and after correction next important zone is between 14--16$ that Dot can reach that before May 2023.

DOT/USDT 3DAY UPDATE BY CRYPTO SANDERS Hello, welcome to this DOT/USDT 3DAY chart update by CRYPTOSANDERS.
I have tried to bring the best possible outcome to this chart.
Show some support, hit the like button, and follow and comment in the comment section. this motivates me to bring this kind of chart analysis on a regular basis.
CHART ANALYSIS:-DOT is moving in a long-falling wedge and presently holding over its strong horizontal support, from where we've previously seen a huge bullish rally.
RSI is in the oversold area, printing bullish divergence. We've to keep an eye on a solid breakout, which will confirm a pleasant bullish rally in it.
This is not a piece of financial advice.
Hit the like button if you like it and share your charts in the comments section.
Thank you

DOTUSDT Buy Setup!DOTUSDT Technical analysis update.
Buying DOTUSDT at the current price.
Stop loss: $4.38
Take profit 1: 4.57
Take profit 2: 4.71
Take profit 3: 4.85
Always use stop loss
thanks
Hexa

$DOT #DOT | LTF LONGIf you see some bullish breaker on 1H or below, you may think to open a long position.

DOT up to 50% possibleFalling wedge formation in 1D TF (Bullish)
⚫️ Candles turn bullish!
⚫️ Draw to the resistance level!
⚫️ Accumulation of volumes
⚫️ Computer analysis also speaks of growth
📈The buy zone and sell targets are indicated on the chart
❌Don't forget about Stop Loss

DOT ANALYSIS#DOT UPDATE.
#DOT is currently holding the double bottom support at the red line area and close below to the red line area could result in pullback support by the bearish divergence on RSI.

DOT 4H BUYDOT 4H support is at ~$5.4
Enter 50% at the current price
and try to set some BUY orders near the support zone
If DOT stays above the trendline,
the Take-Profit target would be 5%, 10%, and 15% from your entry
Cheers

DOT falling wedgedot looking great to accumulate down here
could see a nice move up here if we can break out of this falling wedge

#DOT/USDT 1DAY UPDATE Hello, welcome to this DOT/USDT 1DAY chart update by CRYPTOSANDERS.
I have tried to bring the best possible outcome to this chart.
Show some support, hit the like button, and follow and comment in the comment section. this motivates me to bring this kind of chart analysis on a regular basis.
CHART ANALYSIS:-DOT/USD was down by as much as 5% in today’s session, falling to a low of $5.72.
Today’s drop saw the token move closer to its support level at $5.60, which has mostly been in place for the last week.
Looking at the chart, the RSI also dropped to a floor of its own, with the index colliding with its support at 41.00.
Should the index move below this point, we will likely see Polkadot move toward $5.30, which would be a two-year low.
Traders will likely also be paying attention to the moving averages, as the indicator still looks positioned for further downward momentum.
This is not a piece of financial advice.
Hit the like button if you like it and share your charts in the comments section.
Thank you

Polkadot DOT price has nowhere to fall below. It's time for longIt's been a while since we did a DOTUSDT idea, then it's time to refresh our thoughts.
As you can see from the chart, the DOT price is clearly moving from one liquidity level to another, we have marked them nicely on the chart.
So, we assume that the price of the Polkadot token will consolidate a little more, buyers will gain strength and break up from the falling channel.
Therefore, we make an assumption for ourselves about the possible movement of the DOTUSD price
Long to $6.60 - correction - long to $7.90 - correction - long to $9.50-10
_____________________
Did you like our analysis? Leave a comment, like, and follow to get more

🟢 DOTUSDT - 1D (08.10.2022)🟢 DOTUSDT
TF: 1D
Side: Long
SL: $5.4930
TP 1: $6.8478
TP 2: $7.3891
TP 3: $7.8265
Expecting big things from DOT. Which ever path it takes should lead to a break out.

DOTUSDT sk analysis buying signalmarket in on the way to our pink buying area (WCL) after formation of III pink sequence also there breakout for the bullish correction LVL

Trading opportunity for long position DOTUSDTBased on technical factors there is a Long position in :
📊 DOTUSDT - Polkadot
🔵 Long Now 7.06
🧯 Stop loss 6.65
🏹 Target 1 7.70
🏹 Target 2 8.70
🏹 Target 3 10.00
💸RISK : 1%
We hope it is profitable for you ❤️
Please support our activity with your likes👍 and comments📝

DOT/USDT - LONG 12H TF----- Welcome, dear followers! -----
- Here is my trading methodology. I trade with a normal system and analysis of resistance and support, as well as price reversal patterns.
- For the record, I do not place a stop loss within my trades. So that I only risk 1.5% of my total capital in order to support the loss due to a price reversal against me.
- If a price reversed against my expectation and touched the drawn line r3, then I transferred targets to the entry point and waited for the price to close at it with a loss equal to almost zero.
- Today's deal is shown in the chart, and here are the entry and exit points below.
-- Support me with numbers and follow up on my account for other deals in the future. Thank you for coming to this part. --
-------------------------------------------------------
⚡️⚡️ #DOT/USDT ⚡️⚡️
Client: My-Binance Futures
Trade Type: Breakout (Long)
Leverage: Cross (2X)
Entry Targets:
1) 6.9 - 100.0%
Take-Profit Targets:
1) 7.468 - 25.0%
2) 7.968 - 25.0%
3) 8.573 - 25.0%
4) 9.653 - 25.0%
Trailing Configuration:
Entry: Percentage (0.5%)
Take-Profit: Percentage (0.5%)
Stop: Breakeven -
Trigger: Target (1)

DOTUSDT sk analysis crypto signal Market on the way to our yellow bc buying zone after formation of yellow sequence III and the RR 3:1

DOTUSDT - Buy setup!!DOTUSDT (1D Chart) Technical analysis
DOTUSDT (1D Chart) Currently trading at $6.4
Buy level: Above $6.32
Stop loss: Below $5.5
TP1:$6.84
TP2: $7.48
TP3: $8.1
TP4: $9.5
Max Leverage 3x
Always keep Stop loss
Follow Our Tradingview Account for More Technical Analysis Updates, | Like, Share and Comment Your thoughts

DOTUSDT Long Setup!DOTUSDT Technical analysis update
Buy zone : $6.15 - $6.27
Stop loss : $5.70
TP 1 : $6.70
TP 2 : $7.40
TP 3 : $8.00
TP 4 : $9.00
Always keep stop loss

Dot (polkadot) No. 1 on development this year .
One on crypto that have a large market cap , with great value and staking rewards
Same of BTC CHART , but it is an alt so dont expect to be better .
At 5 $ it can be a good price to me .
GOOD LUCK