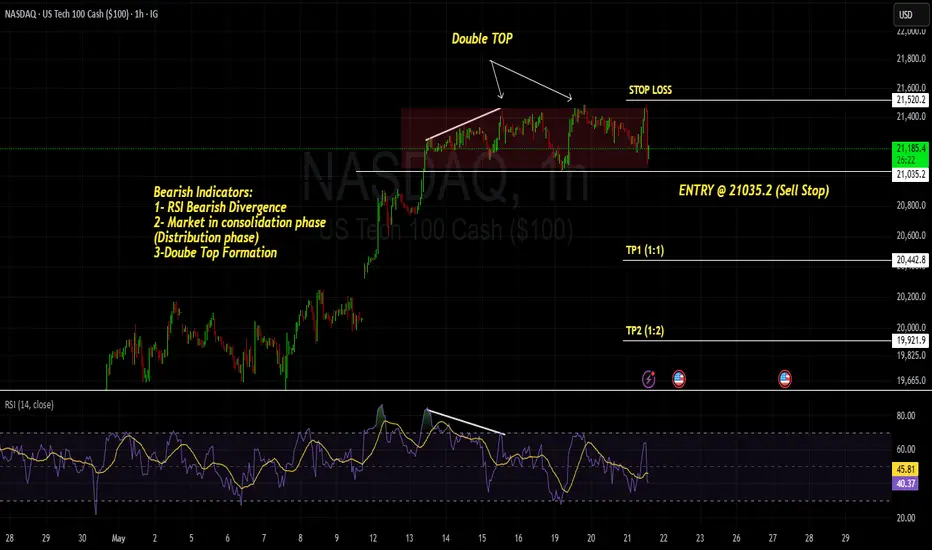
NASDAQ - SHORT SELL - AMAZING DOUBLE TOP PATTERN - REVERSAL patNASDAQ ; after forming series of HH and HLs is seem to be in distribution phase, we can see Divergence on RSI followed by Double TOP pattern which is a strong confluence for Reversal Pattern
we have a trade plan with our entry , once the accumulation phase (strong support) is broken as mentioned as ENTRY POINT (Sell Stop order) once our order is triggered we can place STOP loss above HL (or Resistance level) -
Our TPs would be TP1 with a Risk to Reward Ration 1:1 and other TP2 with R:R 1:2.
HAPPY TRADING GUYZ !!!!
"Better Trade your psychology and emotions, you will always be profitable"
Regards,
PROTRADEPROFESSOR
Doubetop
BluetonaFX - GBPJPY Double Top SHORT IdeaHi Traders!
There is a double top pattern formed on the 4H GBPJPY chart, and there is potential for further moves to the downside depending on whether we get an important support price break.
Price Action 📊
The market has had two price rejections around the 183 level, which is bearish. Although there is very strong support at 181.380, which is our support line, A price break below this level is likely to lead to a momentum break further down.
We are now looking for further bearish momentum to break and close the support line and the 20 EMA to continue to the downside.
Fundamental Analysis 📰
The market's outlook on GBP is currently negative due to weak economic data recently released. The outlook on the GBP looks very negative at the moment, and the demand for the currency is very low.
Support 📉
181.380: TRENDLINE SUPPORT
Resistance 📈
182.207: PREVIOUS DAY'S HIGH
Risk ⚠️
No more than 2% of your capital.
Reward 💰
At least 4% of your capital.
Please make sure to click on the like/boost button 🚀 as your support greatly helps.
Trade safely and responsibly.
BluetonaFX

USDSGD POSSIBLE SHORT ON BREAK OF TRENDLINEWe could see SHORT positions if we break the up trendline and close below 1.4000. At that point we will have confirmed M pattern or a Double Top.

GBP/USD Technical AnalysisStrong USD has also pushed the pound in a downtrend after 1.4250 double top and 1.3650 neckline has broke. I believe 1.3850 is the new swing high before the price creates another low below 1.34. On the long run I believe Pound will continue to be in a downtrend until it hits price 1.31 at a minimum and maybe continue from there.

Waiting for a SELL on CADCHFI think CADCHF on the 4hr timeframe is going bearish for a while.
And my confluences are:
*Double tops reversal pattern (bearish signal)
*Rested of the neckline(healthy chart pattern).
*Normal divergence (change of trend signal); you can check out the divergence yourself.
And the last confluence would be the entry reason; A bearish engulfing candle( bearish signal).
Stop loss is 1ATR above the high of the engulfing candle
Take profit is the next structure.
Feel free to criticize my analysis, we are all learners.
'Do not blindly buy CADCHF based on my confluences and do not enter the trade if my analysis is against yours.'

TSLA Double Top / Extended to 50% Fib from Last Up-TrendDouble Top / Extended to 50% Fib from Last Up-Trend...could dip into the New Year Holiday....

EURAUD AnalysisAfter the large sell off, I am expecting price to retrace and possibly test the previous double top on the 4 hour timeframe which also correlates to the 61.8 fib level. Expecting price to retrace before making it a bearish continuation and forming a new low.


AUDCADlove setups like this so we can see how price is moving in structure and that's keys to understanding the next wave or phase, now the outer structure would been better sell but understanding this can go early when you see price moving like this 2 setups RE at the top or RRE wait for the pull back and the continuations pattern
some big moves coming very soon with a few pairs across the board !


Muthoot Finance Looks BearishMuthoot Finance fake double top formation sell immediately with SL: 737


USDJPY - SHORT - RISING WEDGE + DOUBLE TOPWAITING FOR A WELL RECOGNISABLE CONTINUATION PATTERN WITH AN IMPULSE BREAK TO CONFIRM THIS SELL OTHERWISE NOT ACTIVE AS OF YET.
Bias: Short
Targets: Based on Fibonacci and structure
Confluences:
Rising Wedge (Reversal)
Double Top on daily resistance
Overall downtrend
On HTF - rejected with a bearish impulse from monthly resistance
RSI Divergence (Double Top)
Fibonacci Inversion measured on wedge pushing the price to daily support

Beautiful Double Top at $TMUS TMUS formed a nice double top pattern at the daily chart
Enter a short around 70$
Stop loss at resistance level around 74$
Price target = Breakout point (70$) - Height of the pattern (Resistance - Breakout ~ 4$) = ~ 66$

NZDUSD DAILY ANALYSIS On on weekly timeframe you'll see that that the pair has been ranging between 0.66500 & 0.68600 (210 pips) leading for the pair to been consolidating over the past 3 weeks. We have a monthly key level in which the pair has respected and recently however we deemed to have a false breakout in December which reacted off a weekly trendline (Upper descending pink trend line) where sellers pushed the price back into the consolidation zone. Leading into the end of last weeks closure we had a bullish close to the week with a bullish engulfing candle. However, let's not get over excited and risk our life savings on continued bull runs in the immediate upcoming. The pair has two significant key levels in which needs to test and close above (Monthly KL and Weekly Trendline before this occurs as not to forget we are still ranging in sideways movement. A potential double top has began to form with a slow down of momentum on last weeks closure with a H4 doji. This could push price back down to daily physiological key levels of 0.67000. Keep a close eye going into the Asia session for H4 closures underneath our monthly key level 0.68600. Don't forget even though we are moving sideways and the price is riding the moving averages, there is still a lot of opportunities to grab pips from this pair.


BTC FractalBitcoin Fractal + Horizontal Levels
Bitcoin may follow my path or it could dump lower, this is just an idea.

BLNK M Pattern Short SetupBLNK last week had a impulsive move to new 20 day highs.
Since then that move has faced recent selling order flow.
This pattern is a proprietary pattern I develop that I look for to place a trade.
According to the text book its a M top but I have made tweaks to suit me to trade this pattern at the reversal points on the chart.
If there aren't any major gaps on the open looking to trade this market short
B

Annoying BITCOIN And SPY-Comparison! You WILL believe THIS!Hey Friends <3
Once again - as this nerd I am - I tried to compare SPDR S&P 500 with Bitcoin. Also here we can see some interesting similarities on the charts.
- Bull run in December/January
- Double bottom
- Double top
- Spike out from Downtrend Channel (LOG-scale)
And what happened hereafter with SPY? A crash down back in the downtrend channel. Let me just make it super short!
1. I know we all really want Bitcoin to moon, but just be careful, guys. We are not in an uptrend yet - We are still in a bear market, UNTIL WE REACH 11,700 USD!! Again: I'm not saying we will crash like we did in 2014. And I'm not saying, that we will go back in the downtrend channel again. Just keep it in mind, that it can happen, and don't fool your self.
2. I truly believe in Bitcoin and cryptos in the long run. It is possible to be bullish short term, bearish midterm, and super bullish long term! I'm not trying to create any kind of FUD. If it was up to me, I would hope BTC would be 1 mil. USD tomorrow. I'm trying to be realistic, and I'm trying to help you out, so you don't FOMO into something.
D4 Cares about You <3
Please leave a LIKE for the hard work, I put in making charts every day here for you guys on TV. And have a nice day :)

Stratis very interesting price action and levels to observeWe can see double top which stopped bullish movement with candle with long wick. I marked 2 GAP's which are respected by market in some way. The bottom one is clearly respected by market and gave nice push for the pair to move higher.
I decide to put many arrows on the chart:)
I would suspected that the pair will try to rebound from these 3 levels. In my opinion the most probable is that the pair will move higher after it will find support around bottom GAP. It is also quite possible that the pair will create double bottom.
I will be looking for the 0.0045 or something close to that as TP.
