PAISALO - Poised to break all time high, for a swing of 25%The stock is in strong uptrend in all time frames - higher to daily and above.
The stock is in strong momentum based on RSI in D, W, M. All above 60.
Daily is reversing from a Higher low formation with double bottom and Morning star formation.
One may consider an entry based on today's close candle, or even at cmp if aggressive.
Entry - 104/105
Target - 112 , 126, 136.
Trail profits after each target.
Double Bottom

TLT: Falling Wedge Double Bottom at .382 with Bullish DivergenceThe TLT looks like it's trying to form a Double Bottom at the 0.382 Fibonacci Retracement, it is also Bullishly Diverging at this level, if it holds up I think it could go up to as high as $96 near the 200-period Simple Moving Average which would also fill the gap. From there I'd think it could continue back down.
I will be selling weekly puts around the lower 90 strike and buying weekly calls at the same level.

CHFJPY 1H Possible Double bottom in an up trend channelOn this 1H chart for CHFJPY we can notice that the price has been moving in an up trend channel for a while now. Recently it dropped to test the up trend support. At this stage the price is forming a potential double bottom. Monitor it for a potential breakout.
Additional confluences:
- MACD can produce a bullish cross if the price starts going up to complete the Double bottom
- The 2 bottoms are re-bouncing from the 200 EMA
- If the price goes up, in can cross above the 20 and 50 EMAs. Monitor for a bullish cross

Sherwin Williams LongSherwin Williams has printed a Double Bottom set up on the Daily Chart. Ideal target is to the neckline.

ReTo Eco Solutions A double bottom has formed on ReTo. Our preferred method is to trade the asset back to the neckline and not to the target. Remember all Double tops and Bottoms are nothing but price retuning to supply and demand zones.

Double Bottom on EUR/USD @ H4This short-term double bottom chart pattern has formed on the H4 chart of EUR/USD following a clear downtrend. I will use this formation as a potential bullish entry. The two bottoms are marked on the chart. The neckline is marked with the upper yellow line. My potential entry level is at the cyan line. My potential take-profit level is at the green line. A stop-loss (not shown on the chart) will be set to the low of the breakout candle or to the low of the preceding candle should the breakout one appear mostly outside the pattern's borders. I will ignore short signals here.

EURUSD 4H Buy Potential with 3 ConfirmationHello guys, this is my idea about EURUSD 4H TF. There is a buy potential for EURUSD because there is a resistance area, trendline, and double bottom. If all of them break it is a buy opportunity. I set my Order Block area there too.

BANK NIFTY:DOBLE BOTTOMOver the past few days, NSE:BANKNIFTY has been exhibiting a downtrend, indicating a bearish sentiment in the market. However, a notable development is the formation of a double bottom structure, which could potentially signal a reversal in the current trend.
The double bottom pattern is a bullish reversal pattern that typically occurs after a prolonged downtrend. It consists of two troughs or "bottoms" at approximately the same price level, separated by a peak or "neckline." In this case, traders are advised to observe the pattern for a potential breakout.
To initiate a trade based on this pattern, one should wait for a breakout and closing of a candle above the neckline. This breakout acts as a confirmation of the potential trend reversal. It is crucial to emphasize the importance of waiting for a candle close above the neckline to reduce the likelihood of a false signal.
The target for this trade is calculated by measuring the distance between the low of one bottom and the neckline. This distance is then projected upwards from the breakout point to estimate the potential upward move. Traders should keep in mind that the target is a theoretical projection and may be influenced by various market factors.
Additionally, it is common for the market to retest the breakout level after the initial breakout. Traders should be prepared for a retest and not be alarmed if the price revisits the neckline. The retest provides an opportunity to confirm the strength of the breakout and potentially add to the position.
Risk management is paramount in any trading strategy. Traders should determine their risk appetite and set a proper stop loss level. The stop loss should be placed below the second bottom or at a level that aligns with the trader's risk tolerance. This ensures that losses are controlled in case the trade does not unfold as anticipated.
In summary, the analysis suggests a potential opportunity for a bullish trade in Bank Nifty based on the double bottom pattern. However, traders should exercise caution, wait for a confirmed breakout, set realistic targets, and implement effective risk management to enhance the probability of a successful trade.

Breakout & Re-test of ~5.5 year Falling WedgeBitcoin Cash was in a falling wedge for nearly five and a half years before it broke out of it back in June of 2023. Presently, it is re-testing the top of a dashed-line wedge drawn from wick to wick and has failed to reach the top of the solid wedge drawn from the line chart.
Holding above the wedge could lead to an approx 5.25x move against Bitcoin from its current position at 0.0057 to TP 1 at 0.030 and an 11.75x move should it reach TP 2 at 0.067.
It's possible we could see a double-bottom with a slightly higher low around 0.0041 or 0.0040 if it re-tests the solid wedge's top over the next weeks or into March or June, before moving up towards targets.
Should a wedge re-test and double-bottom occur first, the possibility for already major gains vs. Bitcoin increases to 7.3-7.5x at TP 1 or 16.34-16.75x at TP 2.

EURUSD 4H potential Double bottomThe EURUSD on a 4H chart shows a drop down to a strong support range (Orange range) which aligns with the 0.618 Fib. Around those levels, the price started forming a potential double bottom.
For the pattern to be valid, the price needs to go up without dropping below the low points and produce an effective breakout above the neckline range ( Blue range )
Additional confluence: RSI is showing a Divergence

NZDUSD 30m Double bottomOn this chart for NZDUSD 30m you can notice that the price is forming a Double bottom. The bottoms are bouncing from a strong resistance range that has been created from multiple low points starting from the 14th/15th of December 2023 ( Zoom out the chart so that you can see them ).
Additional confluences:
- MACD Bull cross
- RSI was oversold at the time of the first bottom and now it's showing reversal in momentum

GBPCAD - Bullish Double Bottom 📈Hello Traders !
On Wednesday 27 Dec, The GBPCAD Reached a Support Level (1.67077 - 1.67633).
The Price Formed a Double Bottom Pattern.
Currently,
-The Neckline is Broken.
So, I Expect a Bullish Move 📈.
-----------
TARGET: 1.71100🎯

CANDYUSDT - KUCOIN LONG SETUPAs we can see that candyusdt forming a falling wedge with bullish divergence after printing double bottom pattern.
If the bulls took control , the possible resistance level are mentioned.
NFA
DYOR

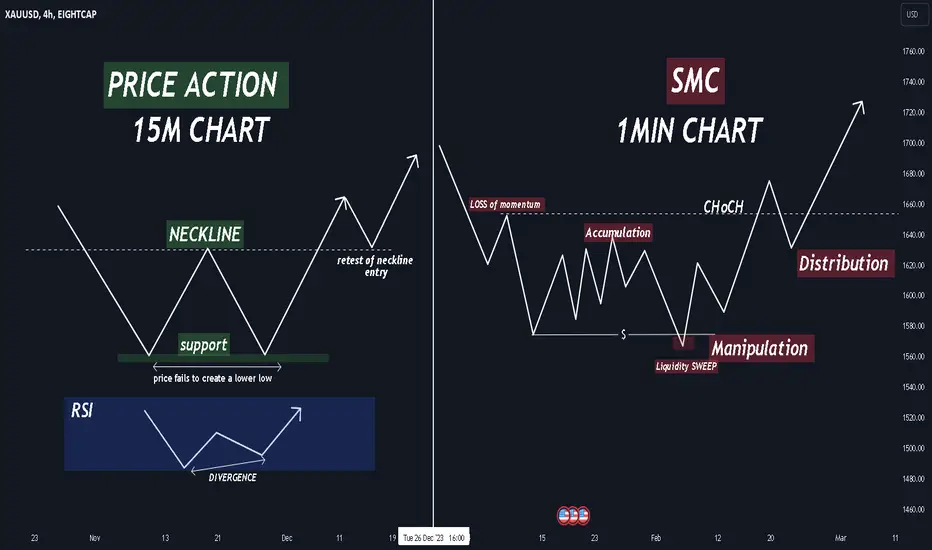
PRICE ACTION VS SMART MONEY CONCEPTS : the double bottomIn the world of technical analysis, the double bottom pattern holds a special place for traders. However, the way this pattern is interpreted can vary, especially when comparing the traditional price action approach with the more intricate Smart Money concepts.
Traditionally, a double bottom is identified by the formation of two distinct lows, approximately at the same price level, separated by a reaction high. Traders keen on price action look for a breakout above this reaction high as a signal for potential bullish momentum.
As a price action trader i was interested by the Smart money concepts approach so i decided to read about it a little bit and i found it pretty detailed after reading here are the differences that i noticed on the double bottom pattern.
WTI (Crude oil) 1H Double bottomThe Crude oil is forming a potential double bottom on a 1H chart
Zoom out the chart to see the Bigger picture.
The price has been moving in a general down trend channel. Recently the price broke out of it to the up side and now it's retesting the former down trend resistance. On it, it's forming a potential double bottom.
Additional confluences:
- Oversold RSI on the first bottom
- MACD Bullish crossing between the 2 bottoms

Alaska Air Group: Double BottomOverview
Alaska Airlines is a subsidiary for Alaska Air Group. If you aren't familiar with the verbiage, this means that Alaska Air Group ( NYSE:ALK ) is the umbrella company that owns Alaska Airlines. In light of the Boeing ( NYSE:BA ) mishap that occurred yesterday in Oregon and in addition to the current trend on ALK's 1D chart, I believe ALK will correct to $30-31.
Technical Analysis
According to the 1D chart, ALK has been on the trajectory of a double bottom since July 2023. The last dip in the double bottom formation rests around $30-31 which I believe will approach sooner than expected due to ALK's grounding of an entire fleet of Boeing 737 MAX-9s. As long as nothing else negative comes to light, I believe ALK will begin its rise to $57 sometime after arriving around the second dip of the double bottom.
Market Psychology Speculations
I believe Boeing will catch most of the negative press but that doesn't mean Alaska Air Group is off the hook. Because ALK's subsidiary has also been in the headlines, I think the double bottom is going to accelerate. Alaska Airlines has received bad press twice in the last 12 months for narrowly avoiding aircraft-related catastrophes; the first concerning an off-duty pilot that attempted to cut off the engines mid-flight.
All that said, after the initial dust has settled, I believe the markets will forgive ALK and a potential recovery will begin. Kudos should be given for having the proper procedures in place that helped return both aircrafts back to the ground safely without incident. The next major factor that needs to be considered is how the grounding of an entire fleet will affect their balance sheets for the upcoming Q4 Earnings Call.
Fundamental Analysis
I will perform a fundamental analysis within the next few days. Due to market reactivity I don't believe a healthy balance sheet will cushion the share price until after the Q4 Earnings Release.

NG1! Bullish WeeklyNatural Gas has been consolidating for almost a year now at an 886 fib retracement, considered deep value. The week of December 11th ran all local lows going back to June 2023 and had the highest volume in 3 years. Could be putting in a bottom here?

First Wave BioPharma $40 PT Upside potentialBefore the close of the year the Bio Pharma Sector started running wild. It doesn't surprise me why i'm drawn to this company with all the catalysts coming out. Recently with a PT 40 From Roth MKM.
The more you read about the news that comes from this company between CEO investor relations, Merger Deal with Immunogen and entering their phase 3 trial there is so much Upside potential.
Although short term there's a lot of turbulence in the 5.00-5.38 range if it can break and hold strong this stock can get there pretty quick.
Currently holding a Long position.
Trade Responsible,
#TradeTheWave 🏄🏽♂️🌊

Solara - The Sun is Rising Behind the PyramidSolara Active Pharma:
After the CEO of Solara resigned 1.5 years ago, the Company shares faced a major crash - retracing near 100% on Fib scale. A large Pyramid like structure was formed eventually
Over the past few months - the price has started to strengthen the base taking support near the 290-300 zone which is one the Strongest support for the script
A Bullish Reversal sign is seen when a Right Angled Triangle pattern was formed and successfully breaking out of the Pattern along with the next immediate resistance at 410. I can also be seen as a Double Bottom pattern - long long way to go
Its changing direction from being a Sunset company to a Sunrise company. With the Breakout of Pharma sector, many Pharma companies are having their dream run and SOLARA is riding the journey along with its peers.
The Sun is Rising behind the Tall Pyramid. Wait for Large Targets ahead - 550, 830, 1200
Disclaimer:
Stocks-n-Trends is NOT a SEBI registered company. We do not provide Buy / Sell recommendations - rather we provide detailed analysis of how to review a chart, explain multi--timeframe views purely for Educational Purposes. We strongly suggest our followers to "Learn to Ride the Tide" and consult your Financial Advisors before taking any positions.
If you like our detailed analysis, please do rate us with your Likes, Boost and share your comments
-Team Stocks-n-Trends

Double Bottom - UCHFHere I have the USD/CHF on the 1Hr Chart.
Price action has outlined what looks to be a possible strong reversal pattern, the Double Bottom!
Price has given us two Lows with the most current being a Higher Low. Now I expect with price reaching back up to Confirmation of Pattern @ .8451, we should be given a Break of Confirmation for price to begin creating Higher Highs!
RSI was heavily Oversold on the first Low created and looks to start working up above 50 after the last Low!
*Chart Patterns are known to fail 1/3 of the time so BEWARE OF FALSE BREAKS!
-Pattern Prediction-
*If Price Breaks and Closes below .83562, Pattern INVALIDATED!
*If Price Breaks and Closes above .8451, Pattern CONFIRMED!

FTM's Situation: What Shall we Expect ?➡️Double bottom is in forming on weekly timeframe.
Looking for the retest of the neckline, If the neck breaks, it will witness good growth.
- High potential areas are clear in the chart.
- You can look for reasons to enter according to your own personal strategy after approval.
-AB=CD
🤑Stay awesome my friends.
_ _ _ _ _ _ _ _ _ _ _ _ _ _ _ _ _ _ _ _ _ _ _ _ _ _ _ _ _ _ _ _ _
✅Thank you, and for more ideas, hit ❤️Like❤️ and 🌟Follow🌟!
⚠️Things can change...
The markets are always changing and even with all these signals, the market changes tend to be strong and fast!!

CHFJPY - Double Bottom 📈Hello Traders !
On The Daily Time Frame, The CHFJPY Price Reached a Support Level (162.202 - 161.259)
The Price Formed a Double Bottom Pattern.
Currently,
The Neckline is Broken.
So, I Expect a Bullish Move📈.
Let's Wait for Retest...
---------
TARGET: 169.200🎯

$NIO potential double bottom in value areaNIO high time frames look to be putting in a double bottom at the .886 fib node, considered to be a deep value area.
Monthly bullish engulfing candle if it closes around here on Friday.
Invalidation could be multiple weekly candle closures below $8.38, low from Oct ‘22, would let this run potentially to $20 region if it really gets going.
