📌 Potential LONG-TERM SELL setup for: AUD/USD👩🏽💻 Technical overview: AUD/USD has had difficulty surpassing several Moving Averages on higher timeframes. The daily support level was recently breached. Furthermore, the last daily candlestick showed a long upper wick, often indicating intense selling pressure. The 0.65 level is significant as this level might allow for a double bottom pattern to form on the 4-hour chart.
🎯 Potential Entry Strategies:
• Scenario A Bullish Outcome: If the price doesn't drop below the 0.65 level, it could complete the formation of the second bottom of the double bottom pattern. This could then lead to a bullish reversal.
• Scenario B Bearish Outcome: If the 0.65 level is broken, we could expect further downward movement in price.
Double Bottom

NEOUSDTNEOUSDT is trading in bearish trend and recently it has formed double bottom pattern with strong bullish divergence.
price is fading selling pressure after double bottom pattern seems like bulls will take control from here.
If the price is successfully close above 8.5 level, it will be time for bulls to take control.
What you guys think of it ?

JUBLIANT PHARMA Levels, swing posed for an upmove of 20%
1) Monthly - Reversing from Previous low after a proper Double bottom Reversal Pattern.
RSI perfectly moving from oversold to strength of 60+. Mid term investors may look to accumulate at the demand zones with Previous low 270 region as SL for a target of 625+.
2) Weekly shows a good breakout breaking out of an 8 months old stiff resistance,
after having consolidated for solid 7 weeks.
3) As the daily RSI is in overbought zone, one may consider buying at the retest of the trendline breakout at 420 zone or the demand areas marked in green.
Demand zones - Green zone.
Supply zones - Black zone.

1211: Maaden (Support Zone)Price has touched an important support level
Level has been respected several times recently
An upside movement potential is evident
Trade with SL, ride the trend with trailing SL

Double bottom on the 15We can see a pretty nice example of a double bottom on the 15 with just over 4 weeks before the next witching. The next few weeks should be pretty interesting.

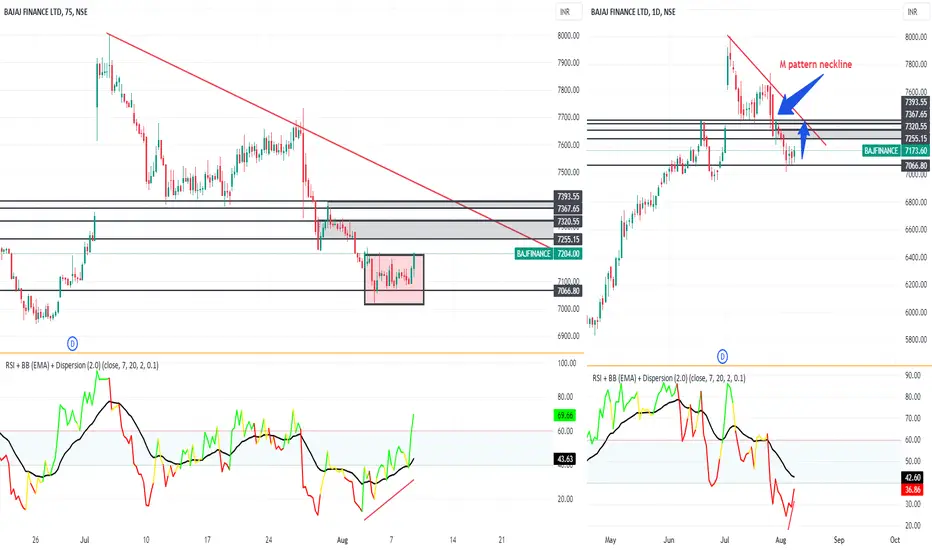
Baja Finance Intraday Trade Levels and AnalysisThe stock is reversing from demand zone after 4 days of consolidation in the same zone, also there is a double top breakdown in Daily time frame, and the stock is poised for a retest of the Double Top neckline area.
75 minutes shows Double bottom very evident with RSI divergence and RSI moving into 70+ strength zone, an up move of odd 7200-7400 levels is possible.
Hence with the above levels, one can consider a long Intraday trade with an RR of min 1:1 or max even 1:2.
EURCAD - New Breakout !Hello Traders!
On The Daily Time Frame, The EURCAD Reached a Support Level !
Currently, The Price Failed to Create new Lower Low 📉 and formed a Double Bottom Pattern !
Moreover, The Resistance Line is Broken🔥
So, I Expect a Bullish Move📈
-----------
TARGET: 1.48350🎯
___________
if you agreed with this IDEA, please leave a LIKE, SUBSCRIBE or COMMENT!

Essex Property Trust DCA - Double bottom Company: Essex Property Trust
Ticker: ESS
Exchange:NYSE
Sector: Real Estate
Introduction:
In our latest technical examination, we focus on Essex Property Trust, a significant player in the real estate sector. The daily chart brings to light a possible bullish reversal pattern, specifically a double bottom, which has been in development over the last 279 days.
Double Bottom Pattern:
A double bottom is a classic technical analysis pattern that suggests a potential reversal from a preceding downward trend. It is characterized by two distinct troughs at roughly the same price level, with a peak in between – visually resembling the letter 'W'.
Analysis:
Essex Property Trust's prior trajectory was bearish, marked distinctly by the blue diagonal resistance line. However, the formation of the double bottom pattern suggests a potential shift in this trend. The horizontal resistance, or the "neckline" of the double bottom, is identified at 240.88$.
Currently, the stock's price is not only above the 200 EMA, indicating a bullish ambiance, but it has also surpassed the horizontal resistance. This breach makes the case for a bullish entry more compelling. Based on the depth of the pattern, our projection for the price target stands at 286.23, translating to an approximate upside of 18.81%.
Conclusion:
Essex Property Trust's daily chart paints a promising bullish picture, signaled by the double bottom formation and the breach of key resistance levels. A favorable trading opportunity seems to be on the horizon, provided other market conditions remain supportive.
-------------------------------------------------------------------------------------------------------------------------
As always, ensure that this analysis integrates seamlessly into your comprehensive market research and risk assessment practices. It should not be misconstrued as direct trading advice.
If you found value in this analysis, please consider sharing and following for more insights. Wishing you successful trading!
Best regards,
Karim Subhieh
Disclaimer: This technical analysis is intended for educational purposes and does not constitute financial advice. Always conduct thorough research and seek advice from a financial consultant before making any investment decisions.

✅NZD_JPY DOUBLE BOTTOM|LONG🚀
✅NZD_JPY was going down
But then the pair established
A double bottom pattern at 86.39
And upon a rebound broke the
Neckline of 86.82 so I am
Now locally bullish biased and
I think that we will see a
Potential move up
LONG🚀
✅Like and subscribe to never miss a new idea!✅

Double bottom pattern Today stock or it call stock of the weak
*Berger paints India Ltd
Fundamental analysis
market cap 68451cr
PE ratio 79.5 this High value compare to 1, 5&10 years, lower compare to 3years PE
PEG ratio >1 to high
ROCE 23.8
ROE20.4
Dedt to equity 0.6
EPS 8.85
Technical analysis
Double bottom formation
Near at resistance level of the double bottom
Current level is main resistance 707and next resistance is 745
Can get 1:1 ratio of risk reward
Take 550 as a stop loss can get 1000+ 1:1.5 ratio risk reward

DOGEUSDT Technical Analysis Update📈 #DOGEUSDT Technical Analysis Update 📈
🐻 Trend: Bearish
🐮 Divergence: Bullish
⏳ Reversal Pattern: Double Bottom
🚀 Breakout Confirmed: YES
📊 Trade Idea:
📌 Buy Entry: Market order at current price
🛑 Stop Loss: 0.07254
🎯 Take Profit: 0.07847
#TechnicalAnalysis #Cryptocurrency #TradingOpportunity
📈 Trade with caution and do your own research.
💼 This is not financial advice, it's for educational purposes only.
🙏 Always use appropriate risk management and set stop losses.
💰 Invest only what you can afford to lose.
Happy trading! 🚀📊 #TradingView #CryptoTrading #InvestmentAdvice

Completed Retest the support | Go up to $29Chart 4H TF
Solana BINANCE:SOLUSDT has completed retest the previous Lower Low acts the support then bounced back to $24.xx
That's a famous Reversal Pattern, Double Bottom
We can Long at two zones on this chart
Wait for a next move

DBL TOP on MSFT? Waaaat! Long Term chart. #MSFT This double top on MSFT screams downside for the Stock Market in August, don't it? July 31st 2023. Levels = From 335 down to 320 316 off 21 SMA. 21 SMA bounce right here??

Retest and bounce along ascending trend line | LONG BiasDaily Chart
Matic BINANCE:MATICUSDT has downing to support zones around 0.7135
Chart 4H TF
Matic's in descending channel and under descending trend line that is resistance when BINANCE:MATICUSDT bounced from support (0.7135)
I expect MATIC will go up to around 0.739
Time will tell

EURAUD FORECASTAs we can see the market making a double bottom pattern; if market breaks the resistance then we can place a trade in upward direction when market comes for a retest

CADCHF DOUBLE BOTTOMCADCHF has formed a DOUBLE BOTTOM between 20th Aug and 20 Dec
price is trading above the entry level @ 0.71856 with stop @ 0.70975 with target projections to 0.73489/0.74172

CADCHF DOUBLE BOTTOMCADCHF has formed a double bottom on its daily chart.
Price is trading above the entry level 0.71856 and has target 73489.
double bottoms patterns are only valid when price trades above the entry level.
stop 0.70975
tp2 074236

USDCHF I Brief short and break of neckline Welcome back! Let me know your thoughts in the comments!
** USDCHF Analysis - Listen to video!
We recommend that you keep this pair on your watchlist and enter when the entry criteria of your strategy is met.
Please support this idea with a LIKE and COMMENT if you find it useful and Click "Follow" on our profile if you'd like these trade ideas delivered straight to your email in the future.
Thanks for your continued support!

AVTR - Base BuildingAVTR had formed a double bottom since 27 Apr but it was not until 19 Jul that it began to gain momentum to the upside, rising and staying above a mini neckline @ 21.80 since 21st Jul.
It is expected to announce earnings tomorrow on 28 July. Should the stock rise on earnings release, I would be interested to accumulate on the next dip. However, as the stock is still within its basing formation with neckline @ 25.20, it is ok to wait conservatively till a confirmed rise above this neckline before accumulating (on dips). There is still a lot of room to move should it manage to rise above the base.
p/s: it is always safer to look trade setups AFTER earnings announcements. (disclaimer).
Disclaimer: Just my 2 cents and not a trade advice. Kindly do your own due diligence and trade according to your own risk tolerance and don't forget that money management is (probably the most) important! Take care and Good Luck!

EURCHF - from Daily to M30📹Hello TradingView Family / Fellow Traders. This is Richard, also known as theSignalyst.
📈 Here is a detailed update top-down analysis for EURCHF.
Which scenario do you think is more likely to happen? and Why?
📚 Always follow your trading plan regarding entry, risk management, and trade management.
Good Luck!.
All Strategies Are Good; If Managed Properly!
~Rich

📈AUDUSD Bullish Gartley Pattern: Time to Ride the Trend! 🚀Hey fellow traders! There is an exciting setup on the AUDUSD forex pair in the 4-hour timeframe. Let's dive into the details and explore the dynamics between buyers and sellers.
🐻 Sellers' Struggle: Price has formed a bullish Gartley pattern, indicating a potential reversal in the downtrend. During the recent downtrend, sellers were in control, pushing the price lower. However, as we approach the completion of the Gartley pattern, sellers are facing increasing resistance from buyers stepping in to defend crucial support levels.
🐂 Buyers' Resurgence: The formation of the Gartley pattern is a testament to the buyers' resurgence. They have been gradually regaining control, leading to the price forming higher lows in lower timeframes. Now, as we witness the bullish Gartley pattern's completion, buyers are expected to strengthen their positions and propel the price upwards.
💹 Technical Confirmation: The EMA 9 and 21 have crossed over, signaling a bullish trend reversal. This crossover adds to the confidence in the buyers' ability to push the price higher. Additionally, the RSI breaking above the 50 level confirms the growing bullish momentum and adds further weight to the buy signal.
🎯 Profit Targets: To capitalize on this opportunity, I have set my take profit levels strategically. My first take profit is set at TP1 = 0.6800, which aligns with a significant resistance turned support zone. TP2 = 0.68500 is my next target, considering the potential for a strong bullish move. Finally, my ultimate target is set at 0.69000, aiming for a breakout of the previous resistance level.
Remember, successful trading requires proper risk management and sticking to your trading plan. 🛡️
Feel free to share your toughts in the comments section, follow me for updates and don't forget to press the like button if this insight was helpful 🚀

Double bottom pattern breakout in DEEPAKNTRDEEPAK NITRITE
Key highlights: 💡⚡
✅On 1Hour Time Frame Stock Showing Breakout of Double bottom Pattern .
✅ Strong Bullish Candlestick Form on this timeframe.
✅It can give movement up to the Breakout target of 2040+.
✅Can Go Long in this stock by placing a stop loss below 1985-.

FTM ""Double Bottom"" Weekly ChartFTM is looking great as it is also forming a double bottom on weekly timeframe. The higher the timeframe the better it is.
It also started to form bullish divergence on 4h timeframe as shared in the previous idea.
We need to wait for the BREAK and RETEST of the NECKLINE marked with orange dotted line.
LETS PUMP IT !!
DYOR, NFA
