DXY BULLISH PRICE ACTION- CHASE SHORTS AGAINST USDDaily chart of the queen Dollar is forming a beautiful DB. This is a good chance to short USD pairs such as GBP/USD, EUR?USD, AUD/USD and CHF/USD.
wait for a good enter position and hold shorts.
Double Bottom

3m is on monthly support 3m is on monthly support and all set to take off wait for the confirmation as it could be a great trade according to risk and reward ratio

UPST - will it succeed in breaking up?UPST formed a double bottom base over the last 6 months with a horizontal neckline at 26 The odds of a successful breakup has increased this time owing to the overall market strength. A daily CLOSE above could be significant as it has not been able to so for the past 6 months.
Other factors increasing optimism (of a successful break in the near future) is some strong volume accumulation since it's earnings beat on 10th May, gapping up strongly and only partially filled before propelling higher. Most likely this is a breakaway gap - signifying trend reversal (ie, from down to up) that will not be filled anytime soon. Also, it's 200 day moving average has already flattened out and the stock is now trading well above it.
Bear in mind that stocks priced below $50 could have a lot more volatility on it's daily movement (both ways) and trailing stops need to cater for that.
Disclaimer: Just my 2 cents and not a trade advice. Kindly do your own due diligence and trade according to your own risk tolerance and don't forget that money management is important! Take care and Good Luck!

EURUSD Technical AnalysisHello guys 👋
This is my prediction on the EURUSD that I use in Timeframe 4H on Forex.com. Seen the movement of EURUSD is still downtrend but there is a potential double bottom and break trendline so that it has the potential to cause bullish. All of my prediction need a confirmation.

ADAUSDT BULLISH IDEA (DOUBLE BOTTOM)Potential Bullish Entry Dow Theory In Place -
Higher High and Higher Low Expected in Place
Formation of double bottom coupled with bullish divergence (Bullish reversal pattern)
Entry, SL & TP Levels are defined.

#BTCUSDT Possible bottom for Bitcoin. Bitcoin price is attempting to establish an A&E double bottom pattern, hammer at low, 25904.27, set fractal alerts; 4h.
Bear fractal: 26436.10
Bull fractal: 27512.15
Target: 27723.99

Simple Path Possibilities for BTC DomSuper simple / quick post. Bitcoin dominance had a confirmed double top, and now may or may not confirm a double bottom.
If it does, it will likely move up to resistance and then back down before deciding to break through resistance or support.
Otherwise, it may just lose support

Gold creating its 3rd higher high after a steep declineI believe it's time to counter trend trade this pair. I plan on counter trend trading this pullback(retracement) of a daily lower low. TDI was too bearish on the 4hour chart from me to take a long position on Friday but now, all signs are clear for a buy upon a reversal signal at re-test. The swing high is around 1983.27 the swing low is around 1958.15. the neckline for the double bottom is the weekly support. I've already remarked up my chart for the 4hour supports and resistances. I intend to trade as relatively close to naked as possible since the candles speak for themselves as loud as the fundamentals. We're up all night to get lucky as we become more patient with this setup we'll learn that it's the simple fundamentals and basic levels of structure that determine our bias for direction we must be attentive and prepared to switch immediately upon a retest of structure.

AUDUSD- Bullish ReversalFX:AUDUSD
Current Trend
AUDUSD is in Bearish Trend.
A Bullish Divergence can be seen with Double bottom indicating a bullish reversal. If the trend breaks the neckline of previous LH , It will go Bullish.
Entry to be taken at the neckline with stop loss defined at previous LL.
Risk Percentage : 2%

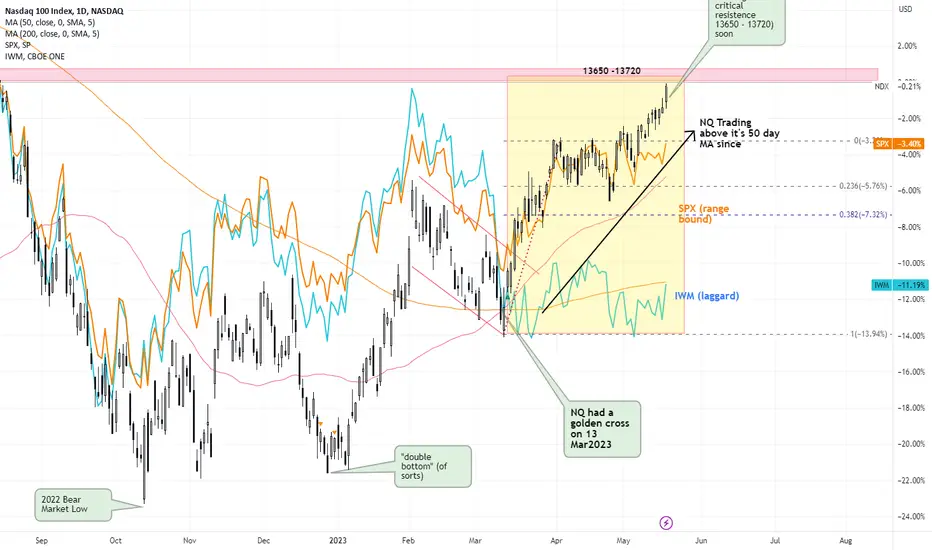
NQ - Bull intact but approaching near term resistence Despite a generally choppy market since February this year, Nasdaq had a Golden Cross on 13 March which turned out to be sustainable and some encouraging signs are also observed since:
1. NQ began to lead the other indices (namely SPX and IWM), a sign of a "risk off" sentiment as it means more money had been piling back into "riskier" tech & discretionary stocks
2. NQ had stayed above it's 50 day moving average (> 2 months now) with rather "shallow" retracements no more than 38% of each mini swing.
3. However, SPX was mostly stuck in a range for the past 1.5 months (despite being above it's 200 day MA), hence it can still make trading the wrong stocks rather frustrating.
4. IWM (Russell 2000, ie., small caps) has been the laggard, still unable to rise (much, if at all). This is normal during an "early" bull market.
Small caps usually begin to rise in a more sustainable manner when the bull market is well underway, and should they start to get extremely bullish, then it is usually a sign that a market top might be in the horizon.
Now that Nasdaq has been taking leadership (especially the FAANGS) for the past 2 months+, the sentiment remains sanguine.
Some caution now as it is approaching a critical resistence zone 13650 - 13720 (prior peak in Aug2022), and some pullback in the near term will not be too surprising
The depth of the next retracement going forward will give a clue if the uptrend is still intact.
Should NQ be able to clear this resistence zone (13720) eventually, then the overall market sentiment could get a good boost (including the small caps). Perhaps the resolution of the Debt Ceiling could be the catalyst?
But until then.
Just my take. Let's see :)
Disclaimer: Just my 2 cents and not a trade advice. Kindly do your own due diligence and trade according to your own risk tolerance and don't forget that money management is important! Take care and Good Luck!
AIAENG - Bullish Momentum with VolumesNSE: AIAENG is closing with a bullish momentum candle supported with volumes.
Today's volumes and candlestick formation indicates strong demand and stock should move to previous swing highs in the coming days.
The stock has been moving along the horizontal support for the past few days which is indicating demand.
One can look for a 8% to 12% gain on deployed capital in this swing trade.
The view is to be discarded in the event of the stock breaking previous swing low.
#NSEindia #Trading #StockMarketindia #Tradingview #SwingTrade
Disclaimer:
This is for educational purposes only.

ATOMUSD: Holding Support Above 0.786 RetraceAfter crashing below it and bottoming at the 0.886, ATOM has come back above the 0.786 and is Double Bottoming while Bullishly Diverging above a local trendline. If this action holds firm then I think it can see $22-$44.

will Google head higher?Has Googles pullback from 150 finished and will it move higher from 108?
Looks like it made a double bottom ish pattern from Sept 22 to Mar 23.
Some good volume buying to back up the breakout/reversal, and any good news e.g. AI, digital revenues etc. will help. Negartive news e.g. Regulation, privacy laws etc. will act as headwinds.
Price is now above the 50 EMA so this could act as support.

IDX:HMSP Death Bounce and Double BottomHanjaya Mandala Sampoerna (IDX:HMSP) had missed the bullish run and now are dumping with Double Bottom target is 875-825 and Death Bounce target is 1095-1065. After double bottom, HMSP will continue rally up to 1450. Keep in mind, double bottom usually will perform W-Harmonic Pattern. I shall update the chart later.

USDJPY I Long opportunity this weekWelcome back! Let me know your thoughts in the comments!
** USDJPY Analysis - Listen to video!
We recommend that you keep this pair on your watchlist and enter when the entry criteria of your strategy is met.
Please support this idea with a LIKE and COMMENT if you find it useful and Click "Follow" on our profile if you'd like these trade ideas delivered straight to your email in the future.
Thanks for your continued support!

CHZUSD: Holds Demand Line as it Attempts to Spring Above SupportChiliz after Retracing to the .886 PCZ of a Potential Bullish Deep Cypher has bounced back into a Previous Zone of Support and is now Holding on to a Potential Demand Line.
It also appears to be double bottoming on significant timeframes at these levels.
If CHZ can successfully hold the line here we could see it go up to target the Neckline of the Double Bottom at and if things go really insane we could see it make a full upside .886 Retrace.

$ATDS: Potential Bullish DragonWe have Bullish Divergence at the second low of a Potential Double Bottom within a Bullish Dragon pattern and if it plays out we could see it go up to as high as 89 cents.

AVAX BULLISH IDEA (DOUBLE BOTTOM)Potential Bullish Entry Dow Theory In Place -
Higher High and Higher Low Expected in Place
Formation of double bottom coupled with bullish divergence (Bullish reversal pattern)
Entry, SL & TP Levels are defined.

SOLANA BULLISH IDEA (DOUBLE BOTTOM)Potential Bullish Entry Dow Theory In Place -
Higher High and Higher Low Expected in Place
Formation of double bottom coupled with bullish divergence (Bullish reversal pattern)
Entry, SL & TP Levels are defined.

SPX: Many Powerful Patterns | Complete Trend Analysis.• The SPX did a Double Bottom chart pattern, just above the 4,048 support area, indicating that it is poised to seek higher levels from here;
• The trend is still bullish, and only if it performs a clear lower high/low we would see this changing – meaning, if the index is about to reverse, the confirmation will come if it loses the 4,048;
• For now, it appears it is seeking the next resistance at 4,195. There’s no bearish reversal structure or top signal indicating that it would frustrate this bullish momentum yet.
• In the weekly chart, it seems the index is inside an Ascending Triangle chart pattern. By breaking the 4,195 (the next technical resistance seen in the daily chart), the index will trigger a powerful bullish reversal pattern;
• The previous 2 candlestick patterns are Hammers, with long shadows under their bodies, which reinforces the bullish sentiment;
• Again, the index would have to lose the 4,048 in order to frustrate this sentiment. So far, it is still a bull trend.
I’ll keep you updated on this. Remember to follow me to keep in touch with my daily analysis.

FTNT - Breakout Rising Trend Channel- FTNT has broken the floor of the rising trend channel in the medium long term, which indicates a weaker initial rising rate.
- FTNT has met the objective at 66.36 after a break of the double bottom formation.
- FTNT has support at 62.70 and resistance at 69.40.
- Overall assessed as technically positive for the medium long term.
*EP: Enter Price, SL: Support, TP: Take Profit, CL: Cut Loss, TF: Time Frame, RST: Resistance, RTS: Resistance to be Support LT TP: Long Term Target Price
*Chart Pattern:
DT - Double Top | BEARISH | RED
DB - Double Bottom | BULLISH | GREEN
HNS - Head & Shoulder | BEARISH | RED
REC - Rectangle | BLUE
iHNS - inverse head & Shoulder | BULLISH | GREEN
Verify it first and believe later.
WavePoint ❤️

ASIANPAINT NEAR DOUBLE BOTTOM BREAKOUTThe price taken support near the upward trendline and formed double bottom structure on daily timeframe & now trading near the breakout level if price breakout the level of 2825 and sustain above it than we can see a sharp momentum in the price towards the upside level . The level of 2740 --2700 is an important support level for the price. The RSI also taken support @ 40 level , which showing good momentum in the price for the upside levels.The upper targets will be 2900/2950/3033 towards the upside. Good opportunity to buy stocks for investment point of view.

Dollar bulls on the rise? (DXY)The American Dollar Index (DXY) appears to be forming a double bottom pattern similar to the one it formed in March 2022. This pattern is considered a bullish chart pattern that indicates a potential trend reversal from a downtrend to an uptrend. A breakout from this pattern could trigger a significant rally in the dollar, possibly up to the 110 price level.
However, this bullish outlook for the dollar could have implications for other markets, particularly the crypto and stock markets. Historically, the dollar and these markets have had an inverse relationship, where a strong dollar usually leads to a weaker performance in the crypto and stock markets. Therefore, if the dollar rally materializes, it could lead to end-of-year lows for these markets.
Traders and investors should monitor the DXY closely for any breakout signals from the double bottom pattern and adjust their trading strategies accordingly.
