W9.1-32GBPJPY BULLISH IDEA (BULLISH FLAG & DOUBLE BOTTOM)POTENTIAL BULLISH ENTRY
Dow Theory In Place - higher highs and higher lows Expected in Place (Trend continues)
Formation of bullish flag coupled (continuation pattern) and double bottom coupled with bullish divergence
SL & TP Levels are defined.
Double Bottom

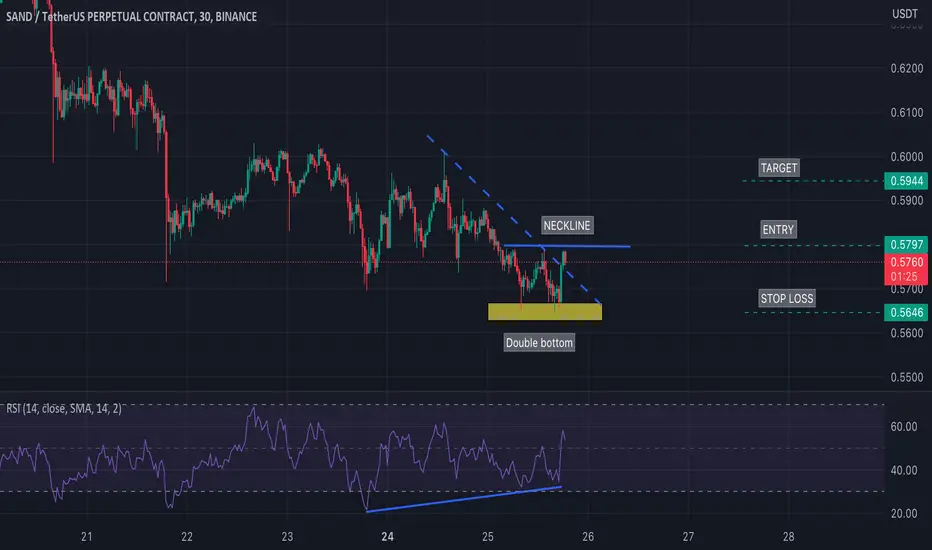
W9.1-29 SAND SHORT TERM BULLISH IDEAPotential Bullish Entry Dow Theory In Place - Higher High and Higher Low Expected in Place Formation of DOUBLE bottom coupled with bullish divergence (Bullish reversal pattern) SL & TP Levels are defined.
USDCHF - Bearish Double Top 📉Hey Traders !
The USDCHF Price Reached a 0.5 FIB Level !
Currently, The Price Formed a Double Top Pattern !
The Neckline is Broken 🔥
If Price Stays Under The Key Zone, USDCHF Can Continue The Bearish move !
-----
TARGET: 0.88650🎯
___________
if you agreed with this IDEA, please leave a LIKE, SUBSCRIBE or COMMENT!

W9.1-25 AVAX BULLISH IDEA (DOUBLE BOTTOM)Potential Bullish Entry
Dow Theory In Place - Higher High and Higher Low Expected in Place Formation of DOUBLE bottom coupled with bullish divergence (Bullish reversal pattern) SL & TP Levels are defined.

W9.1-21 ETHERUM SHORT TERM BULLSIH IDEAPotential Bullish Entry
Dow Theory In Place - Higher High and Higher Low Expected in Place Formation of DOUBLE bottom coupled with bullish divergence (Bullish reversal pattern) SL & TP Levels are defined.
If the price action does not follow the plan mentioned in the chart then, The support zone is 1786 and 1836; (watch out for your levels)

EURCHF - Bearish Double TOP 📉Hello Traders💖💖
The EURCHF Price Formed a Double Top Pattern !
The Neckline is Broken 🔥
so, I Expect a Bearish Move 📉
i'm waiting for a retest...
-----------
TARGET: 0.97430🎯
___________
if you agreed with this IDEA, please leave a LIKE, SUBSCRIBE or COMMENT!

W9.1-18 AUDUSD BULLISH IDEA (DOUBLE BOTTOM)Potential Bullish Entry
Dow Theory In Place - Higher High and Higher Low Expected in Place
Formation of DOUBLE bottom coupled with bullish divergence (Bullish reversal pattern)
SL & TP Levels are defined.

SINGER | Wave Projection | Major 4-Wave Triangle - MACD GoldenXThe price is currently trading just below 200SMMA as the key resistance under the assumption that its major 4-wave triangle breakout could be possible with double bottom pattern and MACD golden cross.
This bullish scenario has the downside is -8% and the upside is +10 - 20% with RRR: 1.5-2:1.

USDJPY | Perspective for the new week | follow-up detailsThough within a range, the US dollar was able to incite bullish traction last week as the 131.000 level remains a zone for buying power and a strength for the Dollar is likely following the Federal Reserve Governor Christopher Waller's comment on more monetary tightening despite evidence of a steady drop in inflation figures. Higher interest rates tend to benefit the dollar and this could incite a bullish trend in the coming week(s) which could lead to the break of the 133.800 barrier. From a technical standpoint, this video illustrates what we are going to be looking at in the coming week to either buy or sell the USDJPY.
Disclaimer:
Margin trading in the foreign exchange market (including commodity trading, CFDs, stocks etc.) has a high risk and is not suitable for all investors. The content of this speculation (including all data) is organized and published by me for the sole purpose of education and assistance in making independent investment decisions. All information herein is for your reference only and I take no responsibility.
You are hereby advised to carefully consider your investment experience, financial situation, investment objective, risk tolerance level, and consult your independent financial adviser as to the suitability of your situation prior to making any investment.
I do not guarantee its accuracy and is not liable for any loss or damage which may result directly or indirectly from such content or the receipt of any instruction or notification therewith.
Past performance is not necessarily indicative of future results.

DRN possible longDouble bottom
increasing Vol
Possible T/L break
Stop out under 8.75$
first P/T 12.50$
2nd P/T 14.50$
keep an eye on real estate news see if we get any relief in the market

BTCUSD: 4HR Double Bottom at PCZ of a Bullish Butterfly Bitcoin on the 4 Hour has printed a Double Bottom with Stopping Volume on the Second Bottom at the 1.414 PCZ of a Bullish Butterfly and at the 100 Period Simple Moving Average. In the next 2 minutes we will see the current 4 hour candle close and a new one will begin which is where it will show rather or not it wants to confirm the waning of Negative Momentum on the MACD and RSI and confirm Bullish Divergence.

CSPR working on a double bottom breakoutThe enckline of the double bottom, which is also the top trendline of this rising channel shown here. Is currently still resistance, however should it start to close a few consecutive weekly candles above this neckline/top trendline and then trigger the breakout the target would be around 9 cents. *not financial advice*

Double Bottom ReversalI love double bottoms and tops when they succeed, because they often give us more than the typical 1.5x measured targets after succeeding, 2x or even more.
Harvest Finance (FARM) may be about to print a double-bottom reversal. OBV has been trending up during the entire move down as well.
Targets with weekly resistances and support on the chart.

GBPNZD LONG 1H TF 1H TF: Double bottom on the 30 min tf & 1 hr tf. Let's see if price will break resistance to the upside and turn it to support. I'd expect a bullish run if that happens.
Indicators: RSI tested MA and might push to the upside.
MACD: EMA crossover to the upside.

Inverse head and Shoulders and Double bottom at a 786We've got some decent MACD divergence backing us up here looking to attempt to make a higher low than the right shoulder at a Fibonacci confluence area. I think we may attempt a secondary breakout above the resistance line.

DIVISLAB FORMED DOUBLE BOTTOM ON DTFThe Price trading near strong and crucial support level of 2730. Price formed Double Bottom chart pattern near the support level. If price holds this level that we can look for short term upside.
If price breaks down the support level of 2350 than more fall can be see in next coming trading sessions.

4.25$ SupportDollar once again hit 4.25$ level which was resistance from 2016 to february 2022 when price went above and this way created support which was tested in may/june 2022, january/february 2023 and right now. It seems solid so I would expect 5$ level retest in the near future and that way creating double bottom on current support. But if price will go below 4.25 and the volumen will be significant it can fall down. On 12th April US CPI level is going to be published and on 14th April PL CPI. Having up-to-date information, I do not plan to open a position earlier than next week.

CHFJPY - BROKEN RESISTANCE 🔥HELLO TRADERS !
The CHFJPY Price Reached a Daily Support Level and 0.618 Fibonacci Retracement Level and formed a Double Bottom Pattern!
Currently, The 144.206/143.609 Resistance Level is Broken 🔥
The Broken Resistance becomes new Support Level ✔
so, I Expect a Bullish Move 📈
i'm waiting for a retest...
-----------
TARGET: 146.550🎯
___________
if you agreed with this IDEA, please leave a LIKE, SUBSCRIBE or COMMENT!

FIL/USDT - POSSIBLE MOVE - SHORT!fil/usd looking bearish.
multi tf analysis.
short from 5.78$
target 5.3$ - 4.8$

USDJPY BUY ANALYSISON USDJPY I expect the market to shoot to the upside and give us a break&retest of the double bottom

DOGEUSDT | Wave Projection | ABC Pattern TP +60%Wave projection combined with price action and chart pattern trading signal
> After a sideway breakout of mega falling wedge - the price pattern breakout of MA200 and made 2 false breakdown with a doubled bottom formation.
> A potential ABC uptrend pattern now retesting MA200 confluent zone support at key volume profile POC and golden cross MA20x50.
> If breakout successfully - TP1 @ 0.618 retracement +60% , TP2 @ 1.0 of Wave A +100%+
> Pullback Entry S1: MA200 - 0.80, S2: 0.74, S3: 0.68

Gold is currently testing the neckline of a doublebottom patternOn the 4hr-1day charts we can see gold has broken up from a bull pennant. It is now finding resistance exactly at the top trendline of the yellow channel. This trendline also qualifies as a double bottom neckline. Based on the measured move target of the green bull pennant…price action should break well above the double bottom neckline which makes probability high that the double bottom bullish breakout will also be validated. Here on this current chart I have included both the measured move target for the pennant (green dotted line) as well as a rough estimate for the measured move target of the double bottom pattern (dotted yellow trendline) *not financial advice*

Ravencoin: Looking For A HeartbeatRavencoin has Bounced once from this Logscaled Gartley and failed to Breakout of the Channel and now maybe looking to come back down to the PCZ and hopefully hold on to a Double Bottom. However, before RVN can even come back down to the PCZ it must first breakthrough the Heartline of the Parallel Channel on which it currenly so happens to be resting. Due to a smaller Bullish Shark Visible on the 1 hour at it's current price level there is an elevated chance that RVN may not come all the way back down to the Gartley PCZ and instead confirm opt a Higher Low here at the Heartline to make a rush for the AB=CD targets of $0.21-$0.42
Here is a screenshot of the 1 Hour Shark For Reference:
