NZDCHF 2H, Long Opportunity with Bullish Price ActionPrice action has been shaping up for another push upwards as we see price was moving correctively In a falling wedge structure which we know is a reversal structure in nature.
Price made a double double which impulsively broke upward forming a continuation correction which we should see further growth on NZD.
Find a entry that meets your trading plan.
Thanks
Trade Safe
Double Bottom

AUDCHF : POTENTIAL REVERSALGiven the corrective downtrend of price, there is a possibility of a rejection by forming a double bottom provided the descending channel is clearly formed and rejects at the third touch too.

Dogechain: Bullish Divergence at the PCZ of a Bullish BatDogechain looks to be going for another big move up as it's formed a nice looking Bullish Bat on a Significant Timeframe and it might be a Double Bottoming at the Highs. I think it will come up to the highs of the range and potentially even a 1.618 Fibonacci Extension.

AAVEUSDT, Wait for pullback NecklineHello guys.
Analysis in TF 1W.
Double bottom in TF 1W.
Breakout Neckline and wait for pullback Neckline

WAVE | Parallel Channel | Doubled Bottom Breakout Trade SetupPrice Action & Chart Pattern Medium Term Trading
> Parallel Channel Trade Setup
> Doubled Bottom | Entry @ Breakout
Indicator:
> Smart Money & Banker Chip Volume Support Timeframe 4H
> BBD bullish signal crossed above baseline
> Fundflow uptrend reversal pattern
> KDJ ribbon changing to uptrend
Trade with affordable risk ratio 2.5:1 for medium term trade
Always respect your stoploss

USDCAD - Double BOTTOM 📈the USDCAD is in double BOTTOM Pattern
the Neckline is broken
so, i predict a bullish move 📈
i'm waiting for a retest...
TARGET: 1.36430🎯
...
if you agreed with this IDEA, please leave a LIKE, SUBSCRIBE or COMMENT!

XAUUSD (GOLD DOUBLE BOTTOM) BUY SETUP OANDA:XAUUSD
HI TRADER'S .. AS YOU CAN SEE GOLD IS MAKING DOUBLE BOTTOM .
GOLD is trading in falling wedge , and RSI also over sold area
Might be possible buyer's push market up from here
Target level 1830
❤️Please, support my work with follow ,share and like, thank you!❤️

XAU/USD (GOLD) RECTANGLE TRADINGOANDA:XAUUSD
HI , TRADER'S .. AS you can see Market is in bearish trend since last 3 week's
AS RSI now reaching OVERSOLD region
BUYER'S CAN PUSH MARKET UP FROM HERE
Price is on major support of 1819
look for double bottom and take entry

AUD/USD DOUBLE BOTTOMAUD/USD Has flashed a double bottom. I prefer to trade to the neckline and not the actual target. Remember all double tops and bottoms are nothing but price revisiting supply and demand zones.

ASIA: EURJPY BREAKOUT - MOMENTUMEJ bias in higher timeframes is still bullish and here we get a nice consolidation leading to a breakout candle at the start of our shift. Price is aggressively drawing down but unfortunately the trade is already set. The process is being followed correctly and this position meets playbook criteria so the trade must play out. Going for 2R on this one

EURCAD - Break of Structure 📉The EURCAD price touched the Daily Resistance Level 🧐
The Key Level is broken 🔥
so, i predict a bearish move 📉i'm Waiting for a retest 🧐
TARGET 1: 1.43191
TARGET 2: 1.42793
...
if you agreed with this IDEA, please leave a LIKE, FOLLOW or COMMENT!

$FTM - forming a BULL FLAGHello my Fellow TraderZ,
$FTM - after forming a DOUBLE BOTTOM, price has significantly moved to ~50%.
Now price is coming to test the broken NECKLINE of W. Also a bull flag is forming at the moment, if it plays out I'm anticipating 22% profit in LONGing.
CHEERS!!!

Intrigued by BCH HereFinding myself intrigued by Bitcoin Cash.
We recently hit bottom a 2nd time and have thus far begun moving up, breaking out of a small falling wedge (on the non-log daily chart, the logarithmic weekly chart is what is pictured above, but it still has the wedge and targets from the daily non-log chart).
Why am I intrigued, outside of a potential double bottom? Bitcoin Cash was a fork of the original Bitcoin code, meaning original adopters and/or owners of Bitcoin at the time received an equivalent amount of Bitcoin Cash. Many of them were made wealthy from Bitcoin. It would seem to me, if I were in their position - I would have a vested interest in seeing Bitcoin Cash make a comeback, if even just briefly enough to make some returns on an essentially free investment.
On the chart - interim daily falling wedge targets, boith still under $200.
For weekly / long-term - get through and hold above the first red resistance area to make it to the next one above it - that happens, the double-bottom comes into play.

EOSIO: Double Bottom Breaking Out of Descending Broadening WedgeWe have a Confirmed Partial-Decline of the Descending Broadening Wedge; The Bullish Target would take us to $6.30 but we have room to push to around $10.50

GBPJPY Confirmed Double Bottom +400 PipsAfter identifying a potential triple bottom pattern on GBPJPY, I took a long position following a successful retest of the key support level at 157.00. This trade has entered into profit, with the current price at 161.500. Moving forward, I am watching for a breakout above the neckline, which would signal a new opportunity to enter another long position with a target price of 168.00.
Despite negative news for GBP last week in retail sales and interest rate announcements, I believe the post-pandemic deflation process could support a rise in GBP, particularly against currencies like JPY that are facing economic uncertainties. By carefully monitoring price movements and staying attuned to global economic trends, I remain optimistic about the prospects for our trade and the future of GBP.
What is your thoughts?

$SHIB - Double Bottom is in makingHello my Fellow TraderZ,
$SHIB is forming Double Bottom on the 4 HTF and once it cleras the R of 1350, may shoot for 10-15% gains.
CHEERS!!!

EURJPY can break above? 🦐The double bottom pattern that formed on the EURJPY Daily chart after the recent low suggests that there was a period of selling pressure that eventually led to a reversal. The impulse to the upside that followed and tested the daily resistance level multiple times shows that buyers are in control and are attempting to break through this level.
Currently, the market is in an accumulation phase between the resistance and the 50% Fibonacci level. This suggests that buyers and sellers are assessing their positions and waiting for a clear direction before committing to a trend.
As a trader, you could look for a break above the daily resistance level as a potential long entry signalaccording to the MTB Strategy Rules. This could indicate that buyers have gained enough momentum to push through the resistance and continue the uptrend.

2020: SABIC-Agri (Wait for Double Bottom)Double Bottom Formation
About to touch important Support Zone
Entry 121.2 (on Green Candle Closing)
SL 120.8
TP1 136.8
TP2 141.6
TP3 146.6
Ride the trend with Trailing SL

Shiba Inu will double in price, right now!
Shiba Inu is absolutely ready for a massive breakout! I recommend to buy Shiba Inu right now because the technical analysis gives us a strong buy signal!
As you can see, the price is breaking out of the descending channel with a successful retest. After the retest, I don't see any reason why Shiba should go down at this point.
There are absolutely no unfilled GAPS below the current price, so it is extremely positive for the bulls. There is no reason to short SHIBA for the bears; they would prefer other coins.
From the Elliott Wave perspective, inside the descending channel we can spot a zigzag, which is a corrective pattern. Usually, you want to buy a breakout of corrective patterns for an explosive move!
There is no doubt that Shiba Inu knows how to pump drastically, and what can happen to you is that you wake up in the morning and you will see a huge green dildo, so I think you want to fill your bags before it happens!
Also, we have a double bottom pattern on the macro scale between the previous swings from June 2022 and December 2022. Another great sign of a trend reversal.
The most important question at this point is where to take profit. You don't want to take profit earlier than at the POC of the previous symmetrical triangle from 2021–2022.
Be greedy and make sure you double your investment! Also you can long on futures with a reasonable stop loss!
This analysis is not a trade setup; there is no stop-loss, entry point, profit target, expected duration of the trade, risk-to-reward ratio, or timing. I post trade setups privately.
Thank you, and for more ideas, hit "Like" and "Follow"!

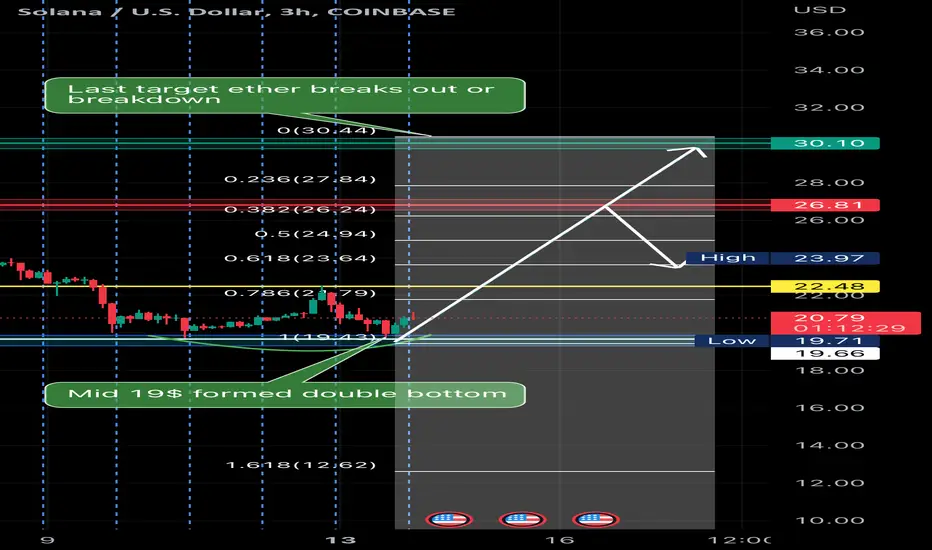
Time for correction buyers double bottom formedTime for correction and this is the confirmation.
True for that drop from 22$ down back to mid 19$ of course a short retrace and then now going to finish up the correction.
If you bought the dip around $19.60 good hold it; if you haven’t buy it now before the pump occurs. this is what happens you see a double bottom confirmation in a same zone.
Tell you why solana will hit 30-45$.. 26$ confirmed the breakout and then started to drop to do a retrace fib and now 22$ confirmation for breakout so now double bottom has been witness that means the bulls will go up even more.
First target to hit is 22$ first and finish off the breakout; once that done then be on the way to 27-30$
If you think it’s a sell then please change mind because you can not miss with double bottom from the bulls.
Trade safe good luck and watch any reversals even if too short or short; even if going long.
Comments any I miss or your opinions because what I see is a solid buy , double bottom , bullish breakout confirmation. From 19$ we will see up to 30$ this month perhaps higher.
BTC dump is coming? Hi dear community, I hope you are fine.
I will be short. I will update my ideas about current situation on BTC chart.
I'm looking at 2W BTC log chart by Heikin Ashi candles. I'm comparing 2022 bear market with 2015 coz they are very identical by many factors which I told in my previous analyses.
So as you see after making double bottom with strong bullish div BTC pumped from 15.5K to 24.3K as I had mentioned in my previous analyses. There is huge resistance at 24.5-25K zone/200weekly EMA, range high, diagonal and horizontal resistances, monthly diagonal bearish trendline test etc. Approaching to key resistance bullish candles became smaller/check 3D or W chart/, buying volume was diminishing, the momentum was losing creating multi bear divergences on multi timeframes, as a result of the mentioned the price rejected at 24.3K & dropped to 21.6K filling created imbalance, and FVG zones bellow 22.3K. As you see after bottom, BTC created 3-4 big green Heikin Ashi candles marked in pink box and dumped to the main market structure making HL, at the moment you can notice the same green candles in a pink zone with RSI identical move as it did in 2015)). To be honest , we need this healthy correction putting HL in current structure.
There is weekly FVG zone at 17.2-20.4K zone as well. In coming days and weeks, I expect BTC to dump to the mentioned zone and fill at least 50% of FVG which is 18.7K. More likely 18.5-19K zone will hold not only as a FVG zone but also strong horizontal support and we'll see strong reaction and bounce from that region which will lead the price to new highs)).
If you like my ideas don't forget to like and follow me for further updates. I will appreciate any kind of support.
Also check my other analyses.

Double Top at LTCUSDT. It is going downOn the medium-term timeframes LTCUSDT, another figure is identified by my publicly available scripts.
This time it's a double top. Therefore, with sufficient probability, we can expect that the next significant movement will be - DOWN.
All figures on this chart are built automatically by my scripts available for free to every tradingview user on my page: www.tradingview.com

EURCAD - Double TOP 📉
The EURCAD price is in weekly Resistance Level 🧐
The Neckline of the double Top pattern is broken 🔥
so, i predict a bearish move 📉i'm waiting for confirmation🧐
TARGET: 1.42806🎯
...
if you agreed with this IDEA, please leave a LIKE, FOLLOW or COMMENT!
