Gold daily time frameThe chart is self-explanatory, we will go up for the next few days at least, maybe a few weeks?
Double Bottom

GBPAUD > The Best Possible Levels for A Good Buy Entry!! Analysis of #GBPAUD
Hi traders, today we will have a look at #GBPAUD
as you can see we have the market dropping down to test the lows near 1.7500, currently the market is at the resistance zone, if you look at the left side of the chart you can see there are multiple levels of resistance in this area
so I expect the market to test the lowes, we have 2 levels that interest me, the 4-hour structure support level and the daily structured support level as laid out on my chart
if the market drops and test this zone I will then drop the lower time frame looking for a double bottom, or bearish candle formation, better if I get a harmonic pattern I can then enter with a limit order, lets what the market will give
I hope you guys found this helpful, if you are new here click on follow, to get these ideas delivered straight to your email inbox, I will see you guys at the next one
Thanks for your continued support!

Filecoin Short-term TargetsQuick post - Filecoin broke out of a falling wedge on the daily and is headed towards the 200 day EMA and wedge breakout TP 1 if it can get and hold above the EMA.
Conditioned upon reaching the falling wedge breakout's TP 2 @ ~$10.70, which would take it above previous high of ~$9.75, that opens up the possibility for new targets for a double-bottom recovery.
Get and hold above 9.75 and we have a confirmed double-bottom targeting $14.58 and then approx $17.
Short-term chart here, but I've previously posted a much larger falling wedge breakout that happened quite some time ago but has been consolidating ever since. That possibility still exists should everything above occur and DXY doesn't turn back up shortening recoveries across markets. If conditions remain favorable, we could see a double-top on the HTF chart. See link to related idea below:
This fell further than expected and has consolidated further than expected, but is still possible given the considerations mentioned above:

GBPUSD double bottomGU has been ranging all day, finally painted a double bottom at support. Im in from 1.23648, but at the end of current stick, will be confirmed retest for breakout

FARM Wedge and W Pattern TargetsA ton of different alts making the same patterns.
Smaller wedge breakout is headed towards the 200 day EMA (also halfway point towards TP 1) and then TP 1 and then 2.
Smaller wedge reaches all its targets and remains above middle of W pattern, W pattern / double-bottom recovery begins and heads towards its TP 1 and 2 (with its halfway point to TP 1 equal to smaller wedge TP 2)
Longer-term wedge success likely hinged upon all of the above succeeding, while DXY must not turn up quickly and strongly from where it is now (needs to continue moving down below 100, or hang out b/w 101-103 for a good while prior to moving up). Also be wary of Bitcoin Dominance, which looks bullish atm. If conditions are met, long-term target looks to be a slightly lower high double-top, for now.
See related ideas in the links below, again many alts are making nearly identical recoveries along w/ Bitcoin.

Will BTC repeat this identical pattern as it did in 2015? Hi dear community and my loyal followers.
Let me bring your attention to this important historical data.
As you know I told many times that 2021-2022 bear market look like more likely to 2015 than 2019 taking into account many factors)).
That's why in this analysis I'm comparing 2021-2022 bear cycle with 2015.
Look at price action bellow 5D gaussian channel, do you see the identical move of the price from 1-7 steps?
In 2015 when price approached to mid point of Gaussian channel and range high(#6) it dumped making 2d bottom(#7) , So I expect the same move to be happen now. Price is approaching to mid point of Gaussian channel(#6) and more likely will retrace to 19K+- making double or even triple bottom counting 17.5, 15.5 and potential 19K+- lows. (#7). BTW when price reaches 24.5-25K it will be weekly 50 and 200 EMA also multi-months diagonal resistance. /I will post it a little bit later on regular chart.
I also expect such kind of move coz a lot of moon-boys turned bullish and opened long positions at 22.5K and expect 28K+ prices. ))
If you like my ideas and analyses, don't forget to like, follow and leave a comment please. I appreciate any single tweet.

ENGINERSIN possible double bottom breakCMP 87.90 | High volume gain | New 52 week high
Engineers India possible double bottom breakout
FII / FPI or Institutions increasing their shareholding
Strong Momentum: Price above short, medium and long term moving averages
*Not recommendation, do your due diligence
Idea :)

SARTHAK METALS - Double bottom breakoutSMLT CMP - 172.65 | New 52 week high | High volume gain | Positive technical indicators
- FII / FPI or Institutions increasing their shareholding
- Stock gained more than 20% in one month
- Strong Momentum: Price above short, medium and long term moving averages
*Not recommendations
Idea :)

XRP just fractions of a cent away from hitting the dbl bttm trgtthe green horizontal was the double bottom neckline. the dotted green target is the measured move target from the point of breakout above the green neckline to the measured move target….as we can see mere fractions of a cent from reach 100% of the target! Should hit on this follow up candle. I would also not be surprised to see this follow up candle retest this purple line. If we can retest this purple line as solidified support for enough candle closes then we can then look forward to the next higher measured move target that ends at the room at the dotted ascending purple line. Wen price is this close(less than a pip) it’s close enough for me to proclaim target hit! This should help us confirm the break up from the monthly symmetrical triangle pattern before too long *not financial advice*

DOW Headed up to 37 -> 40kQuick post - Daily 50/200 EMA shows a golden cross, W pattern / double-bottom breakout re-tests have succeeded in staying above the upper trend-line.
It also continues bouncing off the 50 EMA.
We may find some resistance in the area of the red box. TP 1 is ~37.8k, TP is ~40.2k, expecting a pit stop around 35k in the resistance area as it makes its way towards suggested targets.
DXY finds new troughs in correlation with DJI finding new peaks. Our recent lows on DJI correspond to DXY's recent peak. DXY has fallen back to the area where it broke out, suggesting a recovery. Should it remain below 102-103, that recovery could be extended. If it gets and stays well above 103 again, this recovery will be short lived.
If DXY turns up above 103 and becomes bullish again, we could see a double-top instead of reaching targets above previous ATH.

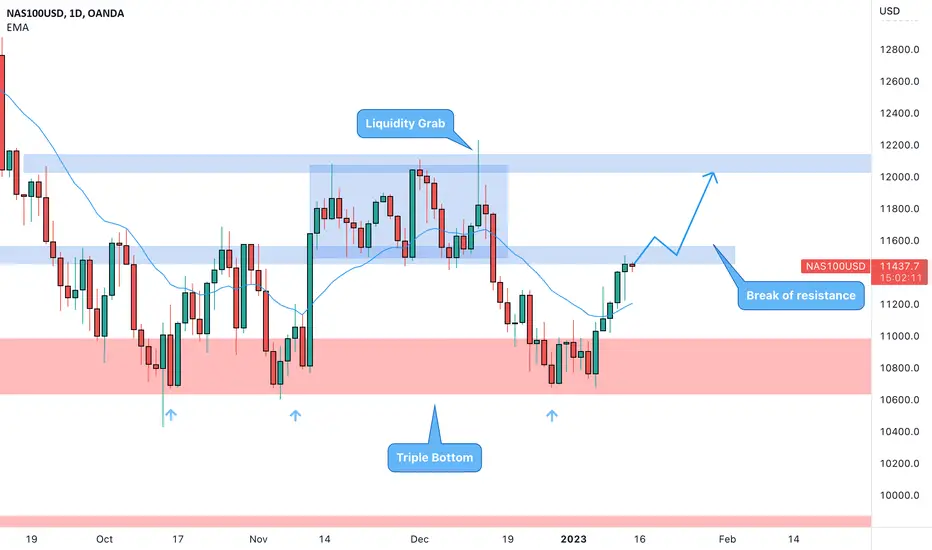
NASDAQ can move higher? 🦐NAS100USD on the daily chart has created a triple bottom.
The market tested a few times the weekly support at the 10700 level and we notice how after the first 2 tests the market went up for a distribution phase.
It is interesting to see the liquidity grab before the next bearish leg to the support where, also thanks to the recent news we had a new inversion at the support level.
How can i approach this scenario?
Being Friday it will be risky to open a position but IF the price will break above the resistance area we can set a nice long order according to the Plancton's strategy rules.
–––––
Follow the Shrimp 🦐
Keep in mind.
🟣 Purple structure -> Monthly structure.
🔴 Red structure -> Weekly structure.
🔵 Blue structure -> Daily structure.
🟡 Yellow structure -> 4h structure.
⚫️ Black structure -> <4h structure.
Here is the Plancton0618 technical analysis , please comment below if you have any question.
The ENTRY in the market will be taken only if the condition of the Plancton0618 strategy will trigger.
XRPUSDT DOUBLE TOPHere we can see that "XRPUSDT" IN 30 min time frame forming a double top paTTERN. YOU CAN SHORT AT THE CURRENT PRICE WITH A TARGET AT THE ZONE OF "0.3741". Also you can see that STOCASTIC RSI is trying to reach to the oversoldzone from the overbroughtzone so the price may fall.
ENJOY!!!!!!!!!!

NZD v/s USD - A Kiwi WinBulls seem in control of this pair as it rallies to its further highs after forming a double bottom followed by higher lows

GBPAUD - Potential Double BottomAs we can see GBPAUD seems to be in a sideways channel. The pair broke out of the trend line on the H4 chart and also created a double bottom indicating price may want to go higher. This idea can see resistance around the 1.78000 area.
If you would like to see updates on this idea and many more please follow and hit the like button for more!

GBPAUD - Short - H4 & DGBPAUD - Short - H4 & D
You know we cant let this pattern slide without us getting on the ride.
Hoping it will pull up the socks back to the 50 EMA.

Double top pattern in motion Double top formed we wait for a break in market structure (BMS) A retest and then we sell

KSM | BITCOIN | DECRYPTERS | DOT FAMILYHI people welcome to team Decrypters
Daily to Weekly Double bottom Retest and continuation

BTC flashed Historical and powerful signal !! Short macro update
Dear community, I'm looking at 2w timeframe chart of BTC. Good new for bulls )) BTC flashed Historical and powerful signal)) 😉😉
2W MACD bullish cross bellow 0 line has never given false signals and happened 3 times in its whole history)) After that multi-months rally started.
BTW in every bear market BTC started its bull run when 2w MACD bullish cross happened and at the same time BTC succeeded breaking multi-months diagonal and horizontal resistance drown on the chart making completing double bottom pattern with multi bull divs.
Don't forget to like, comment and follow me. I appreciate any single follow.

Wheat Futures Are Simple (Bullish)Technical Double Bottom
Wait for breakout with Jupu green tag and then pullback to fibs/green shade on Jupu

MicroStrategy time to get in for a swing$MSTR is approaching a double bottom and printing a doji candle on the daily time frame. A visit to the trendline is very likely.
NOT A FINANCIAL ADVISE

Technology Simple Chart AnalysisTechnology - Rst 67.4 Supp 63 area
Same goes to our klse tech chart. If nas100 were to rise & shine, entire market technology sector will follow. Very soon we able to see 67.4 break to go next level.
My 2023 Pick For KLSE Tech Counter as below
Frontkn
Greatec
Penta
KGB
QES

COIN LONG after a reversalCOIN's long downtrend reversed after signs of the end of the crypto winter
and SBF brought to justice to clean up the crypto industry.
Moving averages show the inflection and new uptrend.
On the volume profile, the price rose over the POC line showing
that buying pressure exceeds selling pressure.
The chart pattern shows a double bottom late December
and this past Monday clearly establishing a key support level.
This looks to be a good swing long with a target being the
0.5 fib level of the retracement from the downtrend.
Call option contracts are a good alternative to a sizeable
trade of stock.

Gold will go up, as analysed yesterdayGold has finally broken out of the flag pattern that it was stuck in, gave us a double bottom between Asian session and this morning, price pushed up, gave a retest, if the current 1hr stick ends bullish, we should see more buys, as this is the indication of a confirmation breakout.
