Pattern TradingTrading based on double top, bullish flag pattern on daily time frame. Can you guess the target and stop loss on upcoming trend ?
Double Top

GBPUSD: Waiting for Confirmation of Bearish TrendThe GBPUSD pair has formed a double top pattern, with divergence on momentum indicators, and is now completing a head and shoulders pattern. To confirm the start of a bearish trend, I will wait for the price to break below the neckline at 1.2350. However, I will likely wait for the price to bounce off support levels and re-enter slightly above the neckline (around 1.237), when it has captured some liquidity from traders anticipating a rapid decline, before entering a short position. This will enable me to capture more liquidity at a better price and minimize losses.
When trading, it is important to remember that the majority of traders (90%) lose money. Therefore, one should only sell at the highest possible price and buy at the lowest possible price, even if it means missing out on some opportunities. It is also crucial to avoid placing stop-loss orders in easily accessible locations, as prices often return to areas of liquidity. Finally, instead of chasing prices, one should wait for them to come to their desired conditions.
-------------------------------------------------------------------------
Let me know your thoughts in the comments, and show your support by liking the idea.
Please follow if you're interested in more ideas like this.
Your support is greatly appreciated!

Aggressive Trader could considerIf you are an Aggressive Trader, you may consider shorting the AUDCAD on the 1-hour chart at a market price of 0.9044.
Conservative trader might want to wait for a 3-bar reversal or a retest at 0.9055 on the 4-hourly chart based of the retest of previous resistance and of a sideway bounce trading setup.

EURGBP - New Selling Opportunity!
Hello Traders !
On The Daily Time Frame The EURGBP Price Reached a Resistance Level ✔
The EURGBP Price Was Trading in a Bullish Structure but The Price Came Under Renewed Selling Pressure 📉
He Failed to Create New Higher High 📈
Currently, The Support Line is Broken🔥
So, I Expect a Bearish Move📉
----------------
TARGET 1: 0.87920🎯
TARGET 2: 0.87540🎯
___________
if you agreed with this IDEA, please leave a LIKE, SUBSCRIBE or COMMENT!

EURNZD SHORT 4H TF1H TF: Bearish crossover in the RSI and MACD EMA.
4H TF: Price is currently testing resistance, I expect price to reject it having tested it previously and unable to break it.
Daily & Weekly: Price is at the top of a price channel and is testing the upper trend line. I expect a short term pullback.
Monthly: Price is bullish and I expect price to keep going up.

Double Top Its a little messy because of all the movement but I still believe this is a double top. TSM is unable to break the HKEX:99 zone and my theory is that it will test its old support at the HKEX:82 range.

QQQ hourly Double Top forming, target would fill gapsLooks like a likely double top forming in QQQ. I think it's likely to play out as the double top target move down would also fill a couple gaps in the hourly chart.

BTC 15m Head and Shoulders and 1H Double Top on the Trend WavesWe can use candle patterns on the oscillators too. On 1h my waves oscillator, we have a double top, ideally rejected from the 70 lines, and it broke down the neckline.
A pullback in strength could go below a zero line. In that case, aggression (grey wave) would be rejected in the area of -50 to -70.
The head and shoulders pattern formed on a 15m timeframe, and it retests the neckline at the moment of writing this, with a possible drop to 30300 right through the hole on VPVR on the right.
Again, the fact that I remain bearish should not change the fact that trading against the trend is a big NO-NO.

GBPJPY DOUBLE TOP REVESALTRADE PLAN OF DOUBLE TOP FORMATION
Entry/Sell Stop: 165.473
Stop loss: 166.582
TP:164.385
Risk Reward 1:1

GBPUSD Idea! Short!Hey there traders! This is my analysis on GBPUSD.
Waiting for price to break and close below zone 1.24000 and then look for a retest of the zone and look for a confirmation for a move downward to zone 1.22900 for 110 pips!
Don’t forget to like and follow for more!

EURUSD Idea! Short Short!Hey there traders! This is my analysis on EURUSD.
Price closed under zone 1.09150. Now looking for a retest to create the possible double top and then look for confirmation for a move downward to the next zone 1.08300 for 85 pips!
Don’t forget to like and follow for more!

GBPJPY Idea! Short Short Short!
Hey there traders! This is my analysis on GBPJPY.
Price closed under zone 164.100. Now looking for a retest (double top) and see we can see some nice rejection and then a move downward to next zone 163.200 for 100 pips!
Don’t forget to like and follow for more!

8210 Bupa Arabia For Coopreative Insurance CO. Bearish LookBearish signs break Double Top + can't break and hold upper trend line.
Target:
TP1: 200MA
TP2: 137-135 area
TP3: yellow trend line

NZDJPY - NEW BREAKOUT !
Hello Traders 💖
On The Daily Time Frame The NZDJPY Price Reached a Resistance Level!
Currently, The Price formed a Double TOP Pattern 📉
The Neckline is Broken, The Support Line is Broken 🔥
So, I Expect a Bearish Move 📉
i'm Waiting for a Retest...
-----------
TARGET: 81.655🎯
________
if you agreed with this IDEA, please leave a LIKE, FOLLOW or COMMENT!

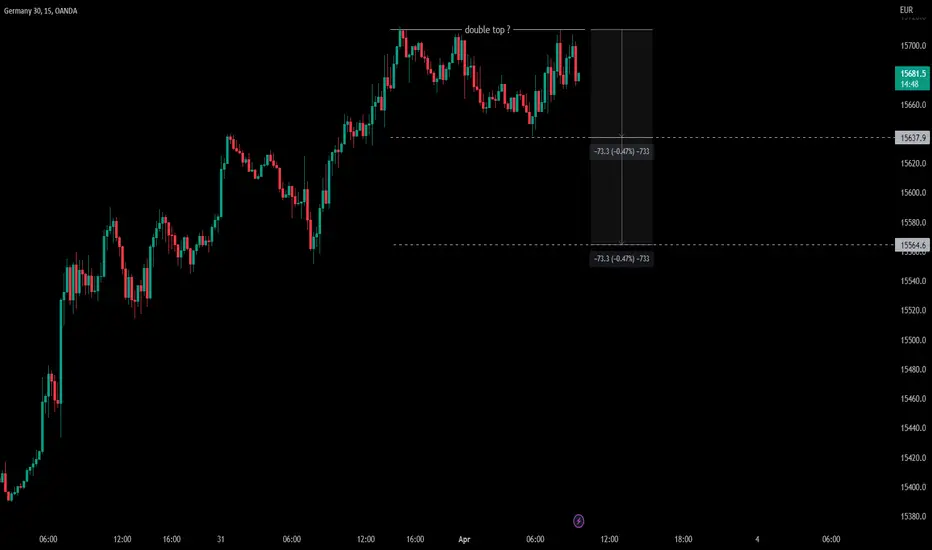
DAX 30: Double Top Pattern in short term?From a technical point of view, the $DAX30 index could form a Doublet Top Pattern on 15' chart.
Trade with care! 👍 ...and if you think that my analysis is useful, please..."Like, Share and Comment" ...thank you! 💖
Cheers!
N.B.: Updates will follow below
Eurusd double topEurusd forming a double top that is reversal pattern we may see downward trend in a small time frame (bearish).
.
.
.
.
.
DYOR!!!!

#NZDUSDIt is placed in the golden range of the second wave, if a shorter roof can be made, it will enter the short position after confirmation.

EUR-USD Bearish Breakout! Sell!
Hello,Traders!
EUR-USD presents the
Reverse picture of the DXY
With the double top and
A bearish breakout so
I think the pair will fall
Sell!
Like, comment and subscribe to help us grow!
Check out other forecasts below too!

NVIDIA | NVDA | STOCK | DECRYPTERS Hi people Welcome to Team Decrypters
Decent Short opportunity on NVIDA STOCK
--Head & Shoulder Pattern Break out and Target completed .
--Price is Supported by All Major EMAS.
--A down ward channel Break Down And GAP filled.
--After a Strong upward movement Price should reject from Multi year Trend line.
--A Potential Retracement Short should ATLEAST play From Resistance levels.
-Price is overall Supported by All MAJOR EMAS.
--Potential Double Top formation.
Note :- Nasdaq Should Retrace so will the stock , A Setup Should be traded with Confirmation Only

EURUSD TESTS THE BIG RESISTANCE twice in a rowEURUSD TESTS THE BIG RESISTANCE twice in a row and create double top pattern

Are bears going to take control today ? > Bearish Divergence
> Double Top
> Resistance Zone
There is a good selling opportunity today

EURCHF ShortOANDA:EURCHF
Waiting for the candle to close on the 4H EURCHF for a possible Double top from the resistance zone 0.998 and good short opportunity.
If you like my idea please hit the thumbs up :)
P.s First idea I have published.

NVDA: Bullish, But Be Aware of These Patterns.• NVDA is about to retest the previous top at $275.89, after a quick correction to the $258.50;
• NVDA is in a very strong bull trend, and the last correction couldn’t even hit the 21 ema in the daily chart;
• By breaking the resistance at $275.89, NVDA would trigger another bullish pivot point, reinforcing the bullish bias. Its next target is the $289.46, which is better seen in the weekly chart;
• However, it is important for NVDA to break the $275.89 as soon as possible, as if it does a top sign in this area, the market may see a Double Top – we discussed this possibility last week, in our last analysis (the link is below this post, as usual). If it loses the $258.50 (previous bottom), then it’ll give another confirmation sign of a bearish reversal.
• In the weekly chart, we see that NVDA reversed the bear market by doing an upwards breakout from its Descending Channel, and it triggered an IH&S chart pattern;
• The $289.46 is a previous top from March 2022, and it is a technical resistance for us now. It appears NVDA wants to hit this target. So far, there’s no top sign nor bearish reversal structures;
• In theory, a pullback before it hits its target would be normal, as pullbacks after the breakout of the neckline of an IH&S occur 65% of the time (Bulkowski, Encyclopedia of Chart Patterns);
• If NVDA triggers a sharp correction in the weekly chart, I see it retesting its 21 ema next;
• I’ll keep you updated on this, as usual.
Remember to follow me to keep in touch with my daily analysis!
