CADJPY, Classic Double Top SetupLooking for a sell opportunity around the 99.30 range. Price is correctively moving towards an area of interest which could see react to a double top.
Look for an entry that fits your trading plan.
Thanks
Trade Safe
Double Top

Double Top with Perfect Entry 🤑Just check how perfect the trade it was!
Proper Breakdown & then perfect Entry on retest , Technical Analysis is must to become successful Trader.

EURUSD Idea 1/4/2023Trading is all about patience. If you’re not patience, the probability of failing is very high. Here is my thoughts of EURUSD
Simply break and retest. Looking for short positions to next area of interest. (1.04500 )
Look at smaller time frames for patterns such as double tops and double bottoms for more confirmation.
Remember to trade responsible. This is not a signal at all, just my thoughts.

2023 New Year Short Opportunity - $WMTGoing into the new year, I am watching NYSE:WMT for a short/take profit opportunity.
Walmart tested and closed below the all-time high of 2020 ($153.66) for the year, showing signs of falling in 2023!

AUDNZD, Sell opportunity Price failed to break highs, Looking for a short term sell opportunity to 1.0610
Thanks
Trade Safe

GBPUSD, Bearish start to the New Year.Price is currently in a bearish continuation from a reversal impulse as price failed to continue higher. More downside is expected.
Thanks
Trade Safe

Double or flat top...Interesting things are printed here. Just broke out from the bull flag. It could be double-top finishing or flat-top starting. On higher TF we have space for further movement up also, but the lower timeframe oscillator looks ready for some cooling-off action. Either way, YFDAI is an interesting one to watch.
Set alerts on important levels (on the chart) if you would like to follow this one.
Good luck traders

EURNZD Idea 12/29/2022 Trading is all about patience. If you’re not patience, the probability of failing is very high. Here is my thoughts of EURNZD
I am currently 150 pips in profit. I am now looking for an additional entry. Lets see price go back up to 1.68250 and look for exhaustion, double tops, bearish engulfing on the smaller time frames for confirmation to go downwards some more.
Look at smaller time frames for patterns such as double tops and double bottoms for more confirmation.
Remember to trade responsible. This is not a signal at all, just my thoughts.

EURGBP, Double Top Rejection. Short it.HTF Bearish
LTF Bearish
Double Top
Ascending channel, strong impulse breakout.
Looking for more downside after LTF correction.
Trade Safe
Thanks

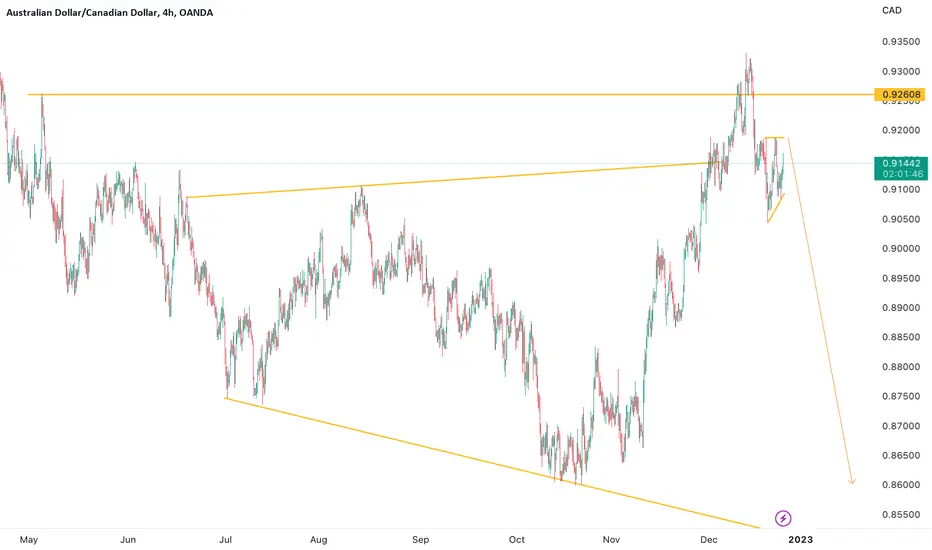
AUDCAD : SHORT BIASExpanding channel with a bearish impulsive rejection on a double top, followed by a corrective structure.
A rejection at the third touch of the corrective structure on the lower timeframe will suffice for a short position, down to the low of the expanding structure.
GOLD, Bearish BiasHTF Bearish
LTF Bearish
Ascending channel
Double Top
Looking for more downside to come in the next coming weeks.
Trade Safe
Thanks

EURCHF, looks bearishHTF Bearish
LTF Bearish
Double Top
Ascending channel, H&S
Looking for more downside to continue. If price breaks above 0.995 invalidates this sell set up. Will look for another opportunity around 1.02 area.
Trade Safe
Thanks

DOW - Short OpportunityA double top pattern was formed and the stock crashed and now price has retraced back to the resistance level, giving us another opportunity to ride the waves down. Near-term short signal has also appeared. Price failed to break above 200 MA, showing bearish sentiments.
Entry: 49.77
Stop Loss: 53.6
Take-Profit Target: 43.95


West Texas Crude(WTI )....Positive Swans, Bats and Wolfves Picking bottoms particularly recently in the oil (WTI) complex, sometimes produces sticky fingers.
That said, one could build a technical analysis case for a bottom formation at current levels.
A) Longer term we have a completion of a Harmonic Bat. (insert)
B) Shorter term turn we have :
1) A completed Wolfe Wave
2) Black Swan harmonic formation
3) An ABCD formation going back to last August.
4) Oct/Nov double top target hit
5) Mildly positive momentum divergence
So how do you play this.
I would certainly give WTI a chance to find a bottom and advance upward
A penetration of 3 of the Wolfe Wave provides an entry point at $73.65(marked)
Then a Wolfe Wave Target is set up for late January at the $85 area.
Using the Black Swan harmonic we get targets as marked.
If this the best way to play bottoming oil ? Probably not but its a signpost to play your favorite horse.
Please note... Fed activity next week, year end illiquidity and Eastern European events should magnify WTI's volatility going forward.
Good Luck and I will update as needed.
Not investment advice, do your own due diligence.
S.

EURAUD, My trade setup explained.EURAUD is approaching an interesting area which could give us a high probability set up if given confirmation in the price action.
Daily time frame shows that the price is approaching the upper boundary of an falling expanding structure. After a period of consolidation within the last couple months, we had a push upwards which is now losing momentum and correctively moving up towards HTF boundary. If price gives us a strong reversal impulse, I would look for a sell entry on the next LTF correction with a swing target at 1.5270 range.
Now, if we don't see the bearish price action we need for this set up and price breaks out of the structure, I will be looking for another sell opportunity around the 1.6170 range.
Trade Safe
Thanks

GOING LONG IN AUDUSD | TRADING STRATEGYBullish Indications
1. Series of Higher Highs and Lows
2. Significance Support Area at Entry Point
3. AUD Index is Bullish
4. USD Index is Bearish/Sideways
5. Volumes are increasing as the price is in the range
Bearish Indications
1. Break 0.236 Fib level support
2. Recently Formed Double Top which is a reversal pattern
3. Break Trend line support

US 30 - Double Top patternOn US30, there is a double top formation with the break and retest of the neck line.

USDCAD Idea 12/18/2022
Trading is all about patience. If you’re not patience, the probability of failing is very high. Here is my thoughts of USDCAD
Price closed within the zone so there are two options on this pair.
1. Price goes back down and retest zone and drop
2. Price creates double bottom and goes up to the next major zone
Look at smaller time frames for patterns such as double tops and double bottoms for more confirmation.
Remember to trade responsible. This is not a signal at all, just my thoughts.

CADJPY Idea 12/18/2022Trading is all about patience. If you’re not patience, the probability of failing is very high. Here is my thoughts of CADJPY
I am looking at two scenarios with CJ.
1. Price break below 99.800 and drop to the next area which is 98.000
2. Price retest current price and creates a double bottom and goes back up to 101.000
Look at smaller time frames for patterns such as double tops and double bottoms for more confirmation.
Remember to trade responsible. This is not a signal at all, just my thoughts.

NZDUSD Idea 12/18/2022Trading is all about patience. If you’re not patience, the probability of failing is very high. Here is my thoughts of NZDUSD
Price closed above this zone (0.63725), once the market is open today I will be waiting for a retest on the zone and see if any long positions open up if not, we can wait for price to break below and close underneath the zone and look for short positions
Look at smaller time frames for patterns such as double tops and double bottoms for more confirmation.
Remember to trade responsible. This is not a signal at all, just my thoughts.

NZDJPY - overall bearish price action.HTF Bearish
LTF Bearish
Strong Reversal impulse followed by correction
Double Top
Price currently in consolidation, Looking for sell opportunity towards top of LTF continuation.
Thanks
Trade Safe

USDJPY Idea 12/15/2022Trading is all about patience. If you’re not patience, the probability of failing is very high. Here is my thoughts of USDJPY
I am looking for price to rise and retest price 137.850 and then look at smaller time frames for patterns for confirmation on short positions.
Look at smaller time frames for patterns such as double tops and double bottoms for more confirmation.
Remember to trade responsible. This is not a signal at all, just my thoughts.
