US 100 - Double topWe are having a double top formation on the 1H time frame with the break and retest of the neckline
Double Top

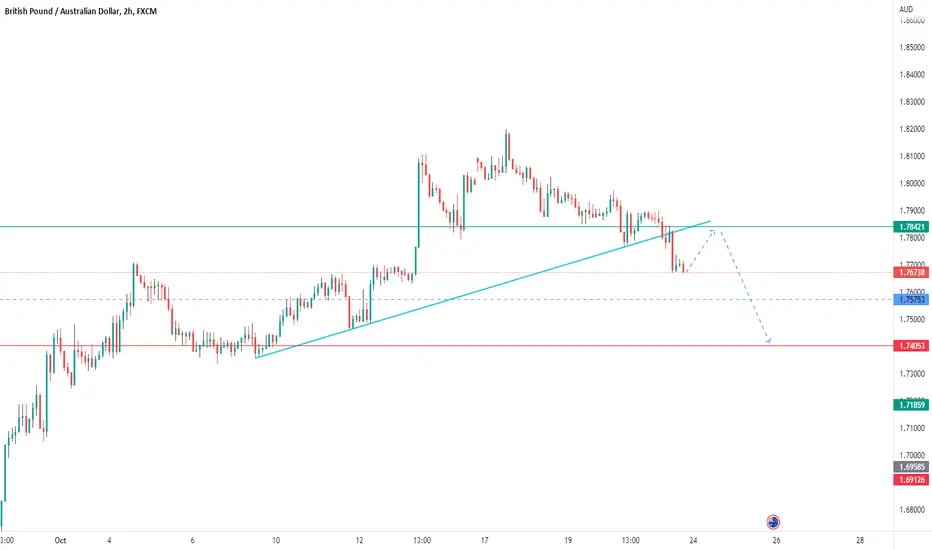
Potential DT at resistance GBPAUD - HTF Price consolidating, again another potential DT, Alarms set above the weekly TL and at 1.76561 (Big breakout zones), either way I want to catch this one!

Axis Bank Double top and shooting Star Double Top + Shooting Star
919.95 SL
900.85 Second bearish candle low
1:1 target 881.75

Gold is VulnerableGold has fallen below the 50-month MA (thick blue), 200-month MA (red), and is below all of the major monthly, weekly, and daily moving averages. It’s in a well-established downtrend channel after a major double top breakdown with a retest. The green line pointed to by the green arrow was a potential major uptrend line which was broken and retested. The next major trend line is the line pointed to by the purple arrow which is next to the 100-month MA (yellow). This is a logical support/target area.
The Commitments of Traders (COT) report from last week show that commercials (Producer/merchant), swap dealers, and managed money are net long by a significant margin and that “Other reportables” have taken the other side of trade. I’m not sure who all these “other reportables” are but I’m sure retail traders would fall in this category. Normally the big dogs are not all on the same side of the trade but when they are, it kind of makes coming to a conclusion about likely direction based on the COT report a lot easier.
Position:
Short 2 micros since this morning at 1641.
stops: 1645 and 1652
targets: 1625 and 1503

XAUUSDDOUBLE TOP was been form that gave me a clear confirmation the sellers have it. MY ENTRY will be at the neckline why am sure about my trade, sl 1797.04 my takeprofit will be 1427.06 and tp 2 1394.52

░▒₿▒░ 💀 DOUBLE TOP 💀 | 1D ░▒₿▒░COINBASE:BTCUSD
Bitcoin - Spread Double Top Descending.
This is currently an increasing probability. Dec. 13-16th is the time area where this will be determined.
We would need to break the blue dotted trend line to further increase the odds of this senerio and probability solidification. While this scenario does have a likelihood of breaking the current trend .... The odds are apparently less likely that this scenario will be technically considered a "Double Top" and reach below $29K for a considerable amount of time, let alone any.
I'll be posting more as I see a major bull pattern playing out that needs further analysis.
~Memento Mori

Btcusd sell ideaSell Entry 20955.50
Tp1. 20566.50
Tp2. 20315.80
Tp3. 19755.50
Its gonna fall that it has completed head and shoulders and its forming a double top

DAX - Where to next?DAX - Where to next?
Here is a technical view of DAX - a break to either direction. Keep in mind we do have FOMC next week, which should shift markets either direction!
Have a great weekend.
TJ

USDCHF - BREAK OF STRUCTURE 📉📉The USDCHF price is in Daily Resistance Level & BEARISH RISING WEDGE Pattern🧐
the key level is broken 🔥
so! i predict a bearish move 📉 i'm waiting for a pullback 📈
TARGET: 0.97593🎯
...
if you agreed with this IDEA, please leave a LIKE, SUBSCRIBE or COMMENT!

CADCHF - BEARISH TRIPLE TOPThe CADCHF price is in Daily Resistance Level & Bearish Triple Top Pattern🧐
the neckline is broken 🔥
so! i predict a bearish move 📉
TARGET: 0.71560 🎯
...
if you agreed with this IDEA, please leave a LIKE, SUBSCRIBE or COMMENT!

Possible short trades for ETH on hourlyI think these are nice possible short trades on hourly.
The first one I see is price pullback to around ~1356 and I set stop loss of 1.25% for this, this is a bit risky and can be tighter but I'm ok with entering with small position here. I'm looking for first TP around ~1325, which is one of the target I got from this fib.
The second one I see is possible double top forming around ~1370 and I set stop loss of 0.5% for this, it can be tighter since it is based on double top forming. This trade is much more safer and the first TP is still around ~1325 considering the strong trendline support.
I personally plan on entering with small position at ~1356 and adding some more at ~1370 with stop loss being above the possible double top scenario.
Note:
I'm only going to take these trades on these entry targets being hit and I will also be looking at the price action around these entries for confirmations.
To see clearly, zoom in.

GBPAUD Breaks The TrendlineGBPAUD has broken the ascending trendline suggesting continuation of the bearish retracement towards the support.
The bearish move is solidified by the double top and bearish divergence on H4 tf.
GBPUSD Daily TF analysisGU looks to have made a skew double top on the daily time frame on a resistance zone, and on the EMA resistance, I still think that we will sell this pair as I said yesterday. They came to look for stop losses, but painted a better picture by doing so, confirming a strong resistance 1.13272. I am in a sell from 1.11972 from last night. So will see how the rest of the day plays out.

EURUSDHi traders, EURUSD is setting up for a upside possible move i am expecting from price to hold the bottom and looking price action for a long position opportunity.
Trade with your according strategy GOOD LUCK.

4hr GBPUSD Patterns in patternsAs you can see marked out on my charts, the yellow arrows show the top of a massive double-top structure. Both these structures have tested and could not break the 200ema(white line, red arrow) which acts as a very strong support\ resistance.
The second leg of this double top is forming a head and shoulders at the 200ema resistance, and if you look closely, the head of the head and shoulder structure is actually a double top. If you go into smaller time frames you will also see these structures within structures. Its magic lol.
Boost me if you like what I post. Dont be shy

Double top on 1hr, at resistanceGJ has formed a double top structure on the 1hr chart at resistance @ 168.580. If the current stick closes red we going down. Confirming the earlier analysis of 4hr double top and retest under resistance. Just observe the trade and see. Price always returns to the 200ema(white), lets test the theory, maybe today or tomorrow we should get there
P.S GJ is Bae

GBPCAD - BREAK OF STRUCTURE 📉The GBPCAD price is in Daily Resistance Level & Double TOP Pattern🧐
the neckline is broken & Retested 🔥
so! i predict a bearish move 📉
TARGET: 1.46886 🎯
...
if you agreed with this IDEA, please leave a LIKE, SUBSCRIBE or COMMENT!

Thu 20th October 2022 EUR/NZD Daily Forex Chart Sell SetupGood morning fellow traders. On my Daily Forex charts using the High Probability & Divergence trading methods from my books, I have identified a new trade setup this morning. As usual, you can read my notes on the chart for my thoughts on this setup. The trade being a EUR/NZD Sell. Enjoy the day all. Cheers. Jim

$MATIC | Double Top? McDonalds M Coming?Here we have one of my personal favorite cryptos & L2 sidechains, MATICUSD or Polygon. Potentially we may see, a downtrend because of a couple of factors. Let’s zoom in!
I see the potential for a “McDonald’s M” or most notably referred to as a Head & Shoulders pattern which could signify a downtrend.
Here are some reasonings & findings:
* MATIC has touched the 0.8721 area twice now but has pushed through this resistance
* Upper Bollinger Band has been broken previously
* Nearing extreme overbought statuses on the RSI
* After the initial push down from the 0.8721 area, 0.8456 acted as support for the potential “head” of the pattern
* MATIC is still above the 200 EMA
The last note should be taken into consideration when placing a SHORT trade for MATIC. It is still above the 200 EMA currently so a safe TAKE PROFT could be back to the “neck line” area of 0.8456 in case there is a bounce and your STOP LOSS above the resistance area of 0.8721.

Will Gold (XAU/USD) continue to move lower over the long-haul?This is a weekly chart of Gold.
During the first week of August 2020, XAU/USD made an all-time high of 2075.11. During the week of March 7th, 2022, XAU/USD came within a few dollars of reaching that peak again, forming a double top.
The target for a double top is the height between the 2 peaks of the top, added to the breakdown point. In this case, it is near 1290.
Notice the correlation between the US Dollar Index (DXY) and Gold in the bottom panel of the chart. The current correlation is -0.92. Readings below -0.80 are considered strong negative correlations. Therefore, if the DXY continues to move higher, Gold should continue to move lower on the weekly timeframe (as long as the correlation remains).
First confluence of support is at the lows from the last week of September and the 50% retracement level from the lows of August 2018 to the highs of August 2020, near 1615.
If price breaks below there, support is at the 61.8% Fibonacci retracement level from the same timeframe near 1510 , then the lows from the week of March 2020 at 1451.27.
However, if the double top plays out, price could reach 1290!

GOLD is a BIGGER BUBBLE than the S&P500?? Look away gold bugsThis chart shows GOLD and S&P500 on the same % change axis since 1965.
Based on this timescale, GOLD has had a GREATER % rise in price than the S&P 500.
But hang on, isn't GOLD price supressed and is the only asset class NOT in the EVERYTHING BUBBLE?
FALSE NARRATIVE!! Zoom out to this longer time scale and see that GOLD has also ascended into NOSE BLEED BUBBLE TERRITORY, its just timed its climbs different to equities. +++ It gets worse.... GOLD has painted a HUMUNGOUS double top which is now bearing down a top of the gold chart.
CONCLUSION: Gold is every much as part of the everything bubble as STOCKS and REAL ESTATE. GOLD will not be a safe haven and will fall in a similar way to stonks (MASSIVELY) in the coming depression

Possible double top on 4hI think this is a nice possible short to at least ~1275, the take profit levels are based on the golden pocket fib level as I have explained on chart and I can see the price going there. But, my first take profit will be ~1275, because I think there can be a bounce there. I think stop loss needs to be tight here since it's based on double top.
Notes:
The path I have drawn is only the direction and I have not strictly considered support/resistance levels while drawing it.
This is just a possible scenario I'm seeing, thank you for reading, I would love to see any kind of feedback.
I like my charts clean and I don't like bright/flashy colors so I use colors that I feel most comfortable with, especially with my monitor. If I use bright colors it burns my eyes.
I'm also a fairly new trader and got a lot to learn.

GBPUSD, critical area of interest.Hi Traders,
GBPUSD is at an area of interest to see if bulls can push the price higher if sellers will take over and create a reversal.
I personally would want to see some bearish some price action to look for a sell entry.
Thanks
Good luck
