LOW RISK ETH SHORTSimply hopped into an ETH Short at around 11;15 pm EST
about a 40 pip SL @ $2,580
Looking for a 1:4 or 1:5
TP 1 : 2,487
TP 2 : 2,420
TP 3 : 2,355
If you can handle volatility hold till possible $2,100 or below!
Always good to scale in and out protecting your capital EFFICIENTLY!
Let's Get it PPFX Fam! Peace
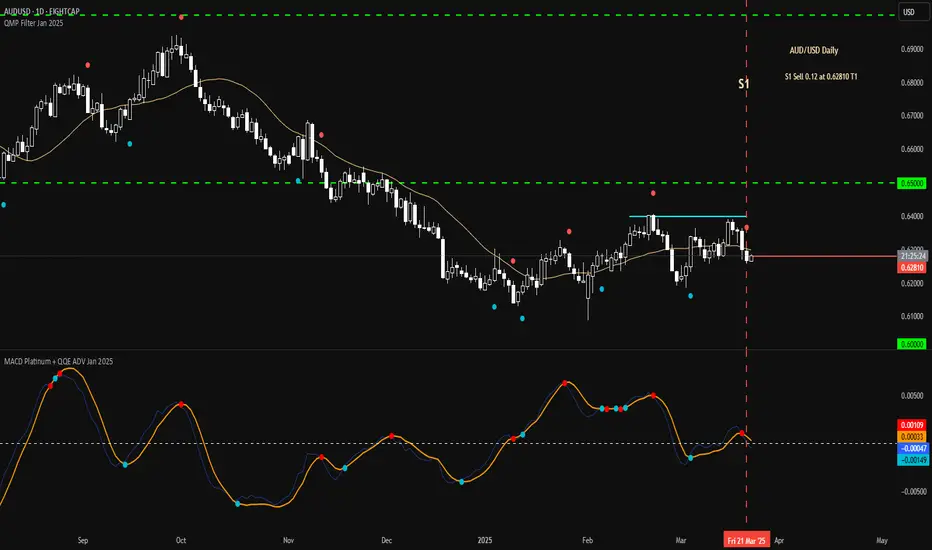
Double Top

Mon 24th Mar 2025 AUD/USD Daily Forex Chart Sell SetupGood morning fellow traders. On my Daily Forex charts using the High Probability & Divergence trading methods from my books, I have identified a new trade setup this morning. As usual, you can read my notes on the chart for my thoughts on this setup. The trade being a AUD/USD Sell. Enjoy the day all. Cheers. Jim
EUR/USD Technical Analysis – Double Top Pattern & Bearish MoveThis EUR/USD 1-hour chart presents a clear Double Top pattern, signaling a potential trend reversal. The chart displays key technical elements, including support and resistance levels, trendlines, a stop-loss placement, and a take-profit target. Let’s go through an in-depth professional breakdown of this trading setup.
1. Market Structure and Trend Analysis
Before identifying the pattern, it’s crucial to analyze the market structure:
✔ The price had been in an uptrend initially, making higher highs and higher lows.
✔ However, the trend began to weaken after hitting resistance at the 1.0950 zone.
✔ This failure to break higher created a double top, which is a strong bearish reversal signal.
A double top forms when the price reaches a high twice, fails to break above resistance, and then declines past the neckline (support level), confirming trend reversal.
2. Double Top Pattern Breakdown
🔹 First Peak (Top 1):
The price surged upwards, hitting the resistance zone at 1.0950, but faced selling pressure.
The rejection resulted in a pullback to the neckline (support level at 1.0800-1.0820).
🔹 Second Peak (Top 2):
The price attempted another rally but failed at the same resistance zone, confirming seller dominance.
The second rejection suggests a lack of bullish strength, signaling a potential shift in momentum.
🔹 Neckline (Support Breakdown):
The key support zone around 1.0800 acted as a pivot level.
Once this level was breached, it confirmed bearish continuation.
3. Key Technical Levels & Price Action Signals
🟢 Resistance Level – 1.0950 Zone
This level has acted as a strong supply zone where sellers stepped in to push prices lower. The two failed breakout attempts indicate that buyers lost control.
🔵 Support Level (Neckline) – 1.0800-1.0820 Zone
Initially, this area provided buyer support, but once broken, it became a resistance level (previous support turns into new resistance).
⚡ Stop-Loss Placement – 1.09190
A well-placed stop-loss above the resistance zone protects against false breakouts.
If the price rises above this level, it invalidates the bearish structure.
🎯 Take-Profit Target – 1.06916
The projected target aligns with the measured move (the distance from the resistance to the neckline).
The price may find support at this level, where traders should look for a potential reversal or continuation.
4. Confirmation of Bearish Breakdown
For a high-confidence short trade, multiple confluences support the bearish bias:
✔ Break & Retest of the Neckline – After breaking support, the price attempted a retest and failed, confirming resistance.
✔ Trendline Break – The trendline supporting the previous uptrend has been decisively broken.
✔ Bearish Price Action – The formation of strong red candles and lower highs suggests sustained selling pressure.
✔ Momentum Shift – Increased bearish volume further confirms the reversal strength.
5. Trading Strategy & Execution Plan
✅ Entry Criteria
Sell after the retest rejection at the previous support (now resistance).
Look for a strong bearish candle formation as a confirmation signal.
📉 Risk Management
Stop-Loss: Placed slightly above 1.09190, ensuring the pattern remains valid.
Take-Profit: Target set at 1.06916, aligning with previous structure support.
💰 Risk-Reward Ratio
The setup offers an attractive risk-to-reward ratio, making it a high-probability trade.
6. Alternative Scenarios & Market Considerations
Although the bearish bias is dominant, traders should be prepared for alternative outcomes:
🔸 Fakeout Risk: If price closes above 1.09190, it could indicate a failed breakdown, invalidating the trade.
🔸 Bounce from 1.06916: If the price reaches the target support zone, buyers might step in, leading to a potential reversal.
🔸 Fundamental Influence: News events (such as FOMC, ECB statements, or US inflation data) can increase volatility and impact price direction.
7. Conclusion – A High-Probability Short Trade
This Double Top pattern setup presents a textbook bearish reversal, offering an excellent short-selling opportunity. The combination of technical confirmations, price action signals, and a well-structured risk-reward ratio makes this trade highly reliable.
Final Takeaways:
✔ Bearish Confirmation – Double Top breakdown with a retest rejection.
✔ Sell Setup Validity – Below 1.0800 support.
✔ Stop-Loss & Target Defined – Risk-controlled strategy execution.
📊 Verdict: Bearish trade setup with downside potential toward 1.06916. Traders should monitor price action for further confirmations! 🚀

A Triple Top Pattern: Signals and StrategiesA Triple Top Pattern: Signals and Strategies
Traders are always on the lookout for reliable analysis tools that can help them make informed trading decisions. One such tool is the triple top trading pattern. It is a bearish reversal formation that can help traders identify potential trend reversals and take advantage of market opportunities.
In this FXOpen article, we will explore what the triple top pattern is, what it indicates, and how to identify it on price charts. Keep reading to find examples that will help you understand how to use it in a trading strategy.
What Is a Triple Top Pattern?
A triple top is a technical analysis pattern that signals a potential reversal in a trend. Is the triple top bullish or bearish? It’s a bearish formation. The pattern occurs when the price of an asset hits the same resistance level three times, failing to break above it on each occasion. This indicates that buyers are losing strength and sellers are starting to dominate the market. It is often seen after a sustained uptrend.
Identifying a triple top involves spotting three distinct peaks at roughly the same price level, separated by two troughs. The peaks are formed when the price hits resistance but fails to push through, while the troughs occur when the price retraces after each failed attempt.
To confirm a valid triple top, the peaks should be close in height, and the troughs should create a roughly horizontal neckline. The pattern is confirmed when the price breaks below the neckline, signalling that sellers have overtaken buyers.
Triple Top Chart Pattern Trading Strategy
Once traders have identified the triple top formation, they can use various trading strategies to take advantage of it. However, there are common rules that are used as the basis:
- Entry: Traders enter a short position when the price breaks below the neckline, which is the level that connects the two troughs that separate the peaks. This level is a critical support level, and when it is broken, it confirms the triple top candlestick pattern and indicates that the trend is reversing.
- Stop Loss: To manage risk, traders place a stop-loss order above the neckline. If the price starts to rise again, the stop-loss order will limit potential losses. The theory states that traders can place a stop-loss on the neckline. However, the price often retests the support level after a breakout, so the risk of an early exit rises.
- Take Profit: There are several ways of determining a profit target. The most common technique is to measure the distance between the tops and bottoms and subtract it from the triple top breakout point.
Another strategy is to identify the target based on the closest support levels. However, this may limit potential returns if the support is too close to the entry point. Therefore, traders sometimes use trailing stops to lock in potential profits as the price continues to fall.
Trading Example
In the chart above, the price formed the triple top. We could have entered a short position once the price broke below the neckline and closed it either at the point equal to the distance between the peaks and the neckline or at the closest support level, as the levels are almost equal. However, selling volumes were low (1) at the breakout level, so we could have expected an upcoming bullish reversal. Therefore, we wouldn’t have kept the position beyond the initial take-profit target.
How Traders Confirm the Triple Top
To confirm the triple top pattern and ensure its validity, traders use a combination of technical tools and indicators. These help confirm that the trend is indeed reversing and not just experiencing a temporary pullback. Here are the key methods traders use:
- Neckline Break. The most important confirmation comes when the price breaks below the neckline, which is the horizontal level connecting the lows between the peaks. A clean break suggests a stronger reversal.
- Volume Analysis. Volume plays a crucial role in confirming the triple top. Traders look for a surge in selling volume when the price breaks the neckline. If the volume is low during the breakout, the pattern may not be reliable, and a bullish reversal could follow.
- Momentum Indicators. Traders often use momentum indicators like the Stochastic Oscillator or Moving Average Convergence Divergence (MACD). When these indicators show bearish divergence, it signals a potential downward reversal. A negative crossover in the MACD or Stochastic adds further confirmation.
- Retest of Neckline. Sometimes, after breaking the neckline, the price may retrace and retest this level as resistance. A failed retest, where the price does not move back above the neckline, confirms that sellers are in control.
Triple Top vs Triple Bottom
It is important to distinguish between the triple top and the triple bottom chart patterns, as the former is the bearish setup, while the latter is a bullish reversal formation. The triple bottom setup forms when the price hits a particular support level three times and fails to break through it. It suggests that the sellers have lost their strength, and the buyers are starting to take control. The bottoms are separated by two peaks, which occur when the price retraces some of its gains from the support level.
Traders use the same principles to trade the triple bottom as they would the triple top but vice versa. They enter a long position when the price breaks above the neckline and set a stop-loss order below it. The take-profit target might equal the distance between bottoms and peaks or be set at the closest resistance level.
Triple Top Challenges
While the triple top pattern is a valuable tool for spotting reversals, it has its limitations. Traders should be aware of the following challenges:
- False Breakouts. The price may break below the neckline only to quickly reverse back, leading to a false signal. This can cause traders to enter losing positions if they act too quickly without further confirmation.
- Extended Sideways Movement. Sometimes, the price can stay near the neckline after a breakout, leading to indecision and uncertain market behaviour. This sideways movement can make it difficult to determine if the trend has truly reversed.
- Retests Leading to Reversals. After the initial breakout, the price may retest the neckline and move back above it, invalidating the triple top pattern. Traders need to be cautious and set appropriate stop-loss orders to help potentially mitigate risk.
Final Thoughts
The triple top pattern offers traders a powerful tool for identifying potential market reversals. However, it’s crucial to confirm the pattern and integrate it with other forms of analysis to avoid false signals. Ready to put these insights into action? Open an FXOpen account today, and trade with a broker offering tight spreads, low commissions, and advanced trading platforms.
FAQ
What Does a Triple Top Mean in Trading?
The triple top pattern meaning refers to a bearish reversal formation indicating a potential end to an uptrend. It forms when the price reaches the same resistance level three times without breaking through, suggesting weakening buying momentum and increasing selling pressure. This pattern signals that the asset's price may soon decline.
How Do You Confirm the Triple Top Pattern?
To confirm a triple top pattern, traders watch for a decisive break below the neckline, which connects the lows between the peaks. Increased trading volume during the breakout strengthens the confirmation, indicating strong seller interest. Technical indicators like the Stochastic Oscillator showing bearish divergence can provide additional validation.
Is a Triple Top Bullish?
No, a triple top is not bullish; it is a bearish reversal pattern. It signifies that the asset's price has repeatedly failed to surpass a resistance level, indicating diminishing upward momentum. Traders see this as a cue to consider short positions or to exit existing long positions.
Is a Triple Top Stronger Than a Double Top?
A triple top is generally considered stronger than a double top pattern because the price has failed to break resistance three times instead of two. This extra failed attempt reinforces the strength of the resistance level and increases the likelihood of a significant reversal. However, both patterns are important and should be analysed with other market factors.
This article represents the opinion of the Companies operating under the FXOpen brand only. It is not to be construed as an offer, solicitation, or recommendation with respect to products and services provided by the Companies operating under the FXOpen brand, nor is it to be considered financial advice.

US Market Reversal Emerged? This Week's Closing is CrucialThe final trading day of February. I always take the opportunity to analyze the monthly chart closely.
We saw an inverted hammer. From the cash chart, clearly, we can see the inverted hammer. Beyond that, it also appears to be a potential double top for the Nasdaq.
E-mini Nasdaq Futures & Options
Ticker: NQ
Minimum fluctuation:
0.25 index points = $5.00
Micro E-mini Nasdaq Futures & Options
Ticker: MNQ
Minimum fluctuation:
0.25 index points = $0.50
Disclaimer:
• What presented here is not a recommendation, please consult your licensed broker.
• Our mission is to create lateral thinking skills for every investor and trader, knowing when to take a calculated risk with market uncertainty and a bolder risk when opportunity arises.
CME Real-time Market Data help identify trading set-ups in real-time and express my market views. If you have futures in your trading portfolio, you can check out on CME Group data plans available that suit your trading needs tradingview.com/cme/
Trading the Micro: cmegroup.com/markets/microsuite.html

Dow Jones: A Make-or-Break Buy Setup with Smart Money BackingDow Jones Industrial Average - Buy Setup
Technical: U.S. markets have struggled recently due to uncertainty over tariffs imposed by President Trump. While the S&P 500 and NASDAQ have broken key support levels, the Dow remains resilient, holding the critical 41,648 support. A break below would confirm a large double-top pattern, signaling a bearish outlook. This is a pivotal moment. The rebound from overnight lows is encouraging, but with the U.S. CPI release tomorrow, caution is warranted. While speculative, COT and seasonal data favour a short-term move higher.
Fundamental: The latest Commitment of Traders (COT) Report shows increasing long interest in the Dow, suggesting "smart money" accumulation.
Seasonal: Historically, from March 12 – May 2, the Dow has posted gains 84% of the time, averaging +3.68% over the past 25 years.
Setup:
Entry: 41,800 – 42,000
Stop Loss: 41,285 (below the Nov 2024 low at 41,648)
Target: 44,290
Disclosure: I am part of Trade Nation's Influencer program and receive a monthly fee for using their TradingView charts in my analysis.

Bitcoin: Mastering the Art of Resistance and SupportBitcoin recently broke below a 105‐day trading range, anchored by the critical 90K level. After the breakdown, it found support around 80K, prompting a sharp rebound back toward the previous range. This rebound, however, was short‐lived: BTC tested 95K, then quickly retraced, only to rally again toward 90K, where it trades at present.
Overview of BTC’s 105‐Day Range Break and Retest:
Yearly Open at $93,576: This is the single most important level to watch. Price currently sits below the yearly open, suggesting that, for now, bears hold the upper hand. If bulls cannot reclaim this threshold, the yearly candle remains vulnerable to turning red.
90K–95K Resistance Zone: With Bitcoin failing to sustain gains above 95K, this band becomes a natural focal point for potential short entries. Bears are expected to defend this region aggressively.
The question: Where do we go next? Let’s break down both the resistance (short setup) and an upcoming support zone (long setup), incorporating a variety of confluences—from volume profiles and trend lines to Fibonacci retracements and pitchfork alignments.
1. Resistance Analysis & Short Thesis
1.1. Double Top Target at $72,800
A double top pattern has formed, suggesting a measured‐move target near $72,800. While not a guaranteed endpoint, this target serves as an early directional clue. Price could still find support at higher levels, so we use this only as one piece of a larger puzzle.
Double Top Pattern with $72,800 Target:
1.2. The 105‐Day Trading Range & Retest
Bitcoin spent over 100 days ranging between roughly 90K and 105K. The downside break turned that prior range into a new resistance zone—specifically 90K–95K, with an even stronger cluster up to $96,418 (Point of Control from that range).
Fixed Range Volume Profile: The POC (Point of Control) from this 105‐day period lies at $96,418.05, further extending our resistance zone. Price retesting anywhere between 90K and the POC around 96K sets up potential short entries.
Fixed Range Volume Profile Showing POC at $96,418.05:
Stop Loss Guidance: Given the possibility of wicks or “stop hunts,” a safer invalidation point sits above 98K. That buffer allows the trade room to breathe without prematurely stopping out on minor spikes.
1.3. Daily & Weekly Moving Averages
In addition to the above factors, both the daily 21 EMA/SMA and the weekly 21 EMA/SMA are converging in the 90-92K region, acting as additional resistance.
1.4. Bearish Trend Line & Pitchfork Alignment
Bearish Trend Line: Connecting the all‐time high at $109,588 and the swing high at $106,457.44 yields a downward sloping line. This trend line has already acted as resistance near 100K on February 21.
Pitchfork (Modified Schiff): Anchoring from the all‐time high (109,588) to the swing low (97,777.77) and back up to 106,457.44 confirms the same bearish trajectory, aligning neatly with the trend line around 95K.
Bearish Trend Line & Pitchfork Convergence Around 95K:
1.5. Monthly Order Block & Fibonacci Confluence
Monthly Order Block: Spanning from the yearly open (93,576) up to the POC (~96,418), this monthly order block forms a substantial supply zone. Price often gravitates toward the median line of an order block, which sits near 94–95K.
Fibonacci Retracement (0.786): From the swing high at 99,475 (Feb 21) down to the low at 78,258.52, the 0.786 retracement is at 94,934.67—almost exactly the median line of the monthly order block.
Monthly Order Block, Median Line, and 0.786 Fib at ~94,934.67:
When price rallies swiftly to the 0.786 for the first time, it often presents an ideal short entry—especially under a confluence of bearish signals:
2. Short Trade Setup: Laddering In & Out
2.1. Scaling In (Entries)
We allocate $25,000 (from a $100,000 account) and ladder our entries from 89,736 up to 96,206:
Short Trade Laddered Entries:
Stop Loss: $97,560 (slightly below the higher “breathing room” area of 98K).
Max Risk: Approximately $1,028.16 (about 4.11% of the GETTEX:25K position, or 1.03% of the $100k account).
2.2. Scaling Out (Exits)
We plan to take profits in increments as price drops, aiming for an average exit around $79,822.10:
Potential Profit: Approximately $3,704.16 on a $25,000 position, which is +14.82% (or +3.70% of the $100k account).
Risk‐to‐Reward Ratio: 3.60, an attractive R:R for a swing trade.
3. Support Analysis & Long Thesis
Having addressed the downside retest and short scenario, let’s turn to potential support where Bitcoin might reverse for a long trade.
3.1. Double Top Target & 5‐Wave Structure
The double top projected target near $72,800 aligns with a broader Elliott Wave possibility, where BTC may have completed a 5‐wave structure from the low at $15,476 to the all‐time high at $109,588.
A typical Fibonacci retracement of this 5‐wave move suggests the 0.382 level at $73,637.22, which sits near a notable swing high of $73,777—coincidence?
5‐Wave Structure & 0.382 Fib Retracement at ~$73,637:
3.2. Monthly Bullish Order Block & Further Fib Confluence
Monthly Bullish Order Block: Located around $71,280, historically a place where buyers have stepped in.
Fib Retracement (49K to 109K): The 0.618 retracement lands at $72,144.62, adding further confluence around the 72–73K zone.
Taken together, we begin to see a support band forming between $73,777 and $71,280.
Monthly Bullish Order Block & 0.618 Fib ~$72,144.62:
3.3. Fib Speed Fan & Bullish Trend Line
Fib Speed Fan (0.7): On higher timeframes, the 0.7 fan lines up with the same 71–73K region if BTC dips this month.
Bullish Trend Line: Connecting the lows at 49K and 52,550 also aligns with this zone, reinforcing the idea that a cluster of support awaits if price slides that far.
Bullish Trend Line & Fib Speed Fan ~$71–73K:
3.4. Potential Long Trade Setup
Entry Range: Ladder in from 76K down to 71K (or adjust according to personal risk appetite within that 73–71K zone).
Stop Loss: Below 70K, providing sufficient buffer.
Target: At least the monthly open ($84,350), or higher if momentum supports a stronger bounce.
Risk‐to‐Reward (R:R): Aim for 2:1 or better, depending on exact entries and the final target.
4. Summary
Short Trade:
Resistance Zone: 90K–95K, extending up to $96,418 (POC) and with the daily/weekly 21 EMA/SMA acting as additional resistance in the 90-92K region, plus a stop‐hunt buffer above 98K.
Laddered Entry: GETTEX:25K allocated, averaging around $93,706, with a stop near $97,560.
Scaling Out: Average exit near $79,822, netting a +14.82% gain on the position (+3.70% on account).
R:R: 3.60—solid for a swing setup.
Long Trade:
Support Zone: Between $73,777 and $71,280, with multiple Fibonacci and structural confluences.
Laddered Entry: Potential DCA from around 76K down to 71K, with a stop under 70K.
Target: At least $84,350 (monthly open), likely offering a 2:1 or better risk‐to‐reward.
Sharp moves up or down have been the norm lately, often gravitating to the 0.786 fib retracement on each leg, so remain vigilant for sudden volatility.
Ultimately, flexibility is key. If Bitcoin reclaims the yearly open at $93,576 and pushes decisively above 95–98K, the bearish case weakens. Conversely, a significant drop below 80K brings the deeper support zone near 73–71K into sharper focus.
Always be prepared for shifts in market conditions—confirm each setup with multiple indicators and chart patterns before entering any trade. Stay up to date with evolving market dynamics and adjust your strategy accordingly.
Happy trading!
P.S. If you have any coin requests, feel free to share them in the comments. I will be selecting one or two for the next technical analysis.

BTCUSD – Head & Shoulders Confirmed?In my previous analysis ( ), I outlined a potential Head & Shoulders formation that could lead to a bearish move. So far, price action has followed this structure accurately.
Key Developments:
✅ The right shoulder seems to be forming as expected.
✅ Price grabbed liquidity above $92,500 before reacting downward.
✅ A double top has formed, adding further bearish confluence.
What’s Next?
If the market respects this pattern, a break below the neckline could confirm a continuation lower, with a potential target at $59,117 , aligning with the full Head & Shoulders projection.
Conclusion:
So far, this setup is playing out perfectly. If bearish pressure continues, we could see a deeper decline. However, a sustained move above $95,150 would invalidate this scenario.
🔔 Do you see BTC following this path, or do you expect a bullish surprise? Drop your thoughts below!

Double Top Trading Pattern: A Classic Reversal SetupHello, Traders! 👋🏻
Have you ever noticed a market attempting to break through the same resistance level twice, only to fail both times?
This formation is known as the double top pattern and often signals a potential bearish reversal. But is a double top bullish or bearish across all markets? Let’s dive into the meaning of the double top pattern and how to identify it on your charts!
What Is a Double Top? 👀
A double top is a chart formation where the price reaches a high, pulls back, and then rallies again to the same or a very close high but fails to break through. This second failure to surpass the previous peak suggests buyers are losing momentum, paving the way for a potential downtrend.
Key Points of the Double Top Chart Pattern:
Two Prominent Highs: The peaks are usually at similar price levels.
Neckline (Support Level): The interim low between the two peaks forms a support line.
Bearish Sentiment: When the price breaks below the neckline, it confirms a potential trend reversal to the downside.
Is a Double Top Bullish or Bearish?
The double top pattern is bearish because it signals that the uptrend is weakening and sellers are gaining control. After the neckline breaks, it often results in a significant price drop.
Key Features of a Bearish Double Top Pattern
The Two Peaks Are Nearly Equal in Height.
Volume Declines on the Second Peak, Showing Reduced Buying Pressure.
A Breakdown Below the Neckline Confirms the Pattern and Triggers the Downtrend.
Advantages of a Double Top Pattern
Clear Trend Reversal Signal: A double-top chart pattern visually indicates a potential shift from an uptrend to a downtrend.
Defined Resistance Level for Risk Management: The two peaks at similar price levels create a strong resistance zone. This allows traders to place Stop-Loss orders effectively and set profit targets with more confidence.
Volume Confirmation for Stronger Signals: During a valid double top trading pattern, volume often decreases as the second peak forms and increases when the neckline breaks. This helps confirm the authenticity of the breakout and strengthens trade decisions.
Favorable Risk-Reward Ratio: Because the expected price drop is often equal to the pattern's height, the potential reward is typically larger than the initial risk. This can make the double-top pattern an attractive setup for risk-management-focused traders.
Disadvantages of a Double Top Pattern
Not Always Reliable (False Signals): Like any technical pattern, the double top can fail, leading to false breakouts. Prices may temporarily create two peaks but then continue upward instead of reversing.
Subjectivity in Pattern Recognition: Traders may interpret the double top pattern meaning differently based on variations in peak height, neckline positioning, or symmetry. This subjectivity can lead to inconsistent trade execution.
Variations Across Different Markets: Not all double top chart formations look the same. Some may have uneven peaks, wider time frames, or irregular structures, making setting precise entry and exit points harder.
Limited Profit Potential in Some Cases: While the projected price drop is based on the pattern's height, market conditions may prevent the price from reaching the expected target.
Final Thoughts: Why the Double Top Pattern Matters
The double top chart pattern is a bearish reversal signal that helps traders identify when an uptrend is losing momentum. So, traders, have you ever caught a double top trading pattern before a major price drop? Your experiences and strategies are valuable to the trading community. Share them in the comments and let's learn from each other!

EURUSD Weekly Reversal DUMPEURUSD potential pullback or complete dump to erase the week move.
Continuously decreasing Cumm.Delta
Divergent LL from high of day into LO Open
Imbalances on the Volume Profile leaving liquidity
Continuous trap candle formations
Bearish VWAP Break (Intraday)
Targeting the volume imbalance or completion of the retail breakout

GBP/JPY Sell Alert: Double Top Confirmation & Bearish Trend 📉 GBP/JPY Sell Trade Analysis
**Trade Setup Details:**
- **Sell Entry:** **189.500**
- **Stop Loss:** **Above 190.300**
- **Take Profit Targets:**
- **TP1:** **189.000** (+50 pips)
- **TP2:** **188.600** (+90 pips)
- **TP3:** **188.300** (final target, +120 pips)
- **Resistance Level:** **189.900**
#### **Technical Analysis Breakdown:**
1. **Double Top Pattern at 190.300:**
- This is a **bearish reversal pattern**, meaning the price tried to break above **190.300** twice but failed.
- It confirms a potential downtrend as sellers step in.
2. **EMA50 Trend Confirmation:**
- The price is moving **below EMA50**, which signals a strong **bearish trend**.
- This supports the idea that sellers are in control.
3. **Resistance Level at 189.900:**
- If price retests this level and **fails to break above**, it confirms further downside potential.
- If price **breaks above 190.300**, it invalidates the sell setup, and **risk management must be applied**.
#### ** Risk Management & Trade Execution:* *
- **Stop Loss Placement:** Above **190.300**, which is the double top resistance. If price breaks above this level, it indicates bullish momentum.
- **Risk-to-Reward Ratio (RRR):**
- TP1: **1:1** (Risk 50 pips for 50 pips gain)
- TP2: **1:1.8** (Risk 50 pips for 90 pips gain)
- TP3: **1:2.4** (Risk 50 pips for 120 pips gain)
### **Conclusion:**
This sell trade is based on a strong **bearish double top pattern** and **EMA50 trend confirmation**. The **189.900 resistance level** is key—if the price stays below it, the trade remains valid. However, if price **breaks 190.300**, it invalidates the setup, and stop-loss protection should be used.
**📊 Monitor price action, stick to your plan, and manage risk carefully!** 🚀🔥

Double Top Pattern – A bearish reversal signalThe Double Top is one of the most well-known bearish reversal patterns in technical analysis. It signals a potential trend change from bullish to bearish and can provide traders with strong shorting opportunities when confirmed.
How It Works:
1- Formation: The price reaches a resistance level twice, failing to break higher, creating two peaks at a similar level.
2- Neckline Break: After the second peak, the price falls to the previous support level (neckline). If this level is broken, it confirms the pattern.
3- Bearish Confirmation: A breakdown below the neckline often leads to a strong downward move, as buyers lose control and selling pressure increases.
Key Trading Strategy:
✅ Entry: Enter a short position once the neckline support is broken.
✅ Stop Loss: Set above the second peak to minimize risk.
✅ Profit Target: The expected price drop is usually the same distance as the height of the pattern (from peak to neckline).
In the chart above, we can see a clear Double Top formation in the NASDAQ 100. After failing twice at resistance, the price broke support, confirming a bearish trend reversal.

Price at a Crossroads: Will It Break or Drop?After a strong breakout from a falling wedge and handle pattern on Wednesday, Nov 6, 2024, price surged to an All-Time High of 109,358.01. However, a retracement followed, with the formation of a double top pattern leading to a breakdown below the neckline at 91,809.11, sending prices tumbling to 78,167.81, perfectly aligning with the golden ratio (50% Fibonacci level).
From there, buyers stepped in, pushing the price back up to the 38.2% Fibonacci level, but strong resistance led to two rejections and the formation of three consecutive doji candles, signalling market indecision.
What’s Next?
🔹 Bullish Scenario: A breakout above 38.2% could lead to a neckline retest 91,809.11.
🔹 Bearish Scenario: If rejection holds, the double top projection targets is 74,279.20, with further downside towards 61.8% or 66%, aligning with the daily trendline.
📢 Risk Management Reminder:
The market is at a critical level—manage your risk wisely! Set stop losses, use proper position sizing, and avoid over-leveraging. Patience and discipline are key!

BTC Scaling Strategy: Trade Like a Pro with Precision EntriesIf you’re new to trading, this guide will walk you through a scaling in and out strategy. We’ll cover:
Risk management – protecting your capital.
Entry points – how to build your position gradually.
Exit points – how to lock in profits while leaving room for further gains.
Maximising profit – using a small runner to capture additional upside.
By the end, you'll understand:
✅ How to enter trades at optimal levels
✅ How to take profits gradually
✅ How to manage risk so you don’t blow your account
BTC Market Analysis
Bitcoin has been trading in a tight range for over 100 days near the 100K mark. For 22 consecutive days, bulls have tried to break above 100K, but as the price nears this level, bears consistently rejected the move. Currently, BTC broke below our critical support level at 90K confirming a breakdown in market structure. Adding fuel to the bearish fire, Bitcoin has slipped below the weekly 21 EMA (89,503) and SMA (90,437). With the bears now in control, the critical question emerges: Where will Bitcoin find its next foothold? Let’s map the high-probability support zones and strategic entry points for the next potential long opportunity.
Using Fibonacci analysis:
Fib Speed Fan: With a low of 49K and an ATH of 109,588 (from March), the 0.618 trend line projects support between about 78K and 82K.
Anchored VWAP: When anchored from 49K, the VWAP support is around 81.7K.
Negative Fibonacci Retracement: From the ATH down to the current low at 91,231, the –0.618 level is at about 79,886.
Fib Extension & Retracement: Additional levels lie around 79,466 (1.618 extension) and 79,230 (0.5 retracement).
Moving Averages: The 233 EMA/SMA currently ranges between roughly 83K and 78.5K.
These indicators converge to form a robust support zone between approximately 83K and 78K. For a more detailed breakdown, please check my previous Bitcoin analysis, where I conducted a deeper examination.
Step 1: Understanding Risk Management (The Golden Rule)
Before placing a trade, you must decide:
📌 How much you’re willing to lose (risk per trade)
📌 Where you’ll enter and exit (never place a trade without a plan)
How Much Should You Risk?
Always risk no more than 1–2% of your total account on a single trade.
Example (for a $100K Account):
1% Risk = $1,000 max loss
2% Risk = $2,000 max loss
For this trade, we plan to risk about $1,366, which is approximately 1.37% of a $100K account. This disciplined approach protects your capital over the long run.
Step 2: Where Do We Enter the Trade? (Scaling In)
Instead of going all-in at one price, we break our $30,000 investment into 10 smaller entries and exits. This method reduces risk and often achieves a better average entry price.
💡 Why? Because no one can time the exact bottom! Spreading entries reduces risk and gets a better average entry price.
www.tradingview.com
BTC Buy (Entry) Levels
We will buy BTC as it falls from $83,050 down to $78,050 using the following allocation percentages:
Entry # Price (BTC) % of Position Amount Invested ($) BTC Acquired
1 83,050 5% $1,500 1,500 ÷ 83,050 = 0.018072
2 82,550 5% $1,500 1,500 ÷ 82,550 = 0.018181
3 82,050 5% $1,500 1,500 ÷ 82,050 = 0.018278
4 81,550 8% $2,400 2,400 ÷ 81,550 = 0.029430
5 81,050 8% $2,400 2,400 ÷ 81,050 = 0.029606
6 80,550 10% $3,000 3,000 ÷ 80,550 = 0.037234
7 80,050 12% $3,600 3,600 ÷ 80,050 = 0.044974
8 79,550 12% $3,600 3,600 ÷ 79,550 = 0.045275
9 79,050 15% $4,500 4,500 ÷ 79,050 = 0.056956
10 78,050 20% $6,000 6,000 ÷ 78,050 = 0.076352
Total Investment: $30,000
Total BTC Acquired:
0.018072 + 0.018181 + 0.018278 + 0.029430 + 0.029606 + 0.037234 + 0.044974 + 0.045275 + 0.056956 + 0.076352 ≈ 0.37436 BTC
Average Entry Price: $80,150
Stop Loss: Set at $76,500
Risk per BTC: $80,150 – $76,500 = $3,650
Total Risk: 0.37436 BTC × $3,650 ≈ $1,366 (~1.37% of $100K)
Step 3: Where Do We Exit the Trade? (Scaling Out)
We exit gradually as BTC rises between $86,950 and $91,450. The exit percentages are as follows:
Exit # Price (BTC) % of Position BTC Sold Proceeds ($)
1 86,950 5% 0.018718 0.018718 × 86,950 = $1,628.10
2 87,450 5% 0.018718 0.018718 × 87,450 = $1,637.03
3 87,950 8% 0.029949 0.029949 × 87,950 = $2,638.15
4 88,450 12% 0.044924 0.044924 × 88,450 = $3,976.39
5 88,950 14% 0.052420 0.052420 × 88,950 = $4,664.19
6 89,450 14% 0.052420 0.052420 × 89,450 = $4,691.19
7 89,950 12% 0.044924 0.044924 × 89,950 = $4,047.12
8 90,450 10% 0.037436 0.037436 × 90,450 = $3,388.20
9 90,950 5% 0.018718 0.018718 × 90,950 = $1,705.71
10 91,450 15% 0.056154 0.056154 × 91,450 = $5,137.68
Total BTC Sold: 0.018718×3 + 0.029949 + 0.044924×2 + 0.052420×2 + 0.037436 + 0.056154 = 0.374381 BTC (matches our total acquired ~0.37436 BTC)≈ $33,488.26
Profit on the Trade: Total Proceeds – Total Investment = $33,488.26 – $30,000 = +$3,488.26
Return on the Trade:
$3,488.26/$30,000×100≈11.63%
On Overall Account: For a $100K account, $3,488 represents a gain of about 3.49% if fully realised on this trade.
Risk-to-Reward Ratio: Risk = $1,366; Reward = $3,488; Ratio ≈ $3,488 / $1,366 ≈ 2.55:1
Step 4: Profit & Risk Summary
Metric – Per Trade - Based on $100K Account
Total Investment - $30,000 - $30,000 (30%)
Risk (Stop Loss) - $1,366 (4.6%) - $1,366(1.37%)
Profit (Closed) - $3,488 (11.63%) - $3,488 (3.49%)
Profit + Runner - $4,311.18 (14.37%) - $4,311.18 (4.31%)
Risk-to-Reward Ratio Calculation:
If Stop Loss Hits ($76,500):
Average Entry Price: $80,150
Loss per BTC: $80,150 – $76,500 = $3,650
Total Risk: 0.37436 BTC × $3,650 ≈ $1,366 (1.37% of a $100K account)
If BTC Reaches Our Exit Targets:
Total Proceeds: ≈ $33,488
Profit: $33,488 – $30,000 = $3,488
Profit Percentage on Trade: ~11.63%
Overall Account Impact: ~3.49% gain on a $100K account
Risk-to-Reward Ratio: ~2.55:1
Step 5: The Power of Scaling In & Out
Capital Protection: You risk only about $1,366 (1.37% of a $100K account), protecting your capital even during a series of losses.
Optimised Entry: Scaling in from $83,050 to $78,050 yields an average entry of about $80,150—significantly lower than the top price.
Profit Locking: Scaling out from $86,950 to $91,450 allows you to lock in profits at multiple levels, ensuring you capture gains along the way.
Healthy R:R: With a risk-to-reward ratio of approximately 2.55:1, your potential reward significantly outweighs your risk.
Discipline & Consistency: This structured approach minimises emotional trading and helps you stick to your plan.
Optional Note: While this guide fully closes the trade, leaving a small portion (15%) open (runner) is an option if BTC continues to rally.
Step 6: Final Pre-Trade Checklist
🔹 Support & Resistance: Is BTC trading near a strong support zone?
🔹 Technical Indicators: Is BTC holding above key moving averages (e.g., 21 EMA/SMA)?
🔹 Risk Management: Are you only risking 1–2% of your total account?
🔹 Trade Plan: Are you scaling in and out instead of going all-in? Are your entry levels and exit levels clearly defined?
🔹 Market Confirmation: Do volume, candlestick patterns, and order flow support your trade setup?
Conclusion
✅ We protect our money by limiting risk
✅ We enter trades gradually (scaling in)
✅ We take profits at multiple levels (scaling out)
✅ We fully close the trade or leave some BTC open to ride the trend higher
Final Tips:
Common Mistakes to Avoid
👉 Overleveraging – 10x leverage + 2% risk = 20% account risk!
👉 Ignoring Volatility – Tight stops on Bitcoin often trigger early exits.
👉 Never trade based on emotions. Stick to your plan, adhere strictly to your risk management rules, and let your disciplined strategy work in your favour.

DXY – Break or Bounce? Key Levels to WatchTVC:DXY
The DXY has broken below the 106.96 support, establishing a new fractal at 106.14 while testing the major April 2024 fractal resistance forged at 106.51. This price action leaves the dollar in a critical decision zone, with two main scenarios in play:
1️⃣ Bullish Scenario: If the dollar holds above the newly formed support and reclaims the daily fractal resistance at 107.38, it could trigger a recovery attempt, potentially leading to a retest of previous highs and the weekly fractal resistance.
2️⃣ Bearish Scenario: A failure to hold current levels could push the DXY below the emerging triangle structure, targeting the weekly fractal support at 105.42. A break below this level increases the probability of reaching the 200% Fibonacci extension at 104.59, where a bullish Crab pattern is projected in convergence —a critical area for potential trend reversals.
🔍 Key Technical Factors:
📌 Consolidation Triangle: DXY is stuck below the double top neckline but above the most recent fractal support forged at 106.14.
📌 Fibonacci Levels : The dollar is currently trading at the 38.2% Fibonacci retracement (106.35) , with projected harmonic patterns aligning near the next 50% retracement level.
📌 Liquidity & Stop Hunts: Multiple bullish harmonic patterns emerging just below the weekly fractal support indicate possible stop-hunting activity against short positions.
💡 Key Levels to Watch:
📈 Resistance Levels:
Weekly – 110.17
Daily – 107.38
4H – 106.65
Monthly – 106.51
📉 Support Levels:
4H – 106.17
Daily – 106.14
Weekly – 105.42
Monthly – 100.15
⚠️ Final Thoughts: DXY is at a crucial inflection point. A breakout above 107.38 could fuel a bullish move, while a breakdown below 105.42 may accelerate a bearish extension towards 104.59-104.78.
Until the price confirms direction, it is advisable to remain neutral and wait for a clear signal before committing to a directional bias.
Happy Trading,
André Cardoso
💡 Risk Warning: Trading financial assets carries a high level of risk and may result in the loss of all your capital. Make sure to fully understand the risks involved before you start trading and carefully consider your investment objectives, level of experience, and risk tolerance. The data and information provided in this content do not constitute financial or investment advice and should not be considered as such. Only invest what you can afford to lose, and be aware of the risks associated with trading financial assets.

$HPE – Potential Double Top Reversal in Play?NYSE:HPE
The stock is testing critical support at $20.55 , which serves as the neckline of a potential double top reversal pattern . The stock remains in a broader uptrend since March 2020, but the current price action is showing increasing downside pressure, putting this key level at risk.
🔹 Bearish Scenario – Breakdown in Focus:
A clear break below $20.55 could confirm the double top pattern, opening the door for a move toward $16.78, where the long-term ascending trendline from March 2020 aligns. This would represent a -18% decline and signal a potential shift in market structure.
🔹 Bullish Outlook:
As long as NYSE:HPE holds above $20.55, the uptrend remains valid. A bounce from this level could see price retesting resistances at $21.98, $24.24, and $24.66.
🔹 Resistance and Support Levels:
📉 Support: $20.55 (neckline), $20.34 (most recent fractal support), $15.77
📈 Resistance: $21.98, $24.24, $24.66
Happy Trading,
André Cardoso
💡 Risk Warning: Trading financial assets carries a high level of risk and may result in the loss of all your capital. Make sure to fully understand the risks involved before you start trading and carefully consider your investment objectives, level of experience, and risk tolerance. The data and information provided in this content do not constitute financial or investment advice and should not be considered as such. Only invest what you can afford to lose, and be aware of the risks associated with trading financial assets.

BTC Potential Drop to $72K: 3 Signs Indicating a Trend BreatherBitcoin has been on an incredible run, but I believe we may be heading for a pullback toward $72K. There are three key signs that suggest a breather is due:
Double Top Formation – We've seen a clear double top pattern forming, signaling a potential reversal.
RSI Divergence – The RSI is showing divergence from price action, often a sign that the momentum is weakening.
Overbought Conditions – Bitcoin has been in overbought territory for a while now, suggesting that a correction could be on the horizon.
Keep an eye on these factors as they could play a big role in where BTC goes next. Stay cautious and be prepared for potential volatility.
I hope you find it helpful!
Take care and keep it shiny.
Kina ♥

$BTCUSD Expansion or Reversal? Key Levels to WatchBITSTAMP:BTCUSD
Overview
We explore the key resistance and support levels, potential pattern formations, and what we should monitor in the coming sessions.
Bitcoin appears to be forming an expanding triangle within the broader range of its weekly fractals. Additionally, there is the potential emergence of a double top reversal pattern . This pattern has a critical support level at $89,164, which acts as a neckline. A breakdown below this support could threaten the weekly fractal support positioned at $91,530. If the breakdown confirms , Bitcoin may experience a significant decline, targeting the previously broken monthly fractal resistance at $73,794 , representing a potential 17% drop . This level coincides with the 200% Fibonacci extension, often seen as a default target for a double top reversal.
Despite the downside risks, a corrective move lower may provide a bullish setup. A key support level at $76,368 aligns with the 161.8% Fibonacci extension of the last bullish swing. A potential Bullish Deep Crab Pattern could form around this level, indicating a possible reversal. If Bitcoin reaches this zone, traders should monitor price reactions for signs of recovery.
Will Bitcoin break higher, or is a deeper correction on the horizon? Stay tuned for further updates!
Key Takeaways
Weekly Fractal Resistance: $109,359
Weekly Fractal Support: $91,530
Daily Fractal Resistance: $98,871 (rejecting 38.2% Fibonacci retracement at $98,314)
Daily Support: $93,340 (above weekly fractal support)
Critical Support Level: $89,164 (neckline for a potential double top)
Downside Target: $73,794 (previous monthly fractal resistance, aligning with 200% Fibonacci extension)
Bullish Reversal Zone: $76,368 (161.8% Fibonacci extension, potential Bullish Deep Crab Pattern)
It is important to remain neutral regarding bias unless the price confirms the pattern with a breakdown below the neckline. Until that happens, the market structure remains open to different scenarios, and traders should focus on confirmation signals rather than assumptions.
Happy Trading,
André Cardoso
Risk Warning: Trading financial assets carries a high level of risk and may result in the loss of all your capital. Make sure to fully understand the risks involved before you start trading and carefully consider your investment objectives, level of experience, and risk tolerance. The data and information provided in this content do not constitute financial or investment advice and should not be considered as such. Only invest what you can afford to lose, and be aware of the risks associated with trading financial assets.

Need Bear's Help to Push BTC HigherOnce this breaks below the double top neckline, bears will be pushing this down, below the neckline EVERYONE has been talking about, but the true test will be when it retests the neckline, as resistance. If it fails, then this double top has an 18% drop ahead, but nothing would be better than ripping it higher as bears become net buyers in a short squeeze that may finally help us break out above top of range, or at least tag it!

EURUSD DUMP Easily anticipating a lock for high of week. If not, I will cove to .055
Rapid 1.2.3 (i) (ii) (iii) on Monday's open running straight to previous week highs before bearish ChoCh, BOS and change in market structure.
LO premarket move anticipating to control risk with SL to BE targeting equilibrium or 50% retracement to open the week
***Unfortunately price is currently trading above VWAP. A strong high volume move across is required to validate the move***
-YungEmsi

#ID/USDT#ID
The price is moving in a descending channel on the 1-hour frame and is adhering to it well and is heading to break it upwards strongly and retest it
We have a bounce from the lower limit of the descending channel, this support is at a price of 0.3000
We have a downtrend on the RSI indicator that is about to break and retest, which supports the rise
We have a trend to stabilize above the moving average 100
Entry price 0.3322
First target 0.3156
Second target 0.3237
Third target 0.3322

Chart Patterns That Keep Showing Up (Are Traders Predictable?)In the grand theater of financial markets, traders often fancy themselves as rational actors, making decisions based on cold, hard data. Yet, time and again, their collective behavior etches familiar patterns onto price charts, as if choreographed by an unseen hand (the Invisible Hand?)
All across the world economy , markets trade in patterns. The trick is to spot those patterns before they unfold.
These recurring formations, known as chart patterns, are a testament to the predictability of human psychology in trading. Let's rediscover some of these enduring patterns, exploring why they persist and how you can leverage them.
🚿 The Head and Shoulders: More Than a Shampoo Brand
Imagine a market trend as a partygoer who's had one too many. Initially, they're lively (the left shoulder), then they reach peak status of euphoria (the head), but eventually, they slump with one last “let’s go party people” (the right shoulder). This sequence forms the Head and Shoulders pattern, signaling a trend reversal from bullish to bearish.
Traders spot this pattern by identifying three peaks: a central, higher peak flanked by two lower, similar-sized peaks on each side. The neckline, drawn by connecting the lows between these peaks, becomes the critical support level. A break below this line suggests the party's over, and it's time to exit or short the trading instrument.
Conversely, the Inverse Head and Shoulders indicates a reversal from bearish to bullish, resembling a person doing a headstand—a strong sign the market's ready to flip.
Ready to hunt down the charts for some Head and Shoulders? Try out the Head and Shoulders drawing tool .
⛰️ Double Tops and Bottoms: Déjà Vu in Trading
Ever experience déjà vu? The market does too, in the form of Double Tops and Bottoms. A Double Top resembles the letter "M," where the price hits a high, retreats, and then tests that high again before declining. It's the market's way of saying, "I've been here before, and I'm not going higher."
The Double Bottom, shaped like a "W," occurs when the price drops to a low, rebounds, and then retests that low before rising. It's akin to the market finding a sturdy trampoline at support levels, ready to bounce back.
These patterns reflect traders' reluctance to push prices beyond established highs or lows, leading to reversals.
⚠️ Triangles: The Market's Waiting Game
When traders are indecisive, prices often consolidate, forming Triangle patterns. These come in three flavors:
Ascending Triangle : Characterized by a flat upper resistance line and a rising lower support line. Buyers are gaining strength, repeatedly pushing prices up to a resistance level. A breakout above this resistance suggests bullish momentum.
Descending Triangle : Features a flat lower support line and a descending upper resistance line. Sellers are in control, and a break below support signals bearish continuation.
Symmetrical Triangle : Both support and resistance lines converge, indicating a standoff between buyers and sellers. The eventual breakout can go either way, and traders watch closely for directional cues.
Triangles epitomize the market's pause before a storm, as participants gather conviction for the next move.
Feel like looking for some triangles on charts? Jump straight to our easy-to-use Triangle Pattern drawing tool .
🏁 Flags and Pennants: The Market Takes a Breather
After a strong price movement, the market often needs a breather, leading to Flags and Pennants. These are short-term continuation patterns that indicate a brief consolidation before the trend resumes.
Flag : Resembles a parallelogram sloping against the prevailing trend. It's like the market catching its breath before sprinting again.
Pennant : Looks like a small symmetrical triangle that forms after a sharp move. Think of it as the market pitching a tent before continuing its journey.
Recognizing these patterns helps traders position themselves for the next leg of the trend.
🧠 The Psychology Behind Pattern Persistence
Why do these patterns keep appearing? The answer lies in human psychology. Traders, despite access to vast information, are influenced by emotions like fear and greed. This collective sentiment manifests in predictable ways, creating patterns on charts.
For instance, the Head and Shoulders pattern emerges because traders, after pushing prices to a peak, become cautious. Early sellers take profits, causing a dip. A second rally (the head) attracts more participants, but if it fails to sustain, confidence wanes, leading to a sell-off. The final attempt (right shoulder) lacks conviction, and once support breaks, the downtrend ensues.
Understanding the emotional drivers behind these patterns allows traders to anticipate moves and strategize accordingly.
🎯 Using Patterns to Your Advantage
While recognizing patterns is valuable, it's crucial to approach them with a discerning eye:
Confirmation is Key : Don't act on a pattern until it's confirmed. For example, in a Head and Shoulders, wait for a break below the neckline before taking a position.
Volume Matters : Volume often validates a pattern. A genuine breakout is usually accompanied by increased trading volume, indicating strong participation.
Contextual Awareness : Consider the broader market context. Patterns can yield false signals in volatile or news-driven environments.
Risk Management : Always set stop-loss orders to protect against unexpected moves. Patterns suggest probabilities, not certainties.
🧬 The Evolution of Patterns in Modern Markets
In today's algorithm-driven trading landscape, one might wonder if traditional chart patterns still hold relevance. Interestingly, even sophisticated trading algorithms (those used by hedge funds and investment managers) are programmed based on historical patterns and human behavior, perpetuating the cycle.
Moreover, as long as markets are driven by human participants, emotions will influence decisions, and patterns will emerge. The tools may evolve, but the underlying psychology remains constant.
🤗 Conclusion: Embrace the Predictability
In the volatile world of trading, chart patterns serve as a bridge between market psychology and price action. They offer insights into collective behavior, providing traders with a framework to anticipate movements.
By studying these recurring formations, traders can align their strategies with market sentiment, turning the predictability of human nature into a trading edge.
What’s your go-to technical analysis pattern? Are you and H&S trader or maybe you prefer to trade double tops? Share your approach in the comments!

EURCAD - Bearish Double TOPHello Traders !
The EURCAD price formed a double top pattern.
Currently, The neckline is broken !
So, I expect a bearish move📉
______________
TARGET: 1.47880🎯
