USDCAD Idea 9/14/2022***trade responsibly***
Nice double top formed on the 30 minute time frame. Looking for another tap into structure and will be looking for short opportunities to 1.31000
Double Top

USDJPY It will retrace to Support ZoneWelcome back! Let me know your thoughts in the comments!
**USDJPY - Listen to video!
We recommend that you keep this pair on your watchlist and enter when the entry criteria of your strategy is met.
Please support this idea with a LIKE and COMMENT if you find it useful and Click "Follow" on our profile if you'd like these trade ideas delivered straight to your email in the future.
Thanks for your continued support!
Brian & Kenya Horton, BK Forex Academy

USDCAD ShortAfter forming a double top and confirming a reversal to the short side with a break out of the trendline. I'm looking for short positions after a close below Support plotted and retesting creating resistance. Let me know what you think constructive criticism welcome!

Inflation is coming down. Will the markets now go up?Traders, talk about disinflation and a bull market seems contradictory. But is it? I'll explain why disinflationary indicators may mean we see the S&P at previous or even new highs going forward before we recede once again into a true bear market.

GOLD GREAT trading opportunity -13/9/2022-• Major potential double top on daily chart
• Double top at 2070 (2020 and 2022 highs)
• Neckline support at 1680 (2021 and 2022 lows)
• Very clear and typical bearish pattern
• Measurement method is distance between neckline and high of the pattern (2070-1680)
• Bears eye a break of the neckline support and a target projected at around 1300 (breakout point-distance)
• Bulls defending support at 1680, we already saw more than one failed attempt by bears to break that level
• Trading recommendation:
• Only sell on a clear and confirmed break of the neckline support. Increasing volume and consecutive daily closes below the support validate the pattern further more. Stop loss just above the line
• Buy as long as the support is not broken. Stop loss just below the line

USDCAD H4Hi traders, USDCAD is setting up for a downside move watch price action and look for short GOOD LUCK.

3800% growth for the #FET...Hello guys...
as you can see on chart, #fetusdt formed a sloping double top and target of this pattern is as high as height of head that mean price should touch $0.0315
on the other hand, on $0.03 area is on QML and lq bar that make this area super strength for starting bullish trend until $1.15.
it is excellent position
entry:0.0315
target: 1.15
always do your own research.
If you have any questions, you can write it in comments below, and I will answer them.
And please don't forget to support this idea with your like and comment.

EURCAD Here's the plan for this week!Welcome back! Let me know your thoughts in the comments!
**EURCAD - Listen to video!
We recommend that you keep this pair on your watchlist and enter when the entry criteria of your strategy is met.
Please support this idea with a LIKE and COMMENT if you find it useful and Click "Follow" on our profile if you'd like these trade ideas delivered straight to your email in the future.
Thanks for your continued support!
Brian & Kenya Horton, BK Forex Academy

SHORT, DOUBLE TOP?It looks like the overall trend wants to continue to the upside, but in order to do that it has to break through the double top thats forming. In the short term im going short. Coming down off the double top supported by the downward divergence on the RSI and stochastic. Looks like some easy pips short this next week.
FOLLOW FOR MORE TRADING IDEAS!

Double Tops & Bottoms - Advanced Analysis | EducationalNo chart pattern is more common in trading than the double bottom or double top. This pattern appears so often that it alone may serve as proof positive that price action is not as wildly random as many Traders claim. Price charts simply express trader sentiments, demand, and supply, so the double tops and double bottoms represent a retesting of temporary extremes. If prices were truly random, why do they pause so frequently at just those points? To traders, the answer is that many participants are making their stand at those clearly demarcated levels.
1. Double Tops
Double tops are a bearish pattern commonly found in uptrends and characterized by two consecutive peaks located at an approximately similar level, separated by a trough.
Here we can see a good example of a Double Top in GBP/USD in August 2022, in the recent past.
The Price forms a "V shape" as a Double Top, then there is a breakout of the confirmation Line, we can call this also a " Neckline " for a continuation of the price.
2. Double Bottoms
Double bottoms are a bullish pattern commonly found in downtrends and characterized by two consecutive troughs located at an approximately similar level, separated by a peak.
The Double Bottom is always formed by a V shape, the figure it's just a Mirrored shape of the Double Top. Also for the Double Bottom, there is a breakout confirmation Line.
3. Take Profits
For double tops, the take profit is determined from the height Peak to the trough. This measurement will be copied from the confirmation line ( breakout )to below.
For double bottoms, the take profit is determined from the lowest trough to the peak. This measurement will be copied from the confirmation line ( breakout ) to the upper.r.

EUR-GBP Short From Resistance! Sell!
Hello,Traders!
EUR-GBP has retested the horizontal resistance
Then the pair has formed a double-top pattern
And went down which makes me
Locally bearish biased and I think
That a move down is ahead
b]Sell!
Like, comment and subscribe to boost your trading!
See other ideas below too!

GBPUSD - Bullish inverted Head and Shoulders 🚀The GBPUSD price is in Weekly Support level and in Bullish Inverted Head and Shoulders Pattern🧐
the key level is broken ✔
the descending channel is broken ✔
so, i predict a bearish move 📉
TARGET: 1.19948 🎯
...
if you agreed with this IDEA, please leave a LIKE, SUBSCRIBE or COMMENT!

GBP/JPY Short Hi Guys,
I'm looking to take this short on GJ.
We have currently witness price print a perfect double top at a strong level of supply / resistance
Price has now broken through support which we are anticipating to act as resistance
We are now waiting for our entry which could either be a depletion of buying pressure and a new presence of selling pressure (wick rejections / bearish candlestick pattern)
This is near enough a perfect set-up but nothing is guaranteed.
This is where patience is vital.
Let me know what you guys think?

USDCHF H1Hi traders, USDCHF..... the down side scenario. upside is still possible so trade with your according strategy GOOD LUCK.

USDCAD POSSIBLE MOVE H1Hi traders, My point of view for the USDCAD. watch price action and look for short GOOD LUCK.

EURUSD - BEARISH HEAD AND SHOULDERS 📉The EURUSD price is in Head And Shoulders Pattern 🧐
the Neckline is broken ✔
so, i predict a bearish move 📉
TARGET: 0.97767 🎯
...
if you agreed with this IDEA, please leave a LIKE, SUBSCRIBE or COMMENT!

ASX BEARISHASX monthly chart with SMA 11, 13, 15. Price chart removed.
Looks like 2008 and 2020.
Sidenote Australia raised interest rates today.
Additionally, notice the double top.

Tata Consumer Product Ltd . The beauty of Trend & PatternsThe idea here is about :Tata Consumer Product Ltd.
I thought of publishing this to show the beauty of how the trend is interconnected with harmonic, wave patterns & market sentiments.
Below are the points taken from the chart:
1. On 15th September 2021 downtrend channel begins & till 16th November 2021 chart completes double top & Bearish ABCDE pattern.
2. From 16th November 2021 till 20th December 2021 price sees a downtrend breaking the previous support zone.
3. From 20th December 2021 till 14th January 2022 price retraces but gets rejected from the previous support zone which is now become a resistance zone.
4. From 14th January 2022 till 7th March 2022 price continues in the downtrend direction forming a falling wedge pattern.
5. From 7th March 2022 till 2nd May 2022 price moves in the opposite direction of the downtrend and breaks the downtrend channel. I see it as over brought zone. Price couldn’t keep the upward momentum & again gets back in the downtrend channel from 4th May 2022 till 26th May 2022 and tests the newly formed support zone.
6. From 26th May 2022 to 7th July 2022 price tries to break the downtrend and forms a ascending triangle, price breaks the downtrend successfully on 8th July 2022. This is a clean break out of the downtrend channel.
7. 8th till 14th July 2022 price retests the downtrend and confirms a upward momentum.
8. From 12th July 2022 till 12th August 2022 price completes shark pattern.
9. Shark Pattern: The shark candlestick pattern is a new harmonic chart pattern discovered in 2011 by Scott Carney that indicates a trend reversal possibility.
Entry, stop loss & Exit targets are provided for understanding the shark pattern on the chart.
As traders we cannot foresee things clearly until certain points are established on chart. Therefore it is always better to have patience and wait for clear signals before we make our move in the market.
One should always swim along with the market instead of hopping on and off at the wrong time.
Disclaimer: “The above is an Educational idea only and not any kind of financial or investment advice. So please do your own DD (Due Diligence) before any kind of investment”.
Do you like my TA & ideas!!
Want to keep yourself updated with current market action? Then don’t forget boost & to subscribe for more analysis. Do leave your valuable feedback & comments for any improvisations.
Cheers.

USDCHF to sell soon?Using the three drives pattern, we can consider that the leg C has been reached (0.618 fib ratio of the entire pattern). This means that buyers are exhausted, reaching a great resistance zone for confluence on the D1.
Here we observe RSI bearish divergences on H4 and H1, with a double top pattern.
Wait for a big candle close below the neckline for more confirmation.
Good luck everyone,
Joe.

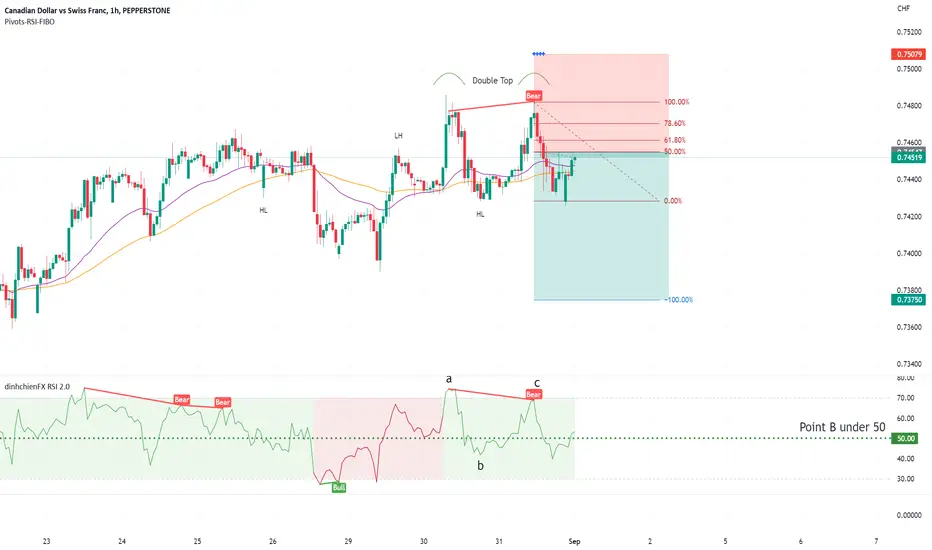
CADCHF - BEARISH MOVE! 📉📉
The CADCHF price is in Daily Support Level and Ascending channel🧐
the Ascending channel is broken ✔ the key level is broken ✔
so, i predict a bearish move 📉
TARGET: 0.73350 🎯
...
if you agreed with this IDEA, please leave a LIKE, SUBSCRIBE or COMMENT!

TEZOS (XTZ)... is bearish in long termhello guys!
xtz formed a double top pattern and target of this pattern is on $0.5 almost and i just recommend you give short position in each retrace...
always do your own research.
If you have any questions, you can write it in comments below, and I will answer them.
And please don't forget to support this idea with your like and comment.
BE PROFITABLE

ETH bearish flag#ETH/USDT
#update
$ETH had a pullback to the resistance zone and shaped double top and bearish flag pattern.
🐻 so I think it's more likely that price break down from the lower line of the flag and continue its downtrend toward $1400 and touch the lower trend line.

CADCHF - RSI Divergence & Double Top 9/1/20221. Real Divergence RSI:
- Point A is at overbought 70.
- Point B is the most important:
... Higher Low (HL) crosses under 2 EMAS: 34-89.
... RSI: B point crosses under 50.
- Point C: Higher High but not higher RSI overbought (70).
2. Double Top: