NAS100USD on a double top 🦐NASDAQ on the 4h chart after the recent bullish impulse create a double top below a daily resistance.
The price at this stage couldn't break above and after the double test of the structure is moving for a 2nd test of the support area.
How can we approach this scenario?
We will wait for a break of the support and if that will happen i will search for the Plancton academy rules to set a nice short order.
–––––
Follow the Shrimp 🦐
Keep in mind.
🟣 Purple structure -> Monthly structure.
🔴 Red structure -> Weekly structure.
🔵 Blue structure -> Daily structure.
🟡 Yellow structure -> 4h structure.
⚫️ Black structure -> <4h structure.
Here is the Plancton0618 technical analysis , please comment below if you have any question.
The ENTRY in the market will be taken only if the condition of the Plancton0618 strategy will trigger.
Double Top


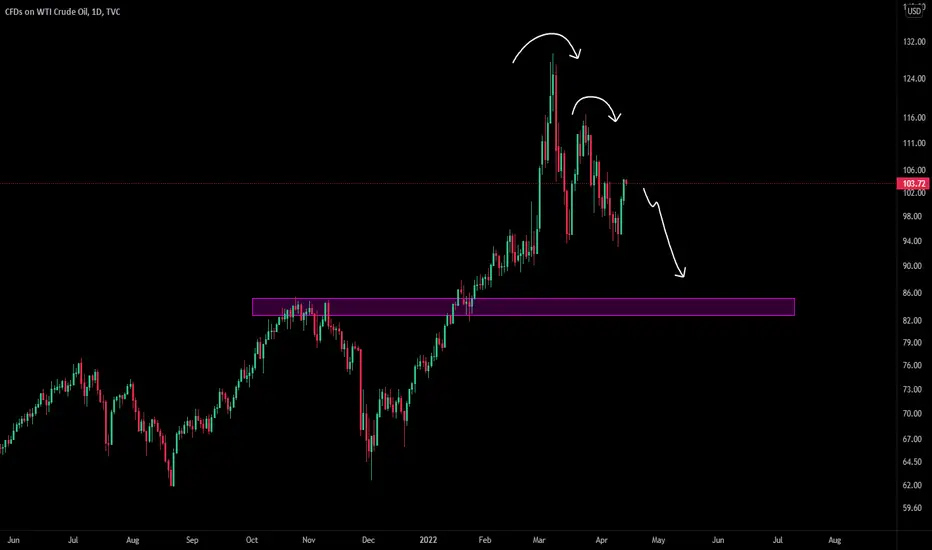
Short on USOILNot sure but I think probably this is the top for USOIL, looks like bearish formation and dead cat bounce.
Silver - Doubletop and Fibo trade !!Hello trader,
good mood and profitable deals! 💲
Silver
1D chart
double top
Fibonacci
SMA EMA200
Silver stoped the downside with a nice Doubletop at 21,429 and the IMO is supported by the SMA and EMA200.
The first goal is around 29 (The goal of the double top)
EMA 200 or corrections in LTF can be used as entries. The goals can be seen in the chart !!
Even if I favor an upward movement, we could also go sideways. This is possible from 3 points, confirmed from 5!
SL is below the current low.
I would like to mention that all I post are just options and my own opinion!
Always trade with SL, and do not risk more than 1% of your portfolio (max 3%) per trade.
➡️If you like my posts smash the like👍👍 button, comment or follow me.⬅️
Thanks for reading my ideas!

🚀🚀🚀 XRP what's next? Very large VOLUMES! 🚀🚀🚀Hello everyone,
Unfortunately, we haven't seen a breakout of the trend line, what next?
There are several scenarios. I personally took a position at $ 0.69 on a LONG with a stop loss below the local low. I'm counting on another breakthrough attempt.
The main resistances are marked with a dashed green line. The close of the candle below the red line (resistance) will mark a descent to the last key position for XRP $ 0.55.
This week you can see large VOLUMES, which positively indicates a rebound in the price.
We also have divergences on the RSI. Increasingly higher, lows on the chart and decreasing ones on the indicator indicate a bearish.
Higher lows and vice versa on the RSI speak of a bullish move. So we have an unclear situation.
One thing is that we stopped at substantial support. Breaking it will create a medium-term doubletop, and then only a continuation of declines.
From the fresh news regarding the SEC vs XRP case.
Ripple took another victory over the Securities Commission.
The judge rejected another SEC request that was intentionally delaying the end of the case.
As a result, the re-introduction of XRP to the market may be faster than expected.
Comment and like,
Regards

USDCAD - BEARISH MOVE 📉📉
the USDCAD price reached the resistance level ,
the neckline is broken 🔥 so, i predict a bearish move 📉
TARGET: 1.25061 🎯
if you agreed with this IDEA, please leave a LIKE, SUBSCRIBE or COMMENT!

$ 28,000: the most vital support of BitcoinFrom December 2020, we can see the formation of two patterns of head and shoulders and a double top.
The important point is that the neckline of all these patterns will be around $ 28,000. Bitcoin has repeatedly been supported by this line since December 2020. I think it will touch this support line again. But in the event of a breakdown of this support line, Bitcoin may experience a much sharper decline

26,500 USDT: the most vital support of Bitcoin From December 2020, we can see the formation of two patterns of head and shoulders and a double top.
The important point is that the neckline of all these patterns will be around 26500 USDT. Bitcoin has repeatedly been supported by this line since December 2020. I think it will touch this support line again. But in the event of a breakdown of this support line, Bitcoin may experience a much sharper decline

BTC ascending triangle or double top ?Waiting for the answer.
Since this morning we have some small bull divergence on 1hour. But no break.

ADA falls to the edge of cup after forming a DOUBLE TOP patternAfter forming the cup and handle pattern, ADA experienced rapid growth and then created a DOUBLE TOP pattern at 1.25. Based on the classic TA, I expect a 10% drop from the bottom of M pattern(0.236 fib) and a drop to $1 KEY ZONE. Also according to Ichimoku, Cardano's most important support is in the $1 zone. The $ 1 zone also shows the DC Channel midline which is an important line to maintain the uptrend.
Then, in the mid term, I expect the price to rise to 1.25 due to the Hard fork Vasil, which will be released in June. Today, roadmap.cardano published the following sentence:
Finally, they continued preparing for the Vasil hard fork in June.


NASDAQ Double TopDouble top pattern formed on the OANDA:NAS100USD
If the price falls bellow the neckline, you can be fairly certain that the price will continue to fall. If the neckline holds, I will shift my recommendation to a buy rating.

SHORT PROJECTION IN XRP - UNCOMPLICATED PRICE ACTIONTechnical analysis regarding the price of XRP in relation of dollar Tether for the next scenarios, based on daily movement.
disclaimer
*** In accordance with CVM Instruction No. 598, of May 3, 2018, Art. 21, I declare that the recommendations of this analysis reflect solely and exclusively my personal opinions and perceptions and that they were prepared independently and autonomously. Not being considered a purchase and/or sale recommendation. ***
Any questions do not hesitate to contact me. I'm happy to be able to help you in the best way I can. 🙏

ADA exits the ascending channel to the $1 KEY POINTFollowing the negative news published by the Federal Reserve and due to their anti inflationary policy, it is likely that short-term prices will fall in the markets. Technically, ADA has started a downtrend after forming the DOUBLE TOP pattern at 1.25 and exited its ascending channel. probably supply will continue because the trading volume has not increased significantly at current prices. After the weak support of 1.08, I expect the bearish rally continue to the key range of $1. If macroeconomic conditions worsen, the price of 0.930, which is at 0.618 Fibonacci, is the most important support for ADA.

Reliance forming inverted flagAfter double top break down Reliance is forming inverted flag. Good chance for short position,keep looking.

AUDJPY DOUBLE TOPAUDJPY price has just hit very significant resistance and is showing signs of a perfect double top, price has also closed past the short consolidation period at the top of resistance on the 15m chart so we are all ago for a bear move

USDCAD for a new low 🦐USDCAD on the daily after the double top is testing a weekly support.
The market attempted to break the 0.618 weekly Fibonacci level with 2 false breakouts and moved lower to the support structure.
After a series of red candles, we can expect anyway some retracement to the upside before a possible break.
How can we approach this scenario?
I will wait for a potential break of the structure and in that case i ll move to the 4h chart.
On that timeframe, i will check for an entry point according to Plancton's strategy rules and set a nice short order.
--––
Follow the Shrimp 🦐
Keep in mind.
🟣 Purple structure -> Monthly structure.
🔴 Red structure -> Weekly structure.
🔵 Blue structure -> Daily structure.
🟡 Yellow structure -> 4h structure.
⚫️ Black structure -> <4h structure.
Here is the Plancton0618 technical analysis , please comment below if you have any question.
The ENTRY in the market will be taken only if the condition of the Plancton0618 strategy will trigger

LUNAUSDT is testing the 0.618 Fibonacci LevelThe price created a double top at 97$ on ATH, and after the rejection, the price is testing the 0.382 Fibonacci level.
On the 4h timeframe, the price had a breakout from the bullflag and now the market is going to test the 0.618 Fibonacci resistance
How to approach?
The price needs to create a new breakout with confirmations and a new Higher high.
In that case we could apply our rules for a new long position
–––––
Follow the Shrimp 🦐
Keep in mind.
🟣 Purple structure -> Monthly structure.
🔴 Red structure -> Weekly structure.
🔵 Blue structure -> Daily structure.
🟡 Yellow structure -> 4h structure.

Gold A or BLooking at weekly gold chart, we might have a choice to believe that either it's going up or down.
Some says, the cup and handle pattern has almost carried out in the big picture, plus the double bottom has just completed and the neck line testing is undergoes . Whilst, other may say the double top is dominant as the war is tentatively near the end supporting by the fact that gold is slowly loosing it's "store of wealth" over the industrial usages such as IC conductor or other electronic utilizations including the uprising mighty Bitcoin and it's booming hodlers.
Time is our friend, let gold be itself and once we come across the choice to believe in our idea today, when we look back to this post in the future, I believe that the history will tell you if you were right or wrong with the further logical reasons to enlighten your trading strategies in the future's future.

TopsWe can see a double top at resistance level
After a big rally there can be a retracement move let's wait & watch
👍 👍

NZDCAD on a double top at the 0.618 🦐NZDCAD on the daily chart after the recent lows retraced exactly at the 0.618 Fibonacci level near to the 0.88 level.
The market ended up creating a perfect double top and is currently testing a weekly support.
How can we approach this scenario?
Being both the double top and the 0.618 potential reversal point we will wait for a possible break below the support area and in that case we will move on the 4h timeframe to check for a possible entry point.
According to Plancton's strategy if the conditions will be satisfied we will set a nice short order.
----
Follow the Shrimp 🦐
Keep in mind.
🟣 Purple structure -> Monthly structure.
🔴 Red structure -> Weekly structure.
🔵 Blue structure -> Daily structure.
🟡 Yellow structure -> 4h structure.
⚫️ Black structure -> >4h structure.
Here is the Plancton0618 technical analysis , please comment below if you have any question.
The ENTRY in the market will be taken only if the condition of the Plancton0618 strategy will trigger

AUDCAD SHORT IDEAHaving formed a double top and bsl taken out,i expect this pair to fall and take out that previous daily support

Waves USDT Looks Topped. Bearish reversal Is expected OKEX:WAVESUSDT rallied past few weeks after a long accumulation without any healthy correction on the HTF structure .
Looking back into the data it looks like reaching to new potential higher high and make a reversal. As for now indicators are giving mix signals and turning into bearish bias as the rally stalls above at the (EQ) Equal highs- 4h chart shows rectangle at the top which may turn into distribution since RSI is slowing turning bearish and the momentum is losing its strength .. Waves may provide a very nice entry very soon..
Never trade without a stop loss.
never risk more than 5% of capital on a single trade.
happy trading
