BITCOIN (BTCUSD): Recovery Starts
Bitcoin is going to rise from a key daily support.
After a liquidity grab, the market shows a clear strength,
forming a double bottom on an hourly time frame.
I expect a bullish movement at least to 117100
❤️Please, support my work with like, thank you!❤️
I am part of Trade Nation's Influencer program and receive a monthly fee for using their TradingView charts in my analysis.
Double Top or Bottom

S&P 500 (CASH500) - Double Top H1Risk/reward = 2.7
Entry price = 6388.4
Stop loss price = 6399.7
Take profit level 1 (50%) = 6360.4
Take profit level 2 (50%) = 6352
Also, waiting on confirmation on some variables

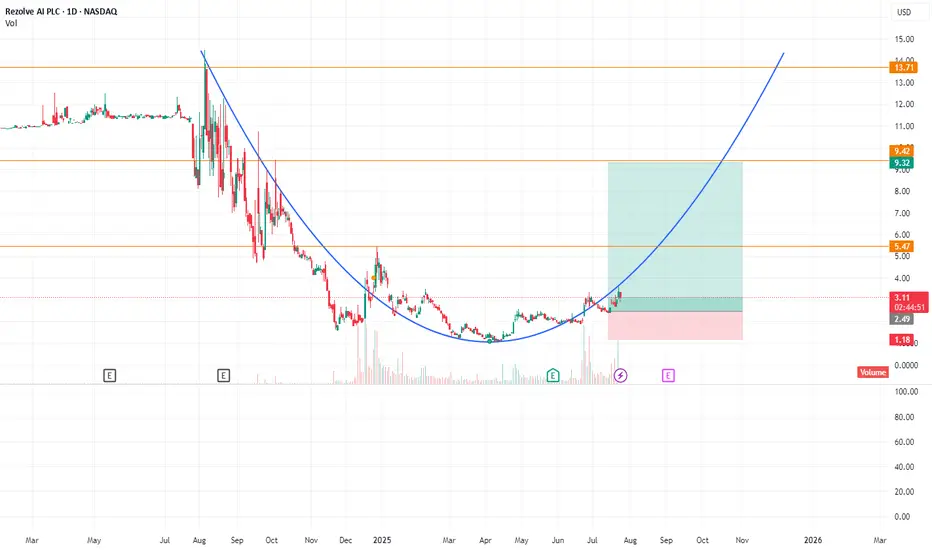
RZLV formed round bottomBusiness Model: AI SaaS for retail—mobile-first, gen‑AI conversational commerce and checkout.
Financials: Very low revenue base, heavily loss-making, but building enterprise footprint and usage.
Balance Sheet: Strengthened via equity conversions, debt facility, and capital raises; dilution risk remains.
Traction: Growing client deployments across major brands; usage and GMV accelerating in 2025.
Leadership: Experienced team, led by a founder-CEO and a seasoned global CTO/product head drawn from tech‑commerce backgrounds.
Despite minimal current revenue, Rezolve AI is betting on rapid scaling through partnerships with Microsoft, Google, and enterprise clients. Execution and monetization in 2025 will be pivotal to its valuation trajectory.
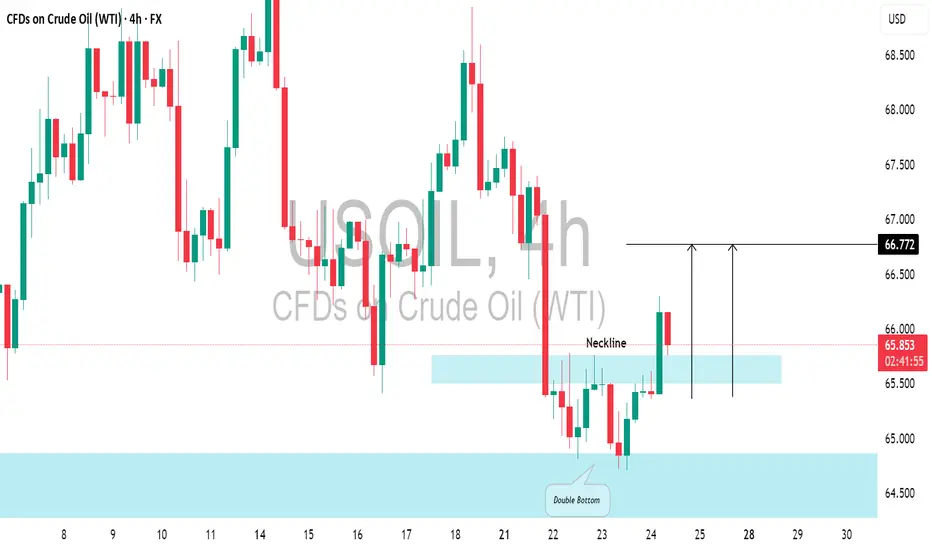
US CRUDE OIL (WTI): Pullback From Support📈USOIL responded well to the highlighted daily support level.
The price formed a double bottom pattern on that and broke above its neckline.
There's a strong likelihood that the price will continue to increase and reach 66.72 shortly.
EURCAD: Bearish After the News 🇪🇺🇨🇦
EURCAD may drop from a solid daily resistance.
As a confirmation signal, I spotted a bearish engulfing candle
on a 4H time frame after its test.
The formation of this candle is accompanied by multiple negative
German fundamentals.
Goal - 1.5976
❤️Please, support my work with like, thank you!❤️
I am part of Trade Nation's Influencer program and receive a monthly fee for using their TradingView charts in my analysis.

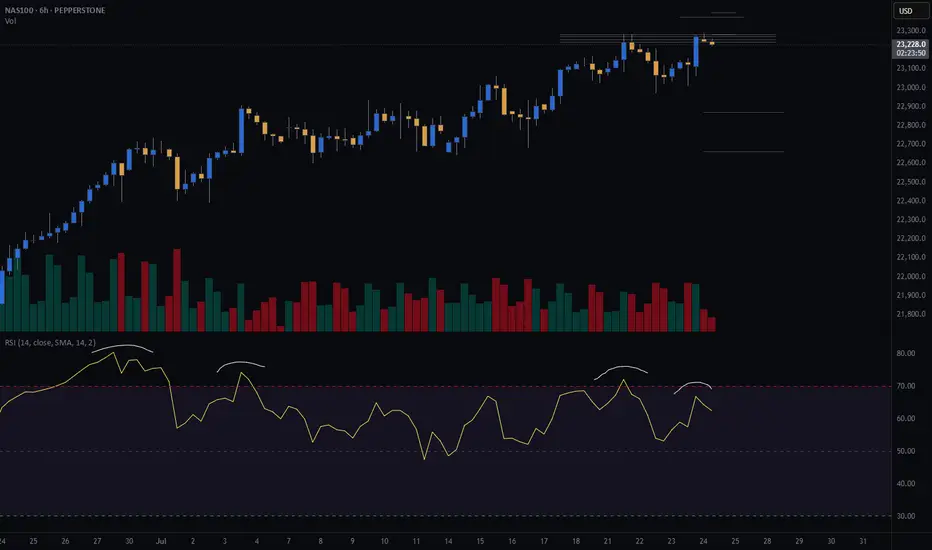
NASDAQ (CASH100) SHORT - double top H6Risk/reward = 4.3
Entry price = 23 282
Stop loss price = 23 398
Take profit level 1 (50%) = 22 871
Take profit level 2 (50%) = 22 663
If current H6 goes back into range, I will open short position.
All variables on checklist have been met.
I was out last night so I missed my initial entry. Hoping for a second chance.
Hopefully this short works because the last few higher time frame short setups have failed, although because of exit plan I have made very little losses.
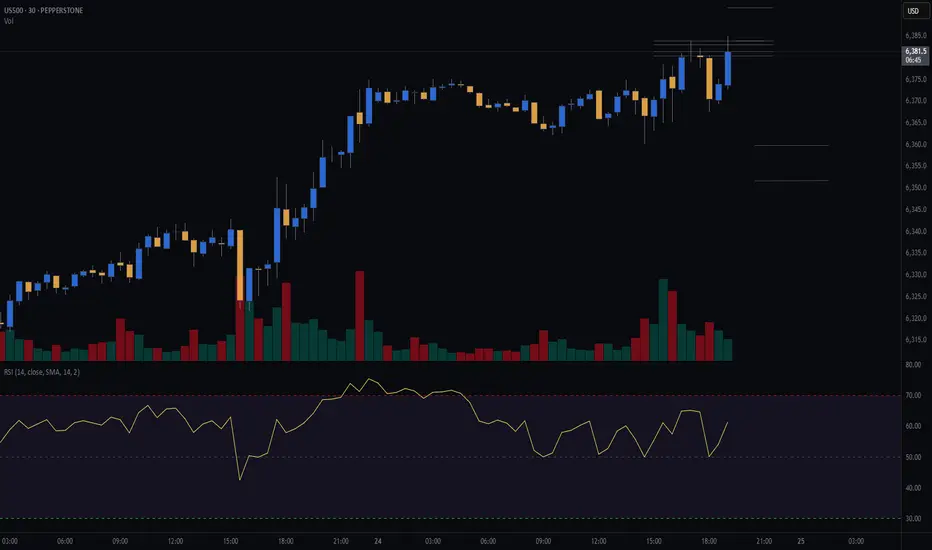
S&P (CASH500) SHORT - Double top 30minRisk/reward = 2.7
Entry price = 6384
Stop loss price = 6393.8
Take profit level 1 (50%) = 6359.8
Take profit level 2 (50%) = 6351.8
Will get confirmation of remaining variables at close of this 30min candle at 19.30.
LONG ON GBP/AUDGA has given us a CHOC (change of character) to the upside after making a new low.
Price has since pulled back to the demand area that created that change leaving us with a possible double bottom forming.
I expect GA to rise to sweep buy side liquidity at the equal highs then reaching the previous supply level / previous High.
Looking to catch 200-300 pips.

S&P 500 (CASH 500) SHORT - Double top H8Risk/reward = 4.1
Entry price = 6343.3
Stop loss price = 6365.3
Take profit level 1 (50%) = 6268.1
Take profit level 2 (50%) = 6232.1
Still waiting on some variables on checklist to be confirmed before I enter the trade.

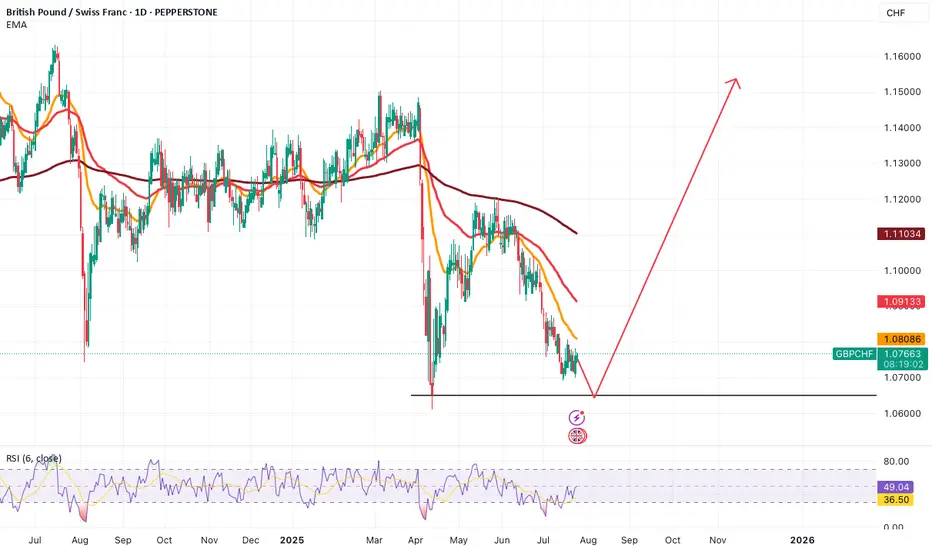
GBPCHF Forming Double BottomGBPCHF seems to be forming a visible double bottom.
The second bottom has to still form, we are waiting for that.
If the second bottom does form, we'll be looking for buys.
GBPUSD Traders Beware: A Major Drop Could Be ComingThe classic rule says what doesn’t go up must come down. After a failed breakout at 1.3439, GBPUSD is struggling. With longs sitting on big gains from January’s low, a drop toward 1.3361 or even lower looks likely. Watch this key level now.
This content is not directed to residents of the EU or UK. Any opinions, news, research, analyses, prices or other information contained on this website is provided as general market commentary and does not constitute investment advice. ThinkMarkets will not accept liability for any loss or damage including, without limitation, to any loss of profit which may arise directly or indirectly from use of or reliance on such information.

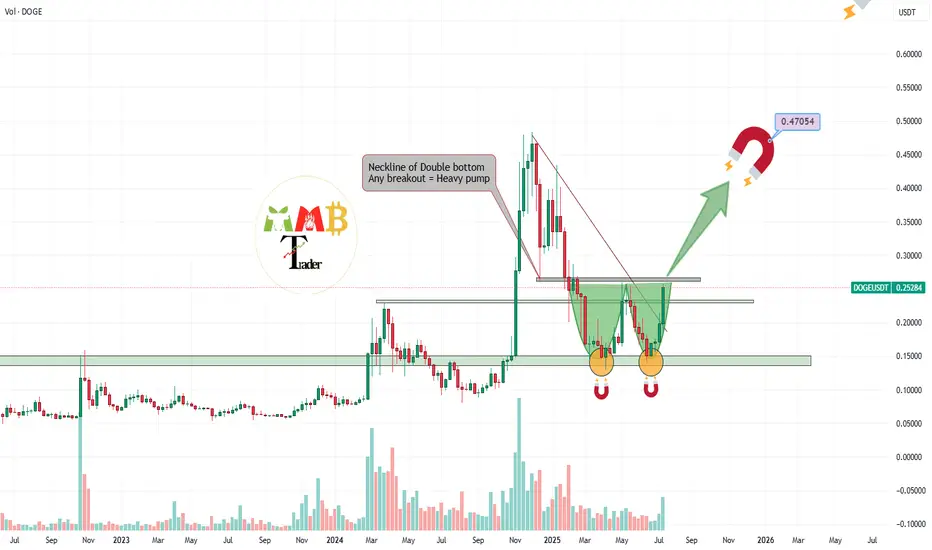
DOGEUSDT double bottom pattern or my Magnet pattern???So many of Traders around the world sees weekly Strong reversal pattern which is double Bottom and they are waiting for breakout of neckline which is last major resistance of 0.26$ and i think soon it can break the resistance and heavy pump ahead after breakout is expected.
But you may be wrong the upcoming pump here is due to my magnets on chart.
find them all and see how it pump price.
Who finds all targets for BINANCE:DOGEUSDT ?
But remember and never forget this was not
DISCLAIMER: ((trade based on your own decision))
<<press like👍 if you enjoy💚
AGTL is at good buying priceAGTL is at a good buying price, a partial entry may be taken today, and remaining on the breakout.

SET
Apil 2025 since the price is oversold from Feb2025 price still drop contrary with momentum
BigBlack candle followed by exhaustion gap at exactly the end of wave 5 of C
Pattern Double Bottom, Island Reversal
Be careful with the false break out at 1,250. Look closly at the momentum
Around 1,100 is a good buy zone and I do think once it break 1,250 or 1,300 price will never come back to 1,100 again.

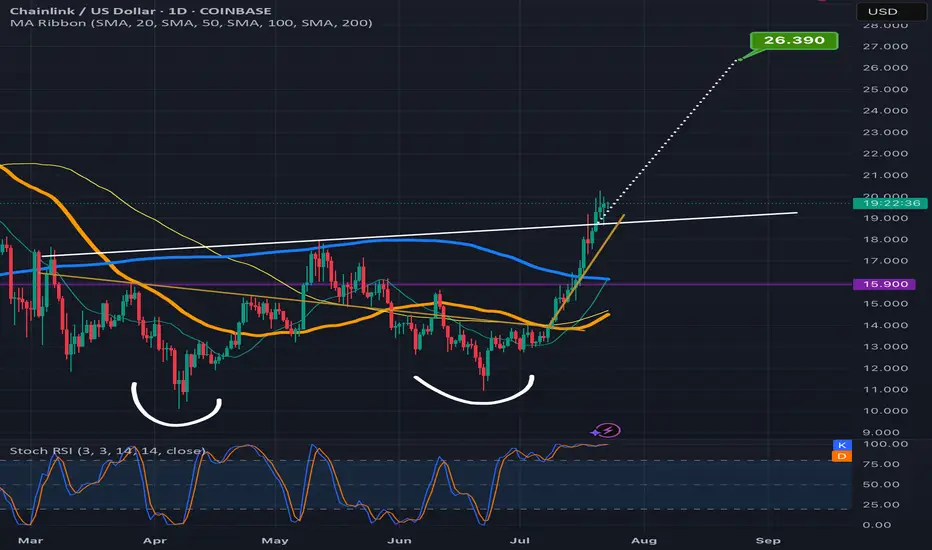
Chainlink climbing the measured move line staircaseLooks like Chanlink is ready to confirm the double bottom breakout here as the past few candles have already started to climb up the measured move line like a staircase.Always possible for a dip back below the neckline at this point but probability slightly favors the readout being validated instead for now. *not financial advice*
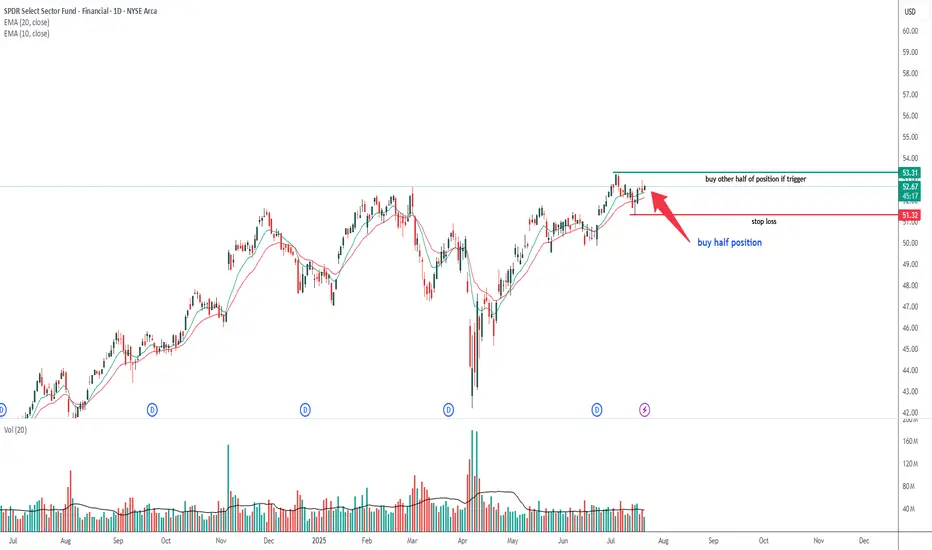
XLF -- Possible trade opportunityXLF -- Possible trade opportunity based of price, volume and chart pattern
GBP/JPY WIN📈 VMS Strategy – GBP/JPY Triple Top Win
Another clean triple top reversal, this time on GBP/JPY, using the VMS strategy.
This trade checked every box:
✅ Clear triple top structure
✅ Strong engulfing candle
✅ Volume + momentum aligned perfectly
✅ Entry near the 50EMA with patience and confirmation
Price made a solid move in our favor and hit the profit target earlier this morning.
If you’re finding value in the VMS system, consider sharing it with someone who needs structure, patience, and a real edge.
📌 The trade either fits the rules—or it doesn’t. That’s what makes this work.

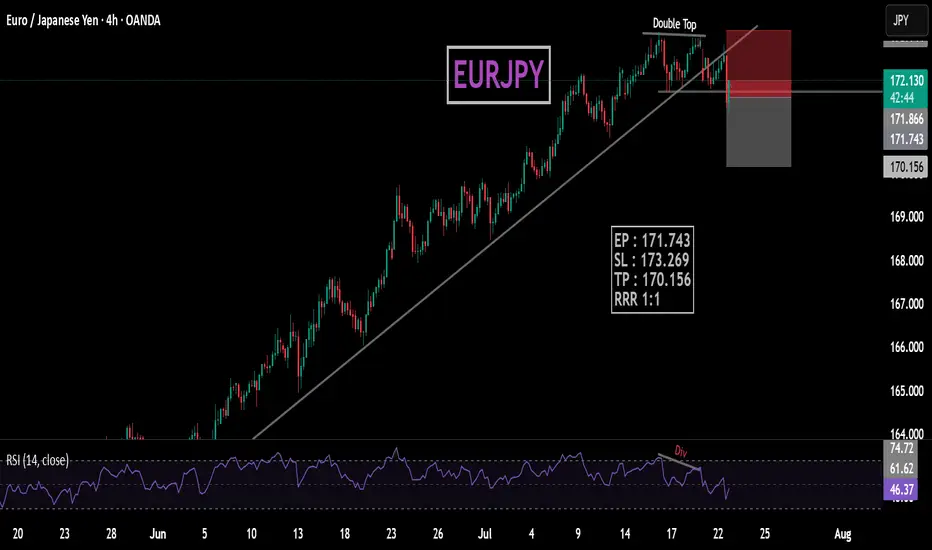
EURJPYDouble top with rsi bearish Divergence also bulish trendline beark.
EP : 171.743
SL : 173.269
TP : 170.156
RRR 1:1
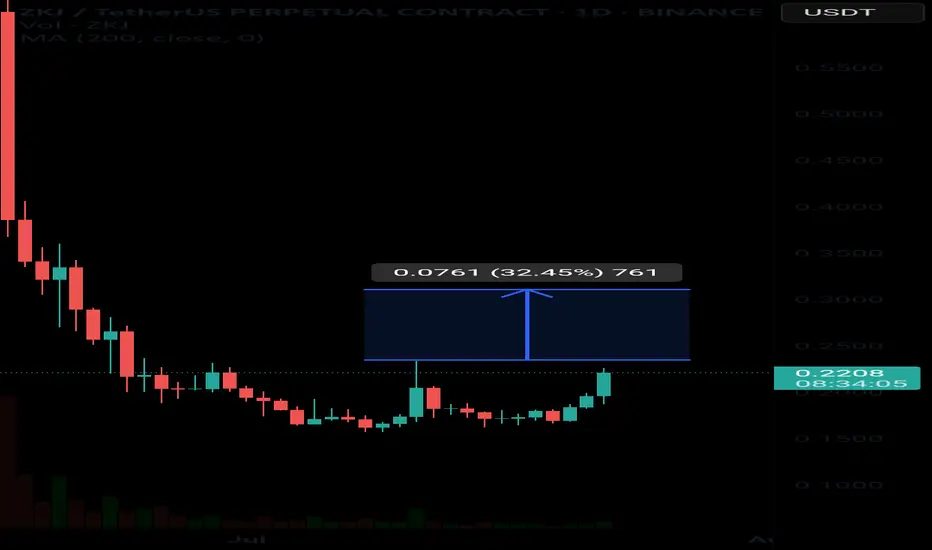
UpdateThe price action is unfolding as expected. After a major drop, we've now formed a higher low, which also completes a double bottom pattern — a classic bullish reversal signal.
- If the price breaks above the key resistance at 0.2350, it could confirm the double bottom.
- A successful breakout may open the path toward the next major target at 0.3100.
The Kiss of Death Trade & Other Reasons for EntryFollowing up on the 2618 opportunity that we looked at on the FOREXCOM:GER40 this past weekend the market has now created more potential trading opportunities to get involved.
1) A bullish bat pattern that has completed due to a result of a complex pullback into the original double bottom.
2) A potential Kiss of Death trading opportunity
3) A bigger potential bullish gartley pattern IF the current 2618 opportunity is violated.
Please leave any questions or comments below & feel free to share your opinion on the setup.
Akil

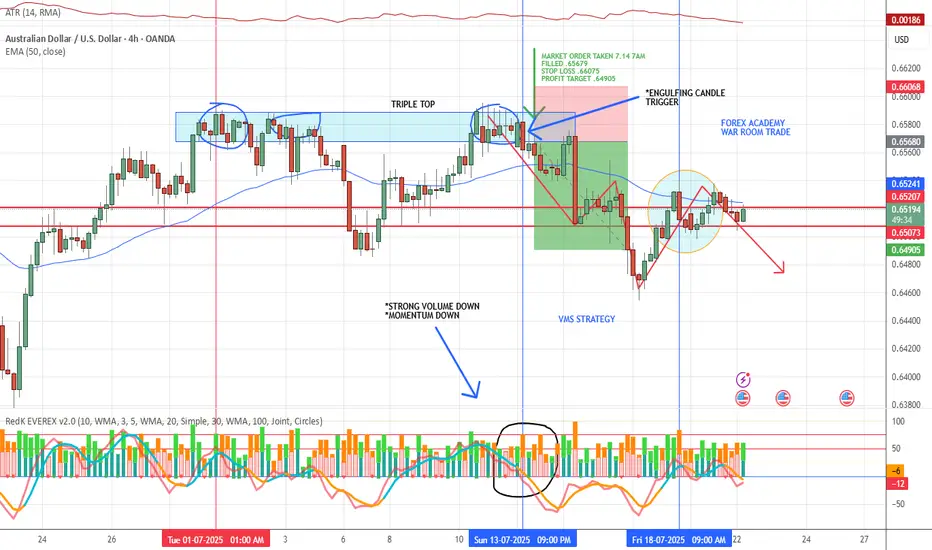
VMS STRATEGY APPLIED📈 VMS Strategy – Triple Top Win Example
We took this trade last Monday based on a textbook triple top reversal:
✅ Clean engulfing candle at resistance
✅ Strong downward volume
✅ Momentum clearly shifting in the trade direction
✅ Perfect timing with all elements aligning
On the 4-hour chart, we focus on specific reversal patterns within the VMS framework:
***Triple tops/bottoms
***Head & shoulders
***1-2-3 formations
***Hammer and shooting star reversals
Each setup must meet all VMS criteria before being considered.
A quick note on back testing:
We know traditional back testing can feel flawed—but here’s what works for us:
Start at the beginning of the month, hide future candles, and scan for VMS setups in real-time conditions. The trade either fits the rules—or it doesn’t. There’s no debate.
We’re not claiming perfection. This strategy does take losses—sometimes multiple in a row. But over time, through strict rule-following and patience, we’ve found consistency and success.
If this helps you, feel free to share it—or even just take a closer look.
With respect, always test it for yourself before trading live.
We’re here to share what’s working for us. We welcome thoughts and suggestions—but know this:
👉 This is a rules-based strategy rooted in discipline, not prediction.
🔒 Aligned Execution is the Edge.
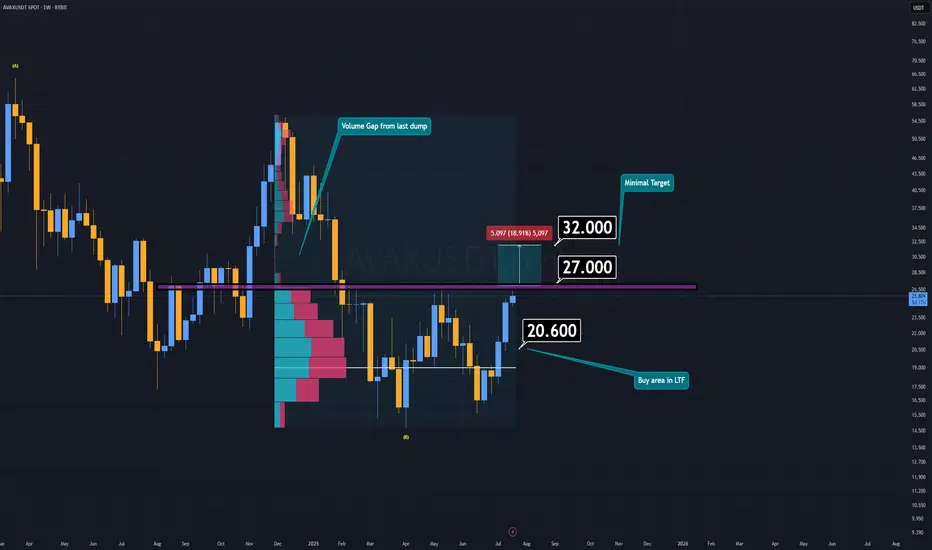
AVAX Analysis (1W)AVAX is currently attempting to form a double bottom pattern, which could signal a strong bullish reversal if confirmed. Earlier this week, AVAX made an effort to break down the key support/resistance zone, but it lacked the necessary volume to succeed.
If AVAX manages to reclaim the resistance area around $27 or higher, and confirms the breakout with a daily candle retest, the minimum target sits at $32.
However, if AVAX fails to break through resistance, there’s potentially an even better buying opportunity in the lower timeframes—a demand zone between $20 and $20.6.
I believe altcoins will offer another chance to catch up while prices are still far below their future valuations.
-S Wishes you the best in luck.
GOLD (XAUUSD): Bearish Move From Resistance Confirmed
Gold tested a significant confluence cluster on a daily time frame
that is based on a rising trend line and a horizontal resistance.
A double top formation on that on an hourly time frame indicates
a highly probable retracement from that.
Goal - 3378.5
❤️Please, support my work with like, thank you!❤️
I am part of Trade Nation's Influencer program and receive a monthly fee for using their TradingView charts in my analysis.
