NZDUSD: Your Trading Plan For Today Explained 🇳🇿🇺🇸
NZDUSD is currently consolidating on a strong intraday/daily support.
To buy the pair with a confirmation, I suggest to focus on a double
bottom pattern on a 4H time frame.
Its neckline breakout and a 4H candle close above 0.6015
will provide a reliable bullish confirmation.
Goal will be 0.6035.
Alternatively, if the price sets a new lower low on a 4H,
this setup will become invalid.
❤️Please, support my work with like, thank you!❤️
I am part of Trade Nation's Influencer program and receive a monthly fee for using their TradingView charts in my analysis.
Double Top or Bottom

Continue to short gold after the reboundTechnical analysis:
Gold rebounded after hitting 3333 overnight. So far, it has reached 3361. However, it can be clearly seen from the rebound process that the rebound is not strong, so I think the rebound space may not be too high. In the short term, it faces resistance in the 3365-3375 area. The strong resistance above the 3390-3400 area still exists, so it may be difficult for bulls to make a major breakthrough in the short term; and the support area below in the short term is in the 3340-3330 area, and the important support is in the area around 3320;
Trading strategy:
Consider shorting gold in the 3365-3375 area, TP: 3350-3340
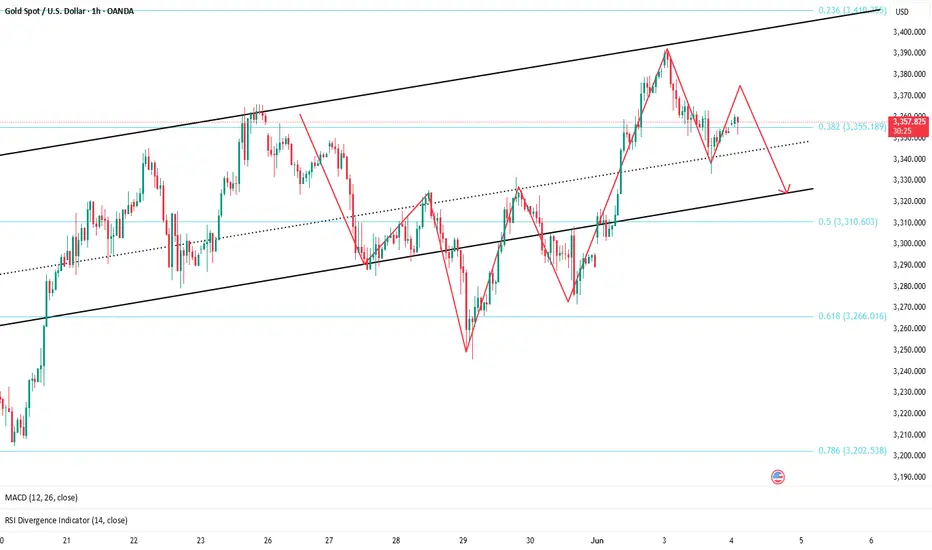
6/4 Gold Analysis and Trading SignalsGood morning, everyone!
Gold experienced a strong intraday reversal yesterday, pulling back sharply after an initial rally. The price rebounded after entering our 3338–3321 buy zone, and is now approaching the 3362 resistance level. Technically, the short-term structure remains within an ascending rebound channel.
Key resistance levels to watch today:
First resistance near 3378
Psychological level at 3400
Extended resistance zone at 3416–3438
If price stalls near 3362 and pulls back, support is expected around 3345–3336, which could form a secondary bottom. If the rejection happens closer to 3380, then 3358–3352 is the support zone to watch. Should gold rally into the 3400–3416 area, keep a close eye on 3385, 3372, and 3365 as potential pullback supports.
📉 Technical Outlook:
4H chart: Price remains in a mild uptrend channel, with key structural support at 3323–3307. However, volume is not confirming the rally, and a potential double top formation cannot be ruled out.
1H chart: Strong support lies at 3343. The MACD is at a decision point, with bulls slightly favored. If volume increases, gold may retest the 3390 high or even push higher.
🗞 Fundamental Factors:
Today, focus on the ADP Employment Report and key Fed-related news during the U.S. session, which may create sharp intraday volatility or alter the trend trajectory. Be especially alert during the New York session.
📌 Today’s Trade Plan:
Sell between 3418–3438
Buy between 3318–3306
Key levels for tactical trades:
3413 / 3392 / 3381 /3365 / 3358 / 3343 / 3328
Strategy Outlook:
Maintain a “sell high, buy low” intraday approach, focus on volume-driven breakouts, and avoid chasing extreme moves blindly.

Kotak Bank – Structure Speaks, Are You Listening?Kotak Bank appears to be in the final stages of a WXYXZ complex correction on the weekly timeframe, with a zigzag pattern unfolding in Wave Z . A rejection from the 2301.90 zone has initiated a clean 5-wave decline, setting the tone for the final leg of the corrective structure.
This analysis combines high-level structure from the weekly chart with internal confirmations from the daily timeframe.
Weekly Chart Highlights
Wave W completed at 1631.00.
A rally into Wave X followed, peaking around 2064.40.
Wave Y took the form of a contracting triangle, breaking down to 1543.85.
From there, a sharp rally into 2301.90 formed Wave X2, failing to extend impulsively — suggesting corrective nature.
The decline from X2 is forming a potential 5-3-5 zigzag, labeled as Wave Z.
Fibonacci projection for Wave C of Z lies between 0.618 (1863.65) and 1.0 (1592.75) of Wave A.
Invalidation level: A price move above 2301.90 invalidates the Z wave scenario.
Daily Chart Observations:
The internal structure from the 2301.90 top shows:
A 5-wave decline in Wave A, ending with a clear ending diagonal in the 5th wave.
This suggests exhaustion and a likely short-term bounce.
Wave B is anticipated as a 3-wave corrective rally, targeting:
0.5 retracement at 2168.05
0.618 retracement at 2199.65
A final 5-wave decline from there would complete Wave C and conclude the larger Wave Z.
Conclusion
Kotak Bank is potentially in the final zigzag leg (Wave Z) of a larger WXYXZ correction that has been unfolding for over two years. With multi-timeframe confluence and a clean internal structure, the path forward suggests a short-term bounce followed by one last leg down.
This setup offers high clarity for both short-term traders and long-term positional analysts awaiting the completion of a Wave 4 before a possible Wave 5 rally.
Price action will be updated as chart evolves.
Disclaimer: This analysis is for educational purposes only and does not constitute investment advice. Please do your own research (DYOR) before making any trading decisions.

LONG ON GBP/JPYGJ has given us a double bottom at a major demand level.
I am looking to catch over 100 pips on GJ to the previous high.


EOLS - Uptrend with strong diagonal support lineEOLS - Uptrend with strong diagonal support lines.
EOLS price has completed a large head and shoulders pattern, started a reversal of a small double bottom pattern with 2 very strong diagonal support lines.
Big green candle today starts price breakout: $9.97 (06.02.2025).
Desired entry price $9.74.
Target $10.93/ 12.28/ 12.81.
Stop loss $9.15.
IMO.

CDSL – Rounding Bottom Breakout After DowntrendSummary
CDSL has broken out of a multi-month rounding bottom formation, reclaiming the key resistance level near ₹1396 with a wide-range candle and strong volume.
This move may signal the start of a trend reversal after a prolonged downtrend. If the breakout sustains, the projected target based on the depth of the base is around ₹1609 — approximately 24.5% upside from current levels.
Technical Highlights
Pattern: Rounding bottom (not a classic cup since no prior uptrend)
Breakout Level: ₹1396
Target: ₹1609 (based on breakout projection)
RSI: Rising to 66+, showing strengthening momentum
Volume: Highest in weeks, suggesting accumulation
Strategy
Entry: On breakout or retest of ₹1396
Target: ₹1600–1610
Stop: Below ₹1385
Disclaimer
This analysis is for informational and educational purposes only and should not be considered financial advice. Please conduct your own research and consult a qualified financial advisor before making any investment decisions.

BITCOIN - Bearish Double TOPHello Traders !
On the 1H time frame, The Bitcoin price formed a double top pattern.
Currently, The neckline is broken !
So, I expect a bearish move📉
________________
TARGET: 103170🎯

Monero: The Hidden Signal of AltseasonMonero: The Hidden Signal of Altseason — A Fractal Reversal Confirmed Across Markets and Timeframes
While the market is still chasing noise from meme tokens and hype narratives, Monero (XMR) is silently building one of the cleanest structural setups I’ve seen this year. And it’s not just happening on one chart — this setup is being confirmed across multiple timeframes, pairs, and fractal levels.
1. XMRBTC (Weekly): The Foundation Is Set
On the weekly chart of XMRBTC, a classic double bottom has already formed. The neckline — aligned precisely with the 100-period moving average (MA100) — has been broken and successfully retested. This kind of structure, especially on a long-term timeframe, often marks the initiation phase of a new market cycle.
This is exactly the type of pattern I focus on in my proprietary approach: Fractal Reversal Law (FRL). The essence of FRL is that every market phase ends with a reversal pattern, where the neckline is flat and usually anchored to the origin of the last impulse — often near MA100. This pattern here is textbook.
2. XMRBTC (H1): A Smaller Echo of the Same Structure
Zooming in, we see an almost identical reversal structure forming on the H1 chart of XMRBTC. A minor correction inside a broader uptrend created another double bottom. The neckline? Again — MA100.
This structure mirrors the weekly pattern, just at a smaller scale — a direct confirmation of the fractal nature of reversals, a core component of FRL.
The significance here is not only in the pattern itself but in where it appears: right at the retest zone of the weekly breakout.
3. XMRUSD: Fibonacci Precision Meets Structural Logic
In the XMRUSD pair, we see further confirmation:
• Price made a strong upward impulse
• A correction followed, landing precisely at the 61.8% Fibonacci retracement
• A reversal formation is now visible on H1
• Neckline again aligns with MA100
• A bullish MACD divergence confirms momentum shift
This reinforces that the reversal we’re observing is not isolated. It’s happening across both BTC and USD pairs — a rare form of intermarket confirmation.
4. Reversal Against BTC = Signal and Context
From a broader view, a structural reversal against BTC is never a coincidence. It often signals more than just technical bounce — it suggests that:
• The alt is starting to outperform Bitcoin
• The background trend in BTC is supportive, not restrictive
It’s difficult to imagine a double bottom structure against BTC completing successfully during a strongly bearish phase in Bitcoin.
So, the pattern itself implies the context — that BTC is either stable or trending upward.
In this case, we’re not just spotting a reversal — we’re identifying the start of a sector rotation.
5. Fundamentals Matter — and Monero Delivers
While the structure is strong, Monero also holds weight fundamentally:
• It’s the most established and respected privacy coin, with real cryptographic innovation (ring signatures, stealth addresses, bulletproofs)
• It has resistance to ASIC centralization, fair emission, and a loyal dev community
• In an age of increasing regulation and surveillance, privacy coins may regain strategic importance
It’s not driven by hype, and that’s exactly why it might lead the next structural altseason.
Conclusion: Structure Is the Signal
What we’re seeing here is more than a pattern — it’s a fractal, multi-asset confirmation across timeframes.
• Weekly double bottom on XMRBTC
• Intraday reversal at the retest zone
• Fibonacci-aligned reversal with MACD divergence on XMRUSD
• MA100 acting as a dynamic neckline across all timeframes
Fibonacci Targets: Where Can Monero Go from Here?
If this setup plays out as expected, price targets can be projected using Fibonacci extension levels from the latest bullish impulse on the XMRBTC chart. The key levels are:
• 0.005 BTC — initial target based on the 1.618.
• 0.0077 BTC — corresponds to the 2.618.
• 0.010 BTC — round psychological level and the 3.618 .
These levels are not just mathematical — they also align with historical liquidity zones and may act as key take-profit areas during the next wave of the trend.
Each target should be monitored in the context of Bitcoin’s overall market behavior. But if the current FRL structure truly marks the end of an accumulation phase, Monero has room to move significantly higher.
This is a textbook FRL alignment, and one of the strongest multi-dimensional setups I’ve seen recently.

6/2 Gold Analysis and Trading SignalsGood evening, traders!
Gold surged more than $70 today, reaching an intraday high of 3363.
If you held short positions from last Friday’s close based on my plan, I hope your SL protected you from major losses.
📉 Technical Insight:
The rapid rally has triggered overbought signals and correction pressure
Watch for pullback support levels at:
3342
3328–3321 zone
If these hold, price might retest 3400 tomorrow
🎯 Trading Plan:
📉 Sell around 3360–3372 (with tight stop)
📈 Buy near 3328–3318 (if price stabilizes)
🔁 Scalp zones:
3332 / 3338 / 3343 / 3352 / 3366

SWDY Double Bottom AnalysisSWDY stock has rebounded back from the resistance line of 81.97, to reach the support line at 81.163. It shows that the double bottom wasn't a true sign to encourage a bullish reversal pattern.

Double Reject @ March Resistance Spells Good News For GJ BearsOANDA:GBPJPY struggles to reach Higher Prices then that of the High created on March 27th and leads me to believe we could see a Double Top Pattern in the making!
Confirmation of the Pattern will come when:
1) Price declines back to 191.877
&
2) Makes a Breakout of the Confirmation
Once the Pattern is Confirmed and Breakout is Validated:
- This should deliver great Short opportunities as a Double Top Breakout & Retest Set-up!

LIGHTBRIDGE BREAKING out from a DOUBLE BOTTOMDYOR on the fundamentals.
This idea share is solely based on the chart.
Which exhibits a beautiful double bottom breakout.

Double Top Alert: SOLUSDT Setup Screams ReversalYello Paradisers, will you act like a pro and prepare for the next clean short opportunity on #SOLUSDT, or will you fall for the same breakout trap again just before the market punishes greed?
💎#SOLUSDT is displaying a textbook double top formation just under a well-respected resistance zone. This kind of structure is no joke—it’s a consistent precursor to sharp downside when liquidity gets taken from retail longs who are too eager to buy high. The market rarely gives second chances. What you’re looking at now is one of them.
💎Price has printed a double top around the $185 to $188 region. That zone has repeatedly acted as a ceiling, and buyers have failed to maintain any strength above it. The lack of follow-through is a major sign of exhaustion, especially after the second tap failed to even test the previous high with conviction.
💎Instead of breaking out, SOLUSDT has rolled over and is now struggling under the $176.23 minor resistance. That weakness is already being confirmed on lower timeframes. As long as this area holds as resistance, there is no justification for any probable aggressive long setups. This is a market preparing to punish overleveraged traders.
💎There’s a clear invalidation for this setup, and it’s extremely important to stick to it. Any 4H candle closing above $190.18 would break this structure and force us to step back and reassess the setup. Until that happens, the current bearish thesis remains firmly in play.
💎The nearest support sits at $168.86 which has highest probability that price may visit there. This level may act as a brief pause, but if the selling intensifies, it will likely break. A confirmed move below that level opens the door toward the true target of this breakdown, which is the $153.95 major support zone. That’s where we’ll be watching for a real reaction.
💎The current structure is heavily skewed toward the downside. Bears are clearly in control below $176.23, and the market has shown no signs of reclaiming key levels that would shift that control back to the bulls. Any bounce should be treated as corrective unless proven otherwise by a structural shift.
Strive for consistency, not quick profits, Paradisers. Treat the market as a businessman, not as a gambler. If you master that mindset, you’ll already be far ahead of the crowd.
MyCryptoParadise
iFeel the success🌴

NZDUSD: Move Up Ahead 🇳🇿🇺🇸
Thursday's and Friday's sessions were bullish on NZDUSD.
After a test of a rising trend line, the price formed
a double bottom pattern on a 4H time frame and violated its neckline.
I think that the pair may rise next week and reach at least 0.6 level.
❤️Please, support my work with like, thank you!❤️
I am part of Trade Nation's Influencer program and receive a monthly fee for using their TradingView charts in my analysis.

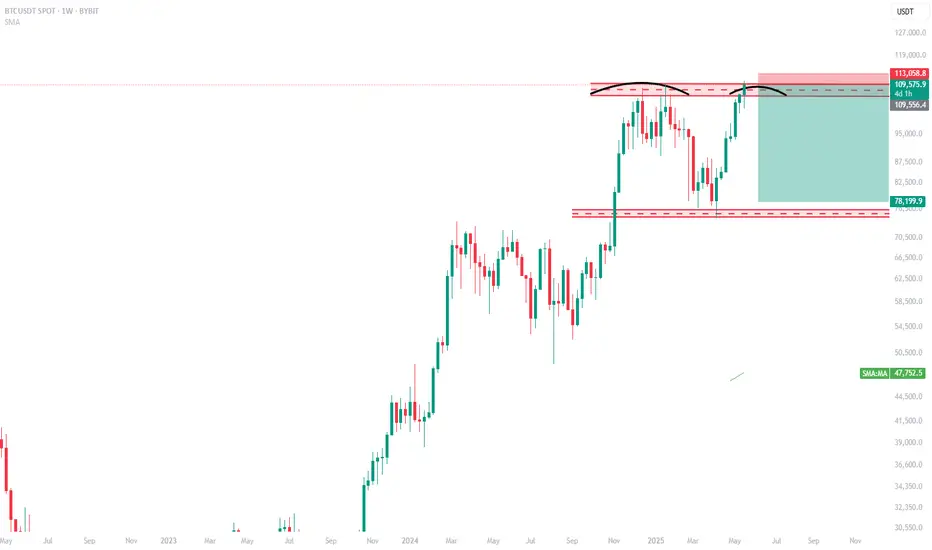
BTC WEEKLY CHART - TIME TO GO SHORT?BTC reached its all-time high, I think we should observe and start opening short positions.
ENTRY ZONE: 109.000 - 111.000
TAKE PROFIT: 78.500
STOP LOSS: 113.000
Gold Poised for a Breakout After Sideways ConsolidationGold has retraced to the 3300 level and remained range-bound for an extended period. This prolonged consolidation suggests that a sharp breakout may be imminent, with the next move — whether up or down — likely to be swift and volatile.
Looking at the 2-hour chart, the current price structure is complex. It could be interpreted as a potential double top, but it also resembles the early formation of an inverse head and shoulders, which makes trading decisions more challenging.
From a technical standpoint:
Moving averages are aligned in a bearish setup, and the area above remains densely packed with resistance.
MACD on the 2H chart shows a bearish crossover, signaling a potential continuation of the downtrend.
However, on the 30-minute chart, MACD shows some short-term bullish momentum, with the next resistance near 3306.
For bulls, if the price attempts to rise toward the 3306–3312 zone but then quickly pulls back, this would indicate weak buying pressure, and caution is advised.
In summary, short-term signals are bullish, but the medium-term trend remains bearish. With the market in a sideways range, it's best to remain patient and watch for breakout signals. The two trading opportunities shared yesterday remain valid and worth monitoring closely.

SWDY's New Upward Region Waiting for Chart Pattern ConfirmationSWDY stock is still trying to peak up, but unfortunately, it's rebounding back from the resistance line of 82.662. It had already broken the support line 81.970. In case of continuing, it'll break the support line 81.849 till reaching the support line 81.759. In case of rising, it'll breach the 1st resistance line to the 2nd resistance line at 82.933 points and the 3rd resistance line at 83.097. In general, it's expected to rise, especially for the presence of a double bottom, which will lead to a bullish reversal pattern and orient a new upward region, but the chart pattern confirmation is still in progress.

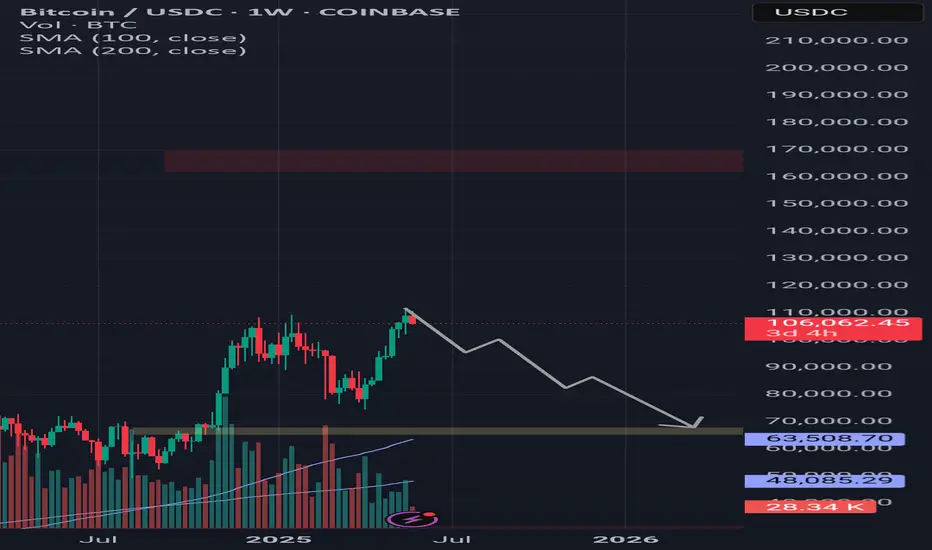
BtcusdtHello dears, I did a simple analysis of Bitcoin for you. If the next weekly candle is also bearish, it may happen with a probability of sixty percent. If you want to buy, buy at the specified price, which is about sixty-five thousand dollars. Good luck (⚠️A lot of data was reviewed for analysis, such as the Fear and Greed Index, Fibonacci, previous bullish periods, etc., but the responsibility for trading is yours⚠️)
SHORT ON EUR/USDEUR/USD has pulled back to a major supply zone that previously formed a DOUBLE TOP in that area in the past. (This is technically the re-test)
I have placed a sell limit order in the supply area and I will be expecting EUR/USD to fall past the swing low for over 100 -150 pips.

USOIL - Bullish Double BottomHello Traders !
The USOIL price formed a double bottom pattern.
Currently, The neckline is broken !
So, I expect a bullish move🚀
_______________
TARGET: 63.49🎯

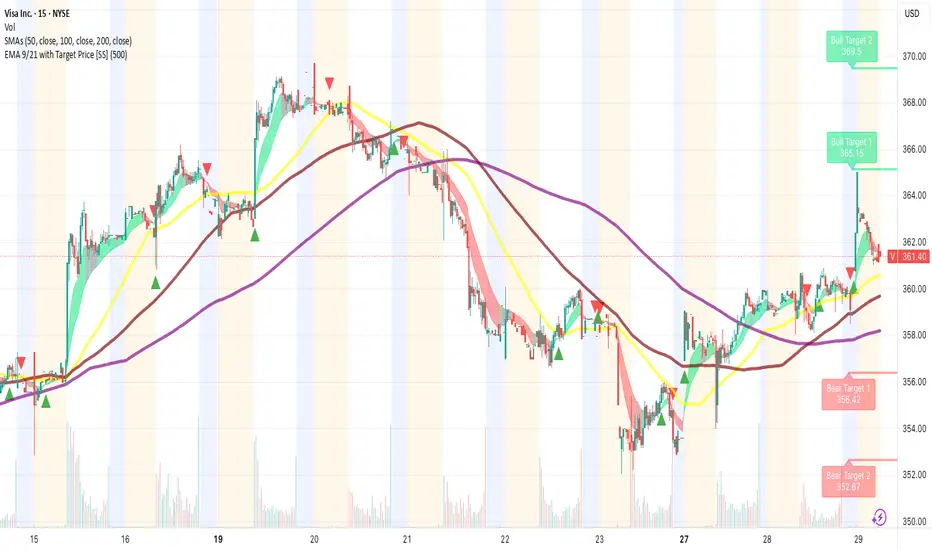
Strategic Entry in Visa (V): Stability, Growth, and Opportunity📈 Strategic CALL Entry on VISA (V) – All 20 Criteria Met
Today I’m entering a CALL option on Visa (V) based on a comprehensive analysis that aligns with all of our 20-entry criteria, combining technical indicators, fundamental strength, and disciplined risk management.
But beyond that, we are also factoring in key macroeconomic catalysts and upcoming earnings, which strengthen the setup and give us a clear path for growth.
🔍 Why Visa – and why now?
✅ Meets all 20 internal criteria, including:
Price above both the 50- and 200-day moving averages (clear uptrend)
RSI in a healthy range (not overbought)
Volume confirms price action
Consistent earnings performance
Strong sector momentum (payments & fintech)
Sound risk-to-reward structure (<6% of portfolio risk)
Positive analyst sentiment
Solid balance sheet, low debt, global dominance, etc.
📊 Earnings expected in June
Visa is set to report earnings in June. Forecasts suggest strong performance backed by increasing digital transactions and resilient global spending. A positive surprise could trigger a sharp upward move.
🌍 Macroeconomic backdrop: US GDP data out today at 8:30 AM (EST)
GDP expectations stand at +2.2%. If confirmed, it signals continued economic strength — a bullish sign for consumer-facing companies like Visa that benefit directly from transaction volume growth.
💡 Why Visa stands out:
Stability
Steady growth
Low volatility
Strong technical and fundamental alignment
📌 Bottom line:
Visa not only checks all our boxes internally, but also benefits from a favorable macroeconomic context and key catalysts ahead. This is a high-conviction, low-emotion trade backed by structure, not hype.