5/19 Gold Trading Signals🔍 Market Overview:
Last Friday, gold prices entered the 3176–3148 buy zone, and after the market opened today, prices rose to 3249, yielding substantial profits.
From a technical perspective, the overall trend is still under the pressure of a double-top pattern. In the short term, price action remains in a range, but the lows are gradually rising. However, indicators are not yet favorable for bulls. In this case, if the bulls want to take control, then the support at 3182–3176 becomes extremely important during any pullback.
🗞️ News Background:
Trump’s tax cut bill has been approved by a key committee in the U.S. House of Representatives.
👉 This week, further progress must be closely monitored as it directly impacts gold's safe-haven demand.
If trade tensions flare up again, gold is likely to rise sharply due to renewed safe-haven demand.
If tensions continue to ease, downward pressure on gold will likely increase.
Also, watch out for any comments on monetary policy — if rate cut expectations increase, gold could face additional downside risk.
📈 Today’s Trading Strategy:
🟢 Buy Zone: 3196 – 3176
🔴 Sell Zone: 3293 – 3318
🔄 Scalp/Flexible Trading Zones:
3188-3209-3236-3252-3269-3282
Double Top or Bottom

$BTC Double Top Pattern Forming – Is a Major Correction Bitcoin Double Top Formation Alert!
Currently, CRYPTOCAP:BTC appears to be forming a Double Top pattern on the 4H chart. If this candle closes as an Inverted Hammer, it may confirm a bearish reversal from the overbought zone.
Key Levels to Watch:
Immediate Support: $96,500 – $95,000
Critical Support: $94,000
Major Breakdown Levels:
If $94K breaks, next support is at $91,000
A deeper breakdown could target $80,000 or even $60,000
This correction could present a golden long opportunity for the next bullish leg. Stay patient, observe confirmations, and plan your entries wisely.

XAUUSD Double Top Breakdown & Target – Bearish Reversal in Play?In today’s analysis, we focus on Silver (XAG/USD) on the daily timeframe, which is currently presenting a high-probability bearish reversal setup. The price action has completed a Double Top pattern — a classic reversal formation — and has broken down below its neckline support, signaling a potential shift in momentum from bullish to bearish.
This chart setup is particularly valuable for swing traders, pattern traders, and anyone seeking to anticipate mid-term directional moves in the commodities market.
📐 Technical Breakdown:
🔷 1. Double Top Formation:
The Double Top pattern forms after a sustained uptrend and is identified by two peaks at nearly the same level.
In this case:
Top 1 formed near $35.5.
Top 2 retested the same zone but failed to break above.
The neckline support — drawn across the $28 zone — was eventually broken.
This price action confirms the classic M-shaped structure, signaling distribution and potential bearish continuation.
🔷 2. Neckline and Breakdown:
After failing at Top 2, price dropped below the neckline, breaking critical horizontal support.
This move completed the pattern, triggering many technical sell signals.
Price is now retesting the neckline zone, a common phenomenon where broken support becomes resistance (known as a "retest").
This retest offers a textbook short opportunity if bearish confirmation follows.
🔷 3. Curve Resistance:
The upper curved blue line represents dynamic resistance.
It has successfully capped price action across multiple attempts and aligns with the pattern's second top — enhancing the strength of this rejection area.
🧱 Support & Resistance Zones:
Resistance Zone: $34.50–$35.50
Strong resistance from both peaks (Top 1 & Top 2) and historical sellers.
Neckline / Retest Zone: ~$28.00
Now acting as resistance — this is the critical level to watch for rejection or breakout.
Support Zones / Take-Profit Levels:
TP1: ~$26.40 — aligns with recent horizontal structure and minor support.
TP2: ~$22.58 — matches major historical support and measured move projection from the Double Top pattern.
📉 Measured Move Target (Pattern Projection):
To calculate the target from a Double Top:
Measure the height from top to neckline.
Project that downward from the neckline’s breakout point.
In this case:
Height: ~$35.5 – $28 = $7.5
Breakdown point: $28 – $7.5 = Target near $20.5–22.5
The TP2 at $22.58 matches this logic — further validating the downside potential.
🔄 Market Psychology & Sentiment:
This pattern reflects a shift in sentiment:
Bulls tried and failed twice to push through resistance.
The eventual breakdown shows bearish conviction, and the ongoing retest represents a decision point.
If sellers hold this level, we could see a cascade of downside pressure as stops are triggered and momentum builds.
🛠️ Trade Setup & Scenarios:
📌 Scenario 1 – Bearish Continuation (High Probability):
If price fails to reclaim the neckline (now resistance) and forms bearish confirmation (e.g., engulfing candle, rejection wick, breakdown below $31), this confirms a likely move toward TP1 and TP2.
Entry Idea: Short on rejection from the $28–$29 zone
Stop-Loss: Above $30
TP1: $26.40
TP2: $22.58
📌 Scenario 2 – Invalidated Pattern:
If bulls push price back above the neckline ($29–$30 zone) with strong volume and daily close, this invalidates the setup and may lead to:
Bullish continuation toward $32–$34
Possible trend resumption if curve resistance breaks
🧠 Educational Notes:
Double Tops are most reliable when:
Formed at the top of strong uptrends.
Followed by a neckline break with volume.
Retested with rejection.
The retest phase is often the best risk/reward entry because:
It confirms resistance.
Offers clear invalidation levels.
Keeps your stop tight while targeting deeper moves.
📢 Final Thoughts:
Silver is currently at a critical technical juncture. The Double Top breakdown has played out, and now all eyes are on the retest. If bears defend the neckline, this setup provides a strong case for continued downside, offering a clean structure with well-defined targets.
⚠️ Risk Management is crucial — always manage your position size and respect invalidation zones.

Sunlogy challenging the 50% Golden RatioOverall chart shows that the price moving upward and breaking the previous DTL.
Potential Ascending Double Bottom detected at 0.26. We may see the confirmation of this pattern once it breakout above 0.26 and price stay above.
This may resulting uptrending movement and challenging to close the previous gap located between 0.26 to 0.28
Looking forward for what’s going to happen.
This is mainly for education purposes and not a trading advice.

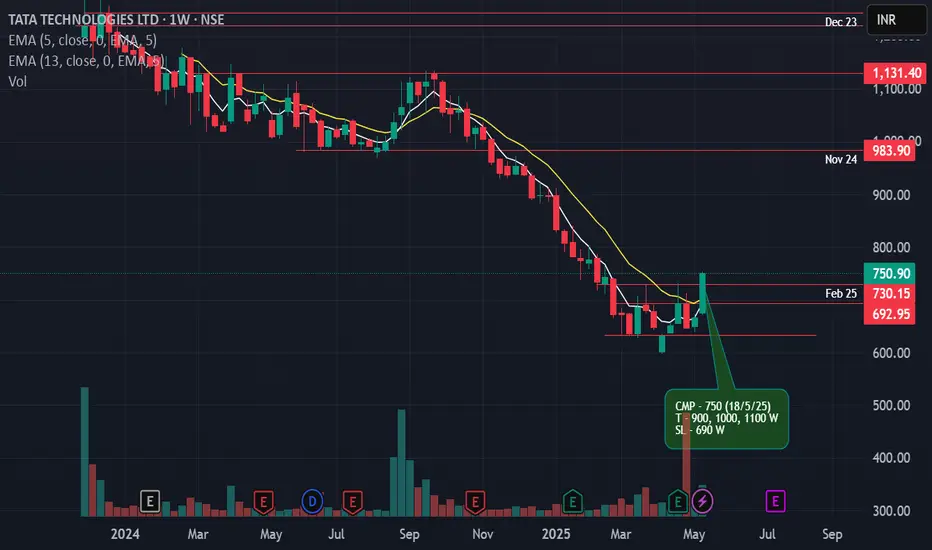
Chart of the week. Tata Tech Tata tech has given double bottom breakout this week. Since its listing @ 1200 in Dec 23, stock is continuously falling. This week after a good consolidation stock is showing strength to move up. The stock is currently trading at very fair evaluation. Its a Tata company so one can take this trade without hesitation. I personally do not recommend any sl as this trade is for investors. But if someone wants to take a trading call then use the following sl.
CMP - 750 (18/5/25)
T - 900, 1000, 1100 W
SL - 690 W
Gold Daily Double Top Formation: Trade Plan for Short Gold at Daily timeframe shows Double top M like shape, a trend reversal indicated by Harmonic Pattern

Monthly Analysis – EUR/USDGiven the upward movement over the past few weeks, I expect a correction followed by a continuation of the bullish move toward the order block, which would also complete the ABCD pattern — and then, a potential sweep of the monthly low.

4 Profitable Bullish Patterns EVERY TRADER Must Know Forex, GOLD
In the today's post, we will discuss accurate bullish price action patterns that you can apply for trading any financial instrument.
1️⃣Bullish Flag Pattern
Such a pattern appears in a bullish trend after a completion of the bullish impulse. The flag represents a falling parallel channel. The market corrects itself within.
Bullish breakout of the resistance line of the channel is a strong bullish signal that can be applied for buying the market.
Best entries should be placed immediately after a breakout or on a retest.
Safest stop loss is below the lows of the flag.
Target - the next key resistance.
Here is the example of a bullish flag pattern that was formed on Gold on a 1H time frame. As you can see, after the breakout of the resistance of the flag, a strong bullish rally initiated.
2️⃣Ascending Triangle
Such a pattern forms in a bullish trend on the top of the bullish impulse. The market starts consolidation, respecting the same highs and setting higher lows simultaneously.
The equal highs compose a horizontal resistance that is called the neckline.
Its breakout is an important sign of strength of the buyers.
Buy the market aggressively after a violation, or set a buy limit order on a retest.
Stop loss should lie at least below the last higher low within a triangle.
Target - the next strong resistance.
Take a look at that ascending triangle formation on EURUSD.
Bullish breakout of its neckline was a perfect bullish signal.
3️⃣Falling Wedge
That formation is very similar to a bullish flag pattern.
The only difference is that the price action within the wedge is contracting so that the trend line of the wedge are getting closer to each other with time.
Your signal to buy is a bullish breakout of the resistance of the wedge.
Stop loss is strictly below its lows.
Target - the next key resistance.
GBPUSD formed a falling wedge on a 4H time frame, trading in a strong bullish trend.
You can behold how nicely the price bounced after a breakout of its upper boundary.
4️⃣Horizontal Range
Similarly to the ascending triangle, the horizontal range forms at the top of a bullish impulse in a bullish trend.
The price starts consolidation , then, setting equal highs and equal lows that compose a horizontal channel.
Breakout of the resistance of the range is a strong trend-following signal.
Buy the market aggressively after a breakout or conservatively on a retest.
Stop loss will lie below the lows of the range.
Target - the next strong resistance.
Dollar Index formed a horizontal range, trading in a strong bullish trend.
Breakout of the resistance of the range triggered a bullish rally.
The best part about these patterns is that they can be applied on any time frame. Whether you are a scalper, day trader or swing trader, you can rely on these formations and make consistent profits.
❤️Please, support my work with like, thank you!❤️
I am part of Trade Nation's Influencer program and receive a monthly fee for using their TradingView charts in my analysis.

REGN Technical Analysis: Potential Bullish SetupREGN is currently at a strong weekly support level, having formed a double bottom with a clear bullish divergence on the daily chart. The price has also closed above a downward trendline, signaling a potential shift in momentum. While the price might be slightly resistant in the 668 - 686 zone, a strong close above this area could lead to further upside.
Trading Recommendations:
Entry Point (CMP): 594
Stop-Loss: Closing below 520
Take Profit 1: 686
Take Profit 2: Open
Beyond the initial target, other potential targets include 740. After that, the price could look to fill a gap at 914, and potentially even hit 1200 as there appears to be no major resistance before that level.
Happy trading!

GBPNZD: Bullish Move From Trend Line 🇬🇧🇳🇿
GBPNZD retested a recently broken trend line on a daily.
A tiny double bottom that was formed on that on an hourly time frame
provides a strong intraday bullish confirmation.
We can expect a rise now at least to 2.26 level.
❤️Please, support my work with like, thank you!❤️
I am part of Trade Nation's Influencer program and receive a monthly fee for using their TradingView charts in my analysis.

5/16 Gold Trading Signals
🌇Good afternoon, everyone!
Gold made a strong one-way rally from 3120 to above 3200 yesterday, perfectly achieving our bullish target with substantial profits.
Today, after a slight uptick at the open, gold started to pull back and enter a consolidation phase. Technically, this is a normal correction after a $120 surge. However, the key question now is:
🔍 Is this just a healthy pullback, or a bearish continuation pattern?
There’s some uncertainty in the current structure:
On the larger scale, the market still appears to be forming a double top.
On the shorter-term, this week’s pattern resembles a head and shoulders bottom, and price is now testing the neckline zone.
🧭 So, while the direction remains unclear, we can still identify key trading zones to act on.
🗞 News Watch:
Several important U.S. data releases are scheduled during the New York session. They may provide crucial directional signals for gold.
📌 Today’s Gold Trading Strategy:
🟢 Buy Zone: 3176 – 3148
🔴 Sell Zone: 3265 – 3287
🔄 Flexible Trading Zones (watch for reversals or breakout plays):
▫️3187-3198-3209-3237-3258-3267
✅ Reminder: With the structure being complex and direction unclear, avoid aggressive positioning. Focus on scalp or short-term trades near key zones and react to market post-data.

Can $AMC come back to life again? NYSE:AMC is showing some good TA on the weekly and daily chart. We are visiting lows from the past, which reminds me of when I played NYSE:AMC and it visited the COVID lows.
On both the Weekly and Daily we have the MACD in GREEN, RSI crossing MA which the weekly is showing downtrend being broke.
Daily chart Is almost or is right on the 8 day crossing the 21 day EMA. Daily is also breaking the downtrend of ~$4.40 along with breaking the 100 day SMA. Holding VWAP form the low of $2.45 on 4/4/2025.
NYSE:AMC Price as of 5/15/2025: $2.81
Need to see continuation out of the downtrend with volume
Break the resistance level of $2.81 - $2.85, which has the 100 Day SMA around the $2.83 that needs to be cleared.
Then $2.90 - $3.00 and we'll follow the Fib Levels and mark support/resistance levels as we go.
This could get spicy so buckle up knuckleheads!
NYSE:AMC Daily
NYSE:AMC Weekly

5/15 Gold Trading Signals🌇Good afternoon, everyone!
Yesterday, gold broke the support after some sideways movement and touched the buy zone near 3170, but profit was limited.
Today, after opening, gold rebounded to above 3190 but faced resistance and started dropping again. Notably, the 1-hour chart shows bullish divergence, and although not yet corrected, such divergence usually leads to a rebound of at least $60 — a potential opportunity worth watching.
🗞 News Highlights:
U.S. Initial Jobless Claims
Research conference on monetary policy and economy
These events may significantly impact gold, so stay alert.
📌 Today’s Trading Strategy:
🟢 Buy Zone: 3113 – 3076
🔴 Sell Zone: 3208 – 3223
🔄 Flexible Trading Ranges:
▫️3123-3152-3168-3187-3198
✅ Maintain cautious, flexible positioning. Watch for divergence correction opportunities for a potential sharp rebound.

INDIGO - Resistance Zone with RSI Divergence| Possible Reversal?Stock is currently testing a strong resistance zone around ₹5649, which has previously acted as a supply area. Despite bullish momentum, the RSI is showing bearish divergence, as marked by red arrows, each price high is not supported by a higher RSI peak.
🔍 Key Observations:
Price is at previous swing high zone.
Bearish RSI Divergence indicating possible momentum loss.
Volumes are not confirming a breakout yet.
Risk-Reward setup looks favorable for short-side trade if rejection seen.
🧠 Plan:
Watch for price rejection at this level.
Short below ₹5580 with SL above ₹5650.
Potential target around ₹5150-5200 zone (previous support).
🕵️♂️ Wait for confirmation candle before entry. This setup is ideal for short-term positional traders with strict risk management.

GOLD → Correction ahead of news. Will the decline resume?FX:XAUUSD has been buying back all the losses from the Asian and Pacific sessions since the opening of the European session, but this looks more like a catapult being loaded...
GOLD broke through the global consolidation base of 3200, which only confirmed the bearish market structure. Investors are waiting for PPI and retail sales data in the US, as well as Fed Chair Powell's speech.
Expectations of fewer Fed rate cuts and optimism surrounding trade talks with China and South Korea continue to weigh on gold. However, weak macro data and a growing US budget deficit could revive interest in this safe-haven asset.
GOLD is in a correction phase and is heading towards the zone of interest: the liquidity zone and previously broken support of global consolidation.
Resistance levels: 3187-3190, 3200
Support levels: 3123, 3100
Gold may test the indicated resistance, but based on the nature of the market, this situation may end in a false breakout and a fall. Target 3123 - 3100.
However, unpredictable data may temporarily change the market, which could lead to momentum towards 3220-3230.
Best regards, R. Linda!

GOLD - Bearish Double TOPHello Traders !
The GOLD failed to create a new higher high !
The price formed a double top pattern.
Currently, The neckline is broken !
So, I expect a bearish move📉
________________
TARGET: 3022🎯

BTCUSD is expected to form a double top patternOn the 4-hour chart, BTCUSD is fluctuating and falling in the short term, and the market has the opportunity to form a double top pattern. The current support below is around 100760. If it falls below, it is expected to continue to fall, and the downward target is around 98000. At present, you can pay attention to the short-selling opportunities around 103300.

DOGE/USDT 1H Chart: Double Top or Expanding Triangle in Play?Dogecoin is serving up some spicy setup!
We’re seeing a Double Top pattern forming, with DOGEUSD currently at $0.22 — right at the bottom line of this bearish formation. The two peaks hit resistance around $0.25 , signaling potential downside.
However, if DOGEUSDT drops to the key support at $0.20 , this pattern could evolve into an Expanding Triangle (Megaphone) , which might set the stage for a bullish reversal!
I’m eyeing a long entry at $0.20 .
If DOGE holds this level and breaks above the Double Top resistance at $0.25 , we could see a surge toward $0.27 and beyond!
On the flip side, a break below $0.20 could lead to further downside, possibly testing $0.18 .
Key Levels to Watch:
Resistance: $0.25 (Double Top resistance), $0.27
Support: $0.20
Breakout Target: $0.27+
Breakdown Risk: $0.18
Will DOGE bounce from $0.20 and rally, or are we in for a deeper dip? Let’s hear your thoughts below!

Ethereum - Bull run over Ethereum Weekly Chart Analysis (as of May 14, 2025)
1. Breakdown of M-Pattern:
Ethereum has clearly formed and broken down from a large M-pattern, indicating a bearish double-top structure.
This breakdown suggests weakness and the potential for a deeper correction if critical support levels fail.
2. Retest of Triangle Pattern:
After the breakdown, ETH has retested the lower boundary of a previously broken ascending triangle.
This retest aligns with the $2,746–$2,370 zone, which is now acting as a strong resistance cluster.
3. Current Price Zone – No Trading Zone:
Ethereum is currently trading around $2,587, right in a no-trading zone (highlighted in the chart box).
This zone represents indecision — neither a clear breakout nor breakdown — suggesting traders should wait for confirmation.
4. Bearish Scenario – Pin Zone Break:
A break below $2,370, the key horizontal support (also the neckline of the M-pattern), would likely confirm renewed bearish momentum.
If this level is decisively broken, expect a strong downward move.
5. Downside Targets:
First major support: $1,410 – previous swing low.
Final bearish target (highlighted in purple): $1,000–$1,004 — a psychological and historical support level.
6. Upside Scenario (less probable currently):
ETH would need to reclaim $2,746 and break back into the triangle to invalidate the bearish setup.
Only then could the long-term target of $5,391 be reconsidered.
Conclusion:
Ethereum is in a critical decision zone. While the macro pattern signals bearish continuation, confirmation will come on a break below $2,370. If that happens, a drop toward $1,000 is highly likely. Traders should remain cautious and avoid new positions until a decisive move occurs.

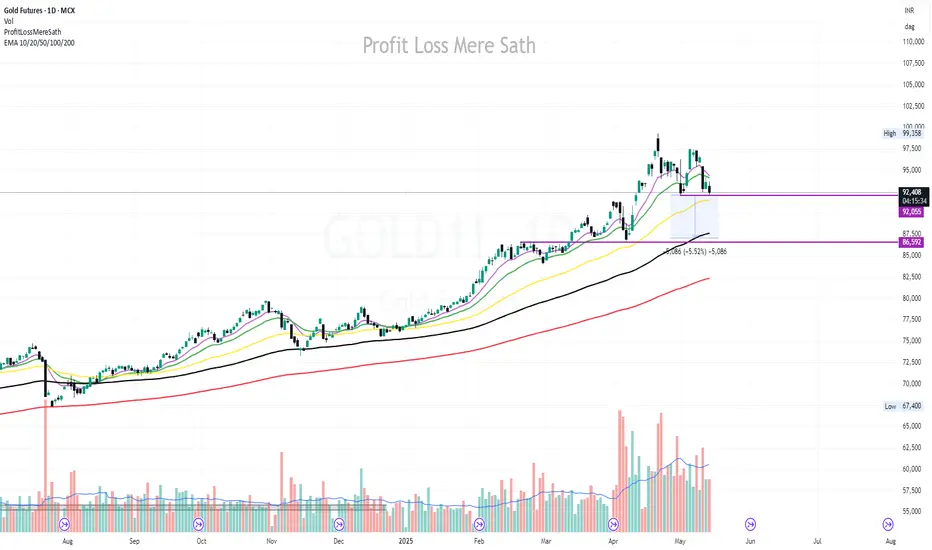
Gold Futures Analysis (MCX) – Target 87,000/- Chart Date: May 14, 2025
CMP: ₹92,558
Change: -1.16% | Volume: 14.13K
Gold has shown weakness after a strong uptrend from early February. Currently, it is consolidating near the ₹92,000 level, just above the 50 EMA (₹91,526). The price is hovering near a key support zone highlighted between ₹92,055 and ₹91,526.
📉 Key Observations:
Price rejected near recent swing high of ₹99,358.
Currently testing the 50 EMA. A breakdown below this may trigger further downside toward ₹87,500–₹86,592 demand zone.
Volume declining on recent candles – indicating weakening bullish momentum.
EMA Cluster (10/20/50) flattening out – potential trend reversal or deeper pullback in progress.
📌 Levels to Watch:
Support: ₹92,055 → ₹91,526 | Below that: ₹87,500 & ₹86,592
Resistance: ₹94,160 (20 EMA), ₹94,434 (10 EMA)
Breakdown Target Zone: ₹87,500 (5.52% from current price)
🔔 Strategy:
Wait for price action near the support zone. If breakdown confirms with volume, look for short opportunities with a tight SL above 50 EMA. Long trades only if strong reversal candles appear near ₹91.5k zone.
📊 EMA: 10/20/50/100/200 plotted for dynamic trend & support insights.
Gold Selloff Continues as US–China 90-Day Deal Adds PressureGold did not respond well to the new 90-day deal between China and the U.S. On top of the India–Pakistan ceasefire, starting Ukraine–Russia ceasefire negotiations, Hamas–U.S. talks, and nuclear discussions with Iran, several developments are reducing global risk and weakening safe haven demand.
Many fundamental factors are starting to turn against gold. One of the key signs is the heavy profit-taking seen in the "managed money" positions in the COT report in the last several weeks. These developments are now starting to show in the price action.
The "weak double top" pattern, which is one of gold’s go-to reversal signals at major tops, gave the first warning. Since then, local support levels have been falling one by one. Gold is now testing the 3,200 level, which is expected to act as support. However, if this level breaks, the next target could be in the 3,145–3,170 range. The main medium-term target for a deeper correction remains around 3,000.
For any strong upward reaction, bulls should watch the 3,270–3,290 zone. If gold bounces from 3,200, this area could offer strong resistance and potentially cap further upside.

SHORT ON EUR/JPYOANDA:EURJPY has created a double top with bearish divergence at a major supply zone.
I will be selling EJ to the next level of support/demand for over 200 pips.

EURCAD - Bearish Double TOPHello Traders !
The EURCAD failed to break the resistance level (1.59934 - 1.59334).
The price formed a double top pattern.
Currently, The neckline is broken !
So, I expect a bearish move📉
________________
TARGET: 1.54350🎯
