XRP to $11XRP has a lot of patterns and things to show us the price about $11.
The first pattern is the double bottom on weekly from 2018 till now, and the target of that is $11. The second thing is the Fibonacci extension for the 100% movement of the recent movement on XRP from November 2024, and that is $11.
The last pattern is the bull flag that XRP made recently and the target of that is $11.
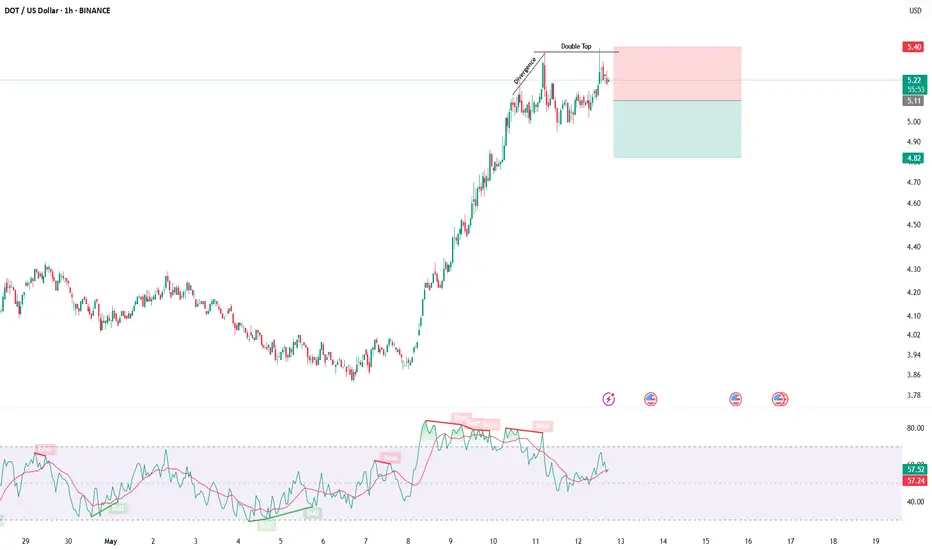
Double Top or Bottom

Crude Oil - Double Bottom 📊 Market Overview:
Price is trading around $62.58, approaching a key horizontal resistance near $63.50, which has acted as a strong supply zone in the past.
The chart shows a bullish setup with a long position already marked, targeting the $70.60 zone, a major previous top.
A clear risk/reward structure is in place, suggesting a well-defined trade plan.
🔍 Key Technical Zones:
🔼 Resistance Zone:
63.50 – Immediate resistance
Price has struggled here before; needs a clean break to validate bullish continuation.
70.60 – Main target zone
This is the previous strong sell-off origin; high probability of rejection if reached again.
🔽 Support Zone:
61.26 – Marked stop loss
Protects the trade in case of a false breakout or quick reversal.
54.38 – Major demand
Long-term support from April lows.
📈 Trade Idea Based on Chart Setup:
✅ Long Setup (Bullish Bias)
Entry: 62.58 (current price)
Stop Loss: 61.26
Take Profit: 70.60
Risk/Reward Ratio: ~1:4+ (very favorable)
Conditions for entry confirmation:
Break and close above 63.50 on strong volume or bullish engulfing
Retest of 63.50 as support could provide a secondary, lower-risk entry
📉 Bearish Scenario (Invalidation):
Failure to break 63.50 cleanly + a bearish rejection pattern could lead to a deeper correction.
Break below 61.26 invalidates this bullish structure.
In that case, next support lies near $58.00 and below.
🧠 Fundamental Angle to Consider:
WTI Crude Oil is highly sensitive to:
OPEC decisions
US inventory reports
Geopolitical tensions or Middle East developments
USD strength/weakness
Make sure to monitor the weekly EIA Crude Oil Inventory report and Fed updates, as these can drastically affect volatility.
📌 Summary:
Current Bias: Bullish (if 63.50 breaks cleanly)
Key Levels:
Support: 61.26 / 58.00
Resistance: 63.50 / 70.60
Strategy: Buy breakout above 63.50 or on successful retest; manage SL at 61.26

5/14 Gold Trading Signals🌇Good afternoon, everyone!
Yesterday, gold only entered the 3218–3252 flexible range , and did not touch the broader buy/sell zones, resulting in limited profits .
Currently, gold remains under resistance , and candlestick formations suggest an irregular double top . With ongoing sideways box-range movement , the market lacks a clear direction, so caution is advised .
📉 If bears take control, gold could drop toward 3169 .
📈 If bulls prevail , a rebound to 3300 is likely.
🔍 Key Technical Zones:
Bullish Resistance : 3246 – 3268
Support Area : 3218 – 3209
🗞 News Focus:
Speeches from Fed members Waller and Jefferson today may trigger directional momentum in the market.
📌 Trading Strategy for Today:
Sell Zone : 3301 – 3327
Buy Zone : 3170 – 3152
Flexible Trading Ranges :
▫️ 3210 – 3243
▫️ 3272 – 3259
▫️ 3247 – 3296
✅ Trade with discipline, manage position sizes carefully, and stay alert during key speeches.

XAU/USD Short PotentialI believe due to higher time frame analysis we will see gold fall in the near future

BCH short range high ideaBCH could be forming structural loss lower time frame that could at least give a small pullback into the demand below offering a scalp short opportunity

GOLD forms a DOUBLE TOP. Support 3200. Trend reversalGOLD is forming support for the double top reversal pattern
A break of 3200 will confirm the market's intention to reverse the trend and go downwards.
Scenario: There is a lot of important news from the US and Great Britain ahead. If the general fundamental background remains and the dollar continues its bullish trend, then we will be close to a breakdown of 3200.
Thus, a break of 3200 and consolidation below the level will be a signal that we are ready to go down.

USDCHF: Correctional Movement Ahead?! 🇺🇸🇨🇭
USDCHF may continue a correctional movement after
a release of the today's US CPI data.
A technical price action confirmation that I spotted is a
valid Change of Character CHoCH on an hourly time frame.
We can expect a bearish continuation to 0.8358
❤️Please, support my work with like, thank you!❤️
I am part of Trade Nation's Influencer program and receive a monthly fee for using their TradingView charts in my analysis.

5/12 Gold Trading SignalsGood morning everyone!
Gold opened lower and extended losses today, influenced by easing China–U.S. trade tensions and ceasefire news from India-Pakistan.
The recent rally was largely driven by safe-haven demand amid geopolitical concerns. As tensions ease, gold's retracement is a logical market reaction.
🔍 Technical Outlook:
Gold has now returned to a previous consolidation zone . While some support exists, current candlestick structure and most indicators show no clear bullish reversal yet.
Entering long positions too early may pose short-term risks, so trend trades should wait for stronger confirmation.
For flexible intraday trading, watch:
Support at 3263–3246: Holding this zone could trigger a rebound back toward 3309 resistance.
📌 Trading Recommendations:
✅ Sell Zone: 3306 – 3321
✅ Buy Zone: 3218 – 3198
🔁 Range for Scalp/Short-Term Trades: 3294 – 3263 / 3238 – 3269

GOLD Daily what?If this is a double top for gold on daily TF, then $3050 is the target as we have a strong support trendline at that area as well.

400 pips drop on NZDUSD in the coming weeks ??As the Dollar Index TVC:DXY strengthens, most of the major FX pairs are gearing up for massive drop or have started dropping already. One of these pairs is OANDA:NZDUSD which is about to drop 400 pips in the coming days.
OANDA:NZDUSD having formed a Double Top chart pattern, the bullish momentum of the TVC:DXY has caused a break of the neckline of the above mentioned chart pattern.
Below are the expected targets for this setup
TP1: 0.57
TP2: 0.55
SL: 0.60
Kindly support this analysis to enable it reach to other people, and do comment your thoughts.

NZDCHF: Best Gap to Trade Today?! 📈NZDCHF appears to be a promising trade, out of the different gap openings we see today.
The price has reached a significant intraday resistance level.
I believe that the gap will likely be filled soon, as I am already observing signs of selling pressure on the hourly chart, including the formation of a double top pattern.
It is possible to anticipate a bearish movement towards the 0.4920 support level.

NZDCHF: Classic Gap Trade 🇳🇿🇨🇭
On a today's live stream with my students we discussed
a gap up opening on NZDCHF.
I have a strong feeling that it is going to be filled tonight.
A double top pattern on an hourly time frame and its neckline
violation provide a strong bearish confirmation.
Goal - 0.492
❤️Please, support my work with like, thank you!❤️
I am part of Trade Nation's Influencer program and receive a monthly fee for using their TradingView charts in my analysis.

$AUCTIONUSDT ready to pump after putting a bullish divergenceBINANCE:AUCTIONUSDT has been very bearish for weeks following a massive drop. It did put a double bottom and a bullish divergence, which are signs of market reversal i.e. a shift from bearish trend to bullish move. It broke the resistance zone which also serves as the neckline for the double bottom/bullish divergence formed. A retest of this resistance zone now turned to a support zone, gives a bullish setup as BINANCE:AUCTIONUSDT tends to continue its new found bullish move.
Be on the look out and expect minor retracements while at it, as there are some support and resistance zones it can bounce off from. These zones are already marked out in the setup.
Expected Targets:
TP1: $17
TP2: $20
TP3: $24
TP4: $28
Kindly support this analysis to enable it reach to other people, and do comment your thoughts.

GBPUSD ready to drop 500 pips !!!As the Dollar Index TVC:DXY strengthens, most of the major FX pairs are gearing up for massive drop or have started dropping already. One of these pairs is FX:GBPUSD which is about to drop 500 pips in the coming days.
FX:GBPUSD having formed a Head and Shoulder chart pattern, the bullish momentum of the TVC:DXY has caused a break of the neckline of the above mentioned chart pattern.
What to expect:
FX:GBPUSD will most likely either retest the neckline that it broke, and then give a massive drop or it will continue the drop from the broken neckline all the way to 1.3030 before retracing.
Below are the expected targets for this setup
TP1: 1.3030
TP2: 1.2900
TP3: 1.2745
SL: 1.3370
Kindly support this analysis to enable it reach to other people, and do comment your thoughts.

HIFI looks to be coming out of a double bottomEvery other crypto out there has had a mini bull-run over the past few days except for HIFI which has seen a small dump. STOCH RSI is in oversold territory on the daily and the 4 hour. This looks like it could shape in to a classic W shaped double bottom reversal.

AUDJPY - Bullish Double BottomHello Traders !
On Tuesday 6 May, The AUDJPY reached the support level (92.222 - 91.978).
The price formed a double bottom pattern.
At the moment, The Neckline is broken !
So, I expect a bullish move🚀
_______________
TARGET: 94.240🎯

XAUUSD Double TopOn the daily chart, XAUUSD has formed a potential double top pattern, and short-term bears have the upper hand. Currently, we can focus on the support near 3200. If it falls below, it is expected to continue to fall, and the downward target is the previous demand area of 2974-3022. During the day, we can focus on the rebound shorting opportunities in the 3268-3282 area.

Swiss Franc / USD Double BottomTargets = 1.289 then 1.338
Wick already reached and breached halfway point to TP 1, re-test of support and neckline in progress now. Hold and/or a pullback and reclaim of 1.889 to head up towards targets.
Good luck!

ROOT: double-top short / shortable bounce set-up Stock's fundamentals, price relative strength, and group action look strong.
But the uptrend structure may have formed a mid-term top.
Weekly:
Downside potential remains as long as the price stays below the May 8th highs.
Ideal macro support zone: 90–70.
Daily:
Thank you for your attention and I wish you successful trading decisions!

SPX500USD Chart Breakdown Price is currently approaching the 5,708 🔼 resistance zone after a strong bullish rally from the 5,320 🔽 support level. The market structure remains bullish, with higher highs and higher lows supported by the upward-sloping 50-period SMA.
Support at: 5,590 🔽, 5,450 🔽, 5,320 🔽
Resistance at: 5,708 🔼, 5,840 🔼
Bias:
🔼 Bullish: If price breaks and holds above 5,708 🔼, we could see continuation toward 5,840. Holding above the 50 SMA strengthens the bullish outlook.
🔽 Bearish: A rejection from 5,708 🔼 could send price back down toward 5,590, with further weakness exposing 5,450 🔽.
📛 Disclaimer: This is not financial advice. Trade at your own risk.

USDCAD: Bullish Move Will Continue 🇺🇸🇨🇦
USDCAD will likely continue rising after a retest of a recently
broken significant daily resistance cluster.
A double bottom pattern formation on its retest provides
a strong intraday bullish confirmation.
Canadian fundamentals data strengthened buyers even more.
I think that the pair is going to reach 1.3955 level soon.
❤️Please, support my work with like, thank you!❤️
I am part of Trade Nation's Influencer program and receive a monthly fee for using their TradingView charts in my analysis.

Watching ETHBTC for a Double Bottom (Hidden Bullish Divergence)Introduction
We are in the initial stages of seeing if ETH can set a "higher low" double bottom on the monthly chart. The first low was set September 2019 so this has been a multi year pattern. It might be playing out over several crpyot cycles to completion.
Simple Price Analysis
For a valid double bottom we want the lows within 10% of each other. The first low is about 8% below this second low so we are definitely within tolerance. We can also see that price is currently bouncing off top of the previous monthly bottoming structure until price moved to between the 0.618 level and created a double top (which I covered extensively in the linked idea.
In the chart below we can see a similar pattern with bitcoin after the C19 crash. The low wasn't textbook, the first low being 18% lower than the second low. Thats fine. The most important think is that price set a higher low.
Targeting off the fib draw is still the same. Looking for the 1.618 level. So I am watching to see eth hit a 27x against bitcoin from here
Indicators
Normal Divergence (Trend Reversal)
Bearish: Higher highs on price action but lower highs on the indicator
Bullish: Lower lows on price action but higher lows on the indicator
Hidden (Trend Continuation)
Bearish: Lower high on the price action and higher highs on the indicator
Bullish: Higher low on the price action and a lower low on the indicator
If you look at the primer we are looking for the main trend to continue. And that is up.
Battle Plan
In my linked idea I made it clear I was staying out of eth until I saw bullish divergence. Not just eth, but everything in the eth ecosystem. Now EHTBC provisionally bullish its time to look at the ETH ecosystem again. While ETHBTC looked bearish I didn't even bother to analyze tokens against eth, only BTC.
Now I am going to be analyzing coins bullishness against eth. If I don't think it will outperform eth I don't buy it. And generally, I hope to be buying bull backs. Here is a great opportunity for a SUI buy when compared against eth on the 4h chart.
Wish me luck.
Linked Idea
