SUPER - Getting ready for the super run- Price is trading near the resistance after forming higher high.
- it's highly likely that price will get rejected around the resistance and will form another higher high.
- this is an excellent opportunity for us to enter the trade.
Entry Price: 0.7322
Stop Loss: 0.5344
TP1: 0.8939
TP2: 1.0517
TP3: 1.2867
TP4: 1.6336
TP5: 2.2243
Max Leverage 5x.
Don't forget to keep stoploss.
Support us by Liking and following.
Thanks and Cheers!
GreenCrypto
Double Top or Bottom

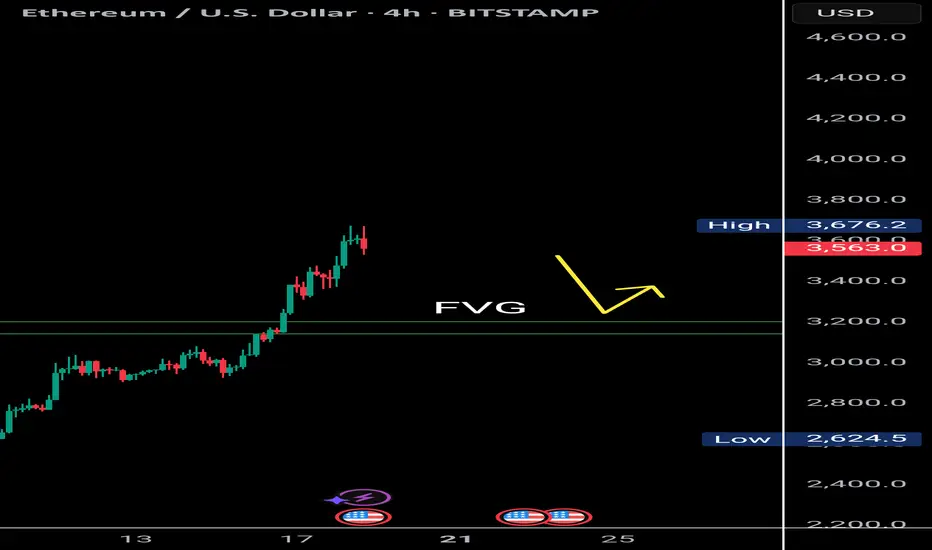
$Eth Faces Double Top Resistance with Bearish RSI DivergenceETH/USDT | 4H Analysis
Ethereum is currently showing signs of weakness on the 4H chart, forming a potential double top pattern around the $3,700-$3,680 range.
Adding to this, the RSI is exhibiting bearish divergence, suggesting that bullish momentum is fading. There's a visible liquidity gap between $3,200–$3,180, which might act as a magnet in the short term. A retest of this zone is likely before ETH attempts to resume its upward move.
Key Observations:
🟠 Double top structure on 4H chart
🔻 Bearish RSI divergence
🕳️ Favorable gap: $3,200 – $3,180
🔁 Watch for price reaction after retest
⚠️ If ETH holds the $3,180 support after filling the gap, a bullish bounce toward higher levels could follow.
📌 This idea is for educational purposes. Trade wisely with proper risk management.
ANDYUSDT double bottom formed breakout cause +100% pump2X is here easy target for tokens like PHEMEX:ANDYUSDT in this bull market but first of all breakout here to the upside is needed as you can see and i think soon it will happen with next bull pump of BINANCE:BTCUSDT so to the moon with ANDYUSDT for at least 2x or 3x.
DISCLAIMER: ((trade based on your own decision))
<<press like👍 if you enjoy💚

$DOGE Double Bottom TargetIf this double bottom "W" pattern on CRYPTOCAP:DOGE plays out, the target is $0.47.
Two notes:
1. The double-bottom pattern has a 60-65% success rate (no guarantees).
2. The Alt market has been very strong, with new dollars entering the market. If we close above $0.25-0.26 and retest, I think this target is likely as it returns to the high for this cycle.

GBPCAD Bearish Continuation Patterns and ConfirmationsA broken daily demand zone, a resistance trendline showing direction to the downside, bearish continuation patterns (rejection patterns) and consistent H4 supply zones all indicate that this market is bearish and if the current H4 supply holds then use bearish confirmations on LTFs to short to the next support or demand zone.

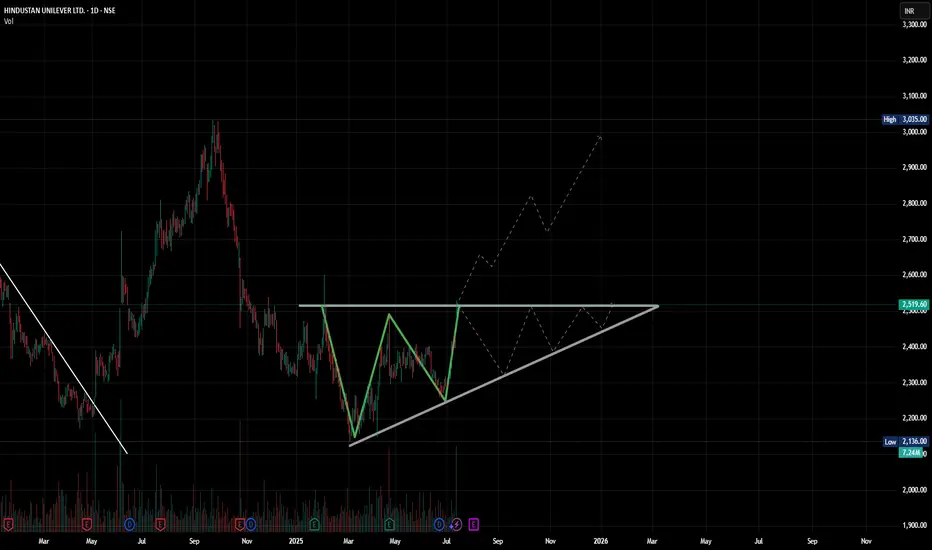
W For Win? HUL Pulls Up with a Perfect Double BottomPrice showing up to resistance like it forgot the last time it got slapped here. But this time it brought volume. Respect?
(Or the probable ascending triangle.. u know?)
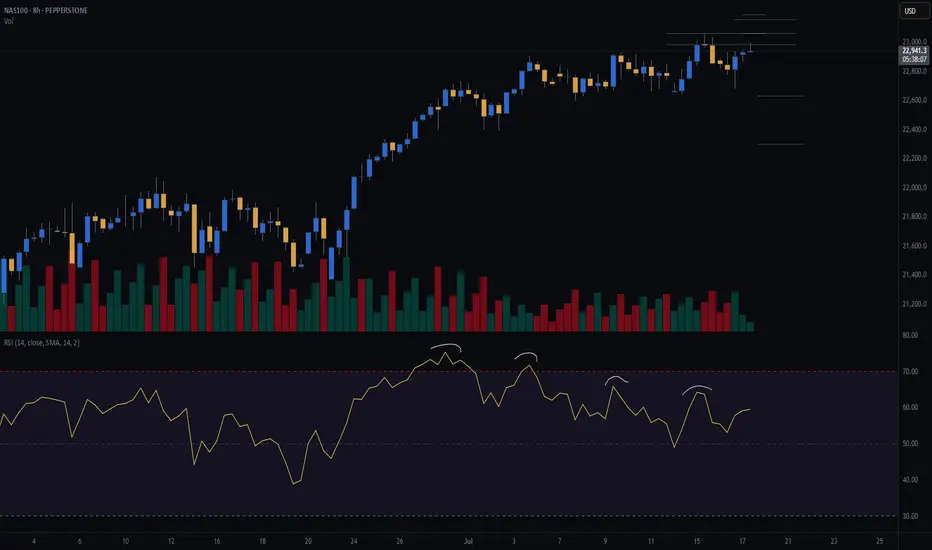
NAS100 (CASH100) SHORT - Double Top H8Risk/reward = 4.6
Entry price = 23 063
Stop loss price = 23 190
Take profit level 1 (50%) = 22 635
Take profit level 2 (50%) = 22 303
Still waiting for confirmation on some variables.
For example, need H8 candle to close in range and volume to validate, amongst other variables.
BTC/USD bearish conf. finally?BTC printed a double top on the 5m and on the 1h.
BTC being very weak all over the day, even running against ETH and co.
That might be the signal for the retracement "everybody" is waiting for.
BYBIT:BTCUSDT.P

CRWV retest incoming?will we retest 130?
That's my bet. I'm sure that Fri 7/18 will be wild as it is the monthly contract. Staying below 140, I'll hold my runners.
After this bottom, I think we will reverse back upward to 145+

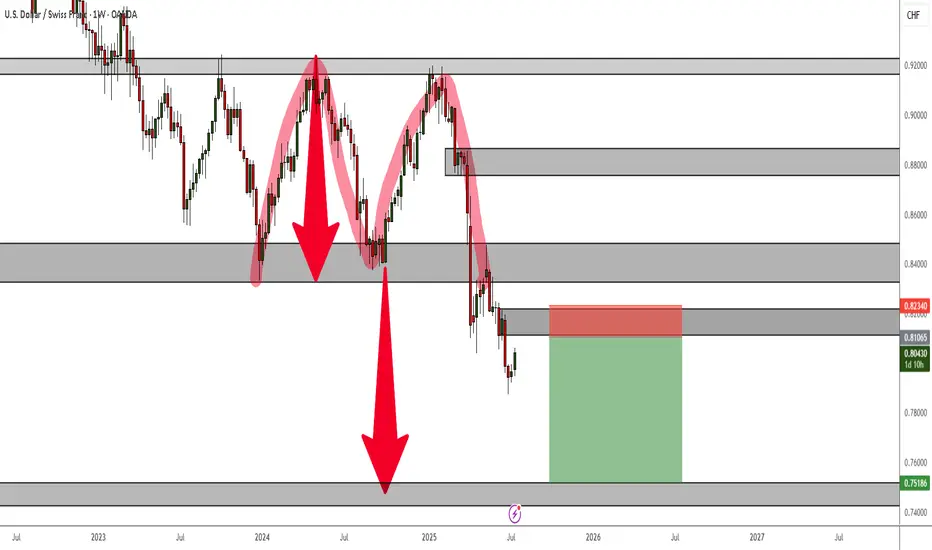
USDCHF Double Top Rejection - Bearish Setup for Long Term TradeA Double Top Rejection on the weekly TF is currently at play and despite the current bullish correction, the trend is still very much bearish.
For long-term or position traders, this is an ideal setup to take and hold.
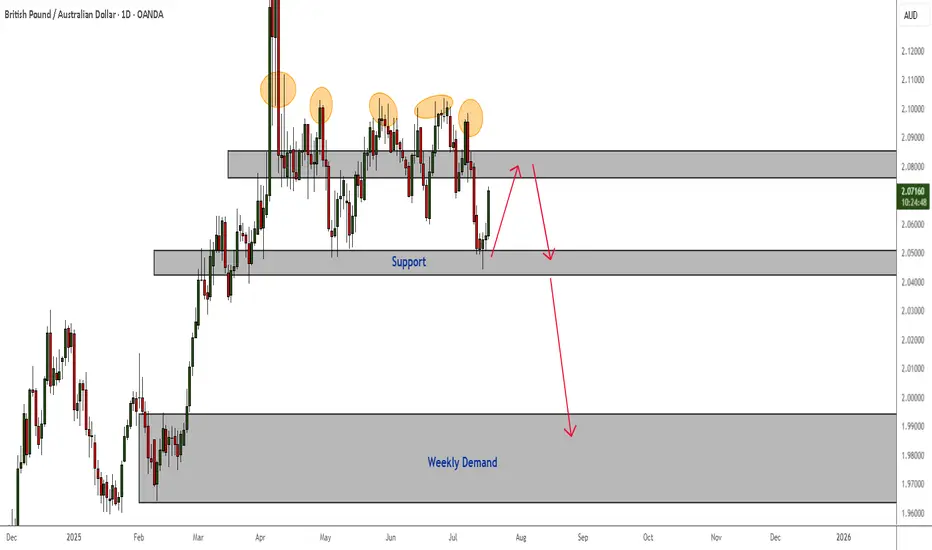
GBPAUD Downward Pressure - Bearish Confirmations Swing TradeAlthough price has been consolidating between a daily resistance and support, I am currently seeing multiple rejections in resistance and bearish candlestick patterns that indicate pressure to the downside will soon follow.
A rejection in the current highlighted resistance and a break of support will take price to weekly demand. Always wait for the right confirmations - especially when price is range-bound like it is now.
BONKUSDT: Bullish Setup Brewing! Are You In?#BONK is flashing strong bullish signals on the 1D timeframe:
Double Bottom Pattern – A textbook reversal signal
Break & Retest of Key Resistance – Now acting as solid support
Price at CMP (Current Market Price) – In the ideal buy zone
This confluence of signals suggests momentum is shifting in favor of the bulls. If volume kicks in, we could see a sharp breakout toward the next resistance levels.
Trade Plan:
Entry: CMP
SL: 0.00000886
Target 1: 0.00002607
Target 2: 0.00003989
Always use proper risk management!
What’s your view on #BONK? Bullish or Bearish?
Drop your thoughts in the comments and let's discuss!
Don’t forget to like and follow for more setups!
#BONK #Crypto #Altcoins #TechnicalAnalysis #Breakout #DoubleBottom #TradingView

Double Bottom Pattern on LULU“LULU is forming a potential Double Bottom on the daily chart, with two lows around $222 (support) and a neckline at $252. The pattern suggests a bullish reversal if the price breaks above $252 with strong volume. RSI is showing bullish divergence, and the 50-day MA is converging near the neckline, adding confluence. Target: $275.50 (pattern height added to neckline). Stop loss below $215 for a 1:2 risk-reward. Watching for a breakout with increased volume to confirm.”

Hbar breaking upwar from fallingwedge/pennantAlso in a smaller double bottom setup here. *not financial advice*

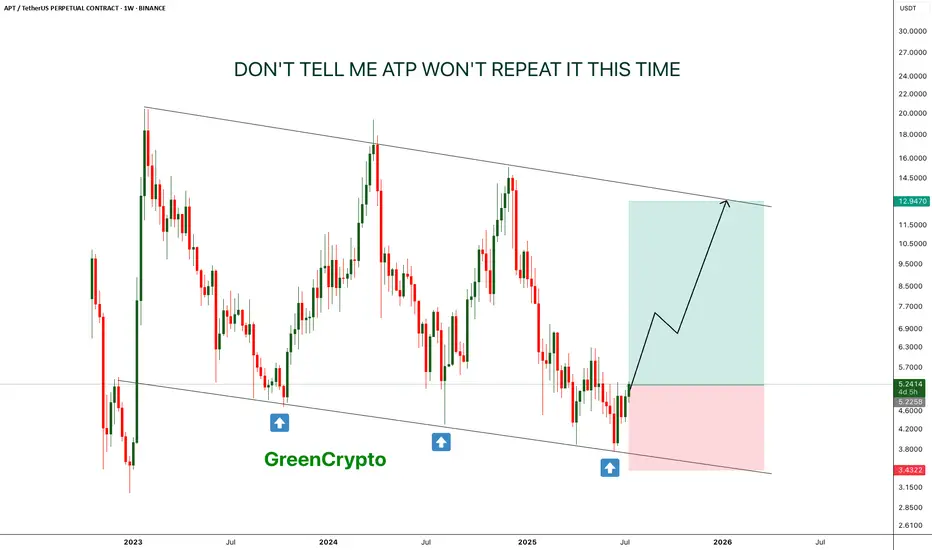
APT - Don't tell me this pattern won't repeat- This time is the charm, APT is is reversing from lower low on weekly chart.
- just like last two time, it is expect to forma new HL.
- there is a high chance that previous two patterns will repeat again
Entry Price: 5.22
Stop Loss: 3.4
TP1: 6.6632
TP2: 8.5059
TP3: 12.6945
Max Leverage: 5x
Don't forget to keep stoploss
Cheers
GreenCrypto
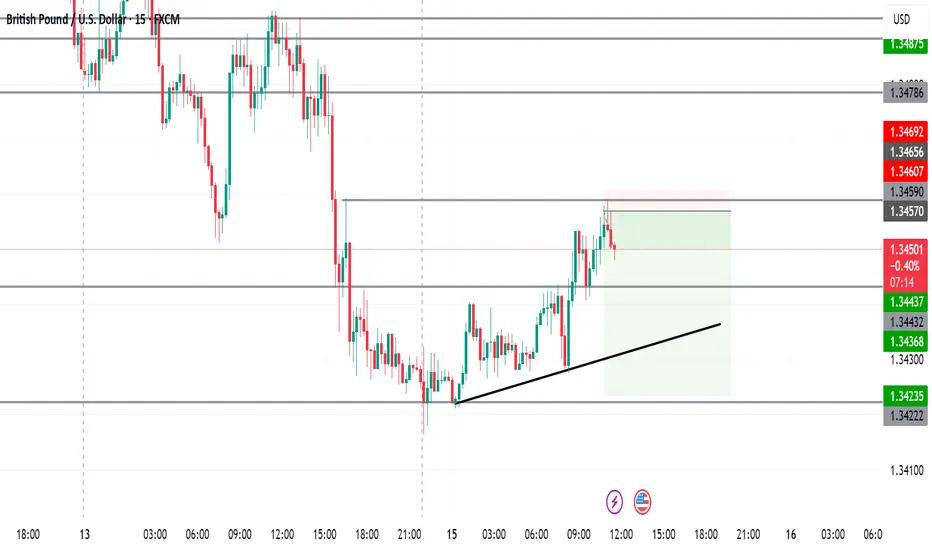
Current XAUUSD TradeDate: July 16, 2025
Platform: TradingView (Demo Account)
Timeframe: 15M (Entry), 4H (Bias/Context)
Direction: Long
Status: Entry zone identified, waiting for confirmation
Strategy Type: POI Re-entry after BOS (Break of Structure)
⸻
🔍 Market Context
• On the 4H, bullish BMS is confirmed after sweeping sell-side liquidity.
• Price has aggressively moved upward, showing intent to continue bullish.
• 15M structure now shows break of previous SND zone, shifting lower-timeframe flow to bullish.
• POI zone identified — price likely to return here for a mitigation tap before full continuation.
⸻
🧠 Trade Rationale
• POI marked as a mitigation zone for re-entry after BOS on 15M.
• Confirmation will be valid only after price closes above the wick (shows strength).
• Expecting return to POI to mitigate imbalance or unfilled orders.
⸻
📍 Entry Criteria
• POI zone: between ~3,327 and 3,316
• Watch for:
• Bullish SFP (swing failure pattern)
• Bullish engulfing candle
• 15M BOS + higher low confirmation inside POI
• Entry trigger: Price must close above the wick, then return to POI with bullish reaction
⸻
🧾 Management Plan
• Stop Loss: Below POI (~3,316 or slightly lower)
• Take Profit: 3,492 (upper 4H imbalance zone)
• Trail stop based on 15M structure if price accelerates
⸻
😌 Emotional Reflection
Comfortable identifying refined entry after HTF structure shift. No FOMO — POI must react cleanly and respect my conditions.
⸻
✅ Reflection Questions
• Did I wait for the proper 15M BOS before marking my POI?
• Did I define my confirmation model clearly?
• Will I enter only if the wick is closed above and POI is respected?

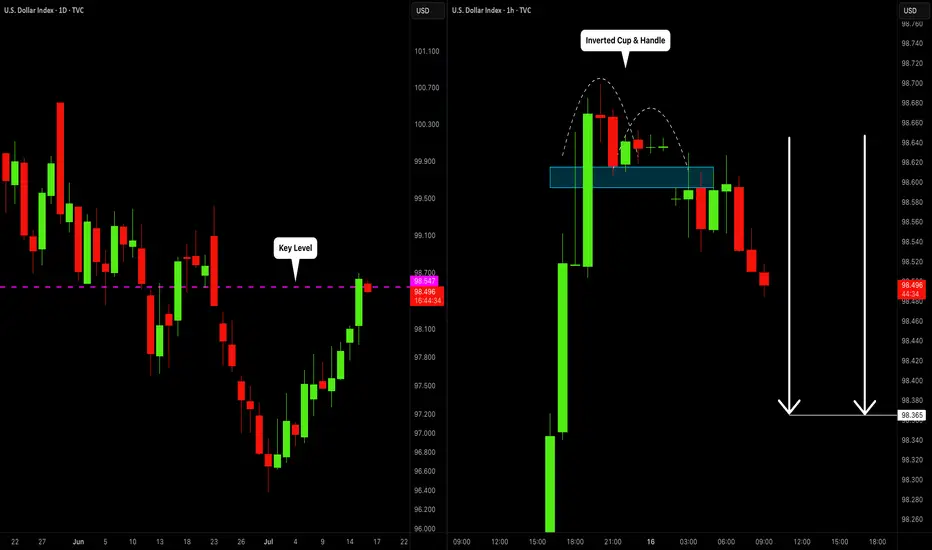
DOLLAR INDEX (DXY): Bearish Move From Key Level
I think that Dollar Index may drop from a key daily horizontal resistance level.
As a confirmation, I spotted an inverted cup & handle pattern on an hourly time frame
and a bearish violation of its neckline.
The market will most likely continue falling at least to 98.36
❤️Please, support my work with like, thank you!❤️
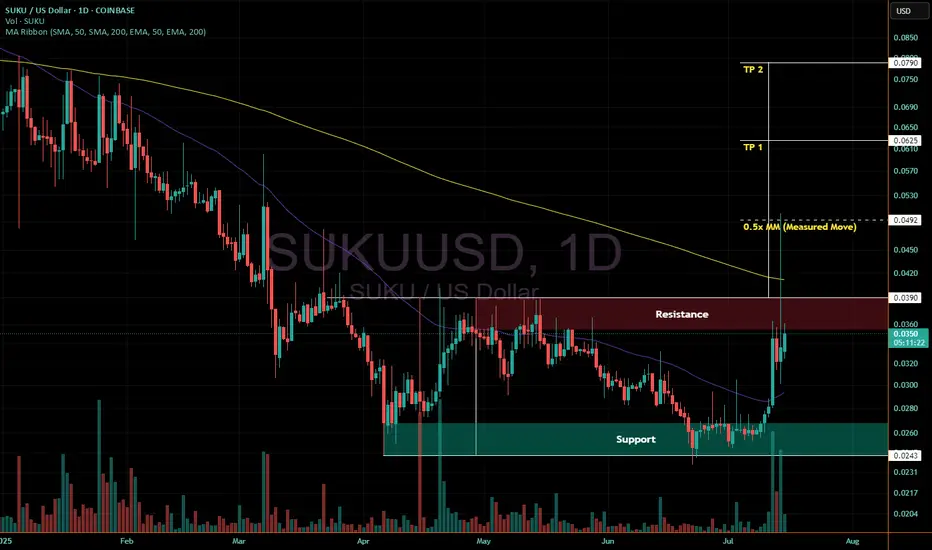
Reclaim 3.9 cents to go ~100+%Quick double bottom pattern chart for suku/usd.
It has finally seen an impulsive move up after bottoming around 2.4 cents.
That move did breach 3.9 cents and tap the 0.5x measured move towards TP 1, but hasn't yet held above 3.9 or the 200 daily EMA just above it.
It is presently pushing on resistance. As long as bitcoin holds up, a move above 3.9 and the 200 EMA that pushes on up to TP 1 and 2 seems quite likely.
If not, we may see a move back down to or even just below support for a 3rd lower low beforehand
7/15: Watch for Long Opportunities Around 3343 / 3332–3326Good morning, everyone!
Yesterday, gold rose into the resistance zone before pulling back, testing support around 3343. After today’s open, the price continues to consolidate near this support level.
On the 30-minute chart, there is a visible need for a technical rebound, while the 2-hour chart suggests that the broader downward movement may not be fully completed. The MA60 support area remains a key level to watch.
If support holds firm, the price may form a double bottom or a multi-bottom structure, potentially leading to a stronger rebound.
As such, the primary trading strategy for today is to look for long opportunities on pullbacks, with key levels as follows:
🔽 Support: 3343, and 3332–3326 zone
🔼 Resistance: 3352–3358, followed by the 3372–3378 upper resistance band

Gold Double Bottom Rejection - Bullish Confirmation PatternThere is currently a double bottom rejection pattern at play and price is reacting to an H4 TF demand zone. Confirmations to go long will be in this demand zone or the next one. But my money is on the current one.
Best thing to do is wait for an M15 supply to break to validate taking longs from the current demand. But the bulls are showing strength.

What a beautiful Wave!AARTIIND is showing a potential short-term bullish reversal after a prolonged decline, supported by RSI momentum, moving average crossover, and rising volume. A breakout above ₹486 could give a further rally toward ₹490+ Bullish Bias (If price sustains above ₹454):
Target: ₹486 → ₹492
The push will take place once the price moves above the 50 SMA - ₹474. Two cross overs have been executed. The third should bring smiles. Unless external forces act otherwise this should be an interesting trade. The rising volume speaks volumes.

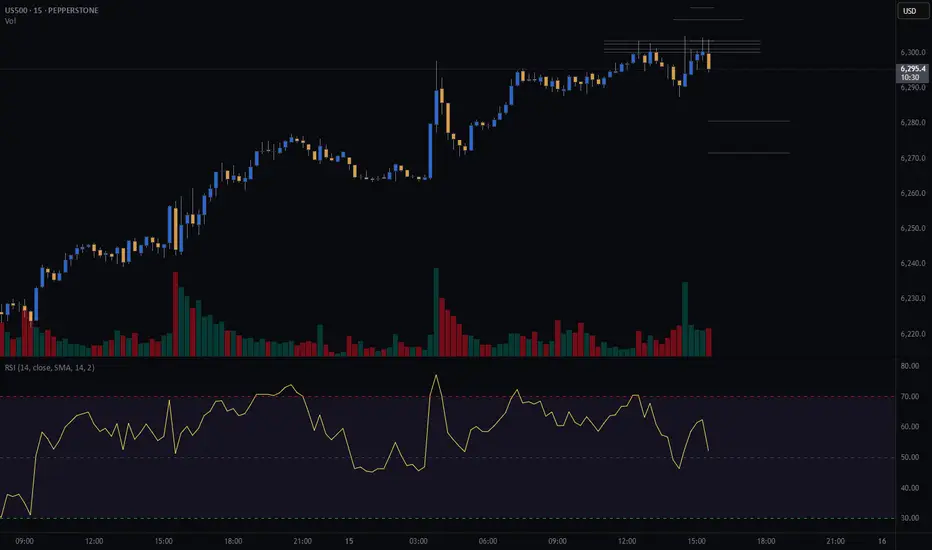
S&P500 (CASh500) Short - double top 15minEntry = 6303.4
SL = 6312.8
Take profit level 1 = 6280.7
Take profit level 2 = 6271.6
GBPUSD London PlayWhat I see and what I am in, already 1:3RR and will keep an eye for news in 2 hours as well as the lower levels marked