Bitcoin End of 20258 Bullrun price EstimationFor a long time now (since 2017) I've been observing and analyzing Bitcoin.
My previous long-term predictions were accurate regarding the time of happening, so with that in mind, the end of this bull run should start in October of 2025.
The price is unknown to anyone but as for the logarithmic scale we should be getting 200k
If we're lucky 300k and if everyone goes crazy on Bitcoin then 400k or even more would be possible.
I rather stay in a more realistic range and look for 200k as a great point to start the exit.
Double Top or Bottom

GBPJPY: Bearish Move From Resistance 🇬🇧🇯🇵
GBPJPY looks bearish after a test of a recently broken horizontal resistance.
A double top pattern on that on an hourly time frame leaves strong
bearish clues.
The pair may retrace at least to 189.9 level.
❤️Please, support my work with like, thank you!❤️

Bitcoin - preparing for a Mega bullish waveThe weekly chart is bullish for Bitcoin.
It shows a hidden bullish divergence on RSI, indicating that the price trend is likely to continue upward.
Additionally, the chart highlights a double bottom pattern on HTF.
Bitcoin maintaining support at 0.786 Fibonacci will give it the momentum needed to create a new high.
A new all-time high (ATH) for Bitcoin is expected in the coming weeks.
Best regards Ceciliones🎯

Gold is still strong buyGold is still showing strong buying power and today we might see it reaching higher new prices.
It’s safe to buy gold today and hold till next week.

ETHUSD and Crypto Signaling Risk On?So typically for equities I use the one hour, but when it comes to crypto being that a trading day is 4x a typical day for equities, I use the 4 hour. The one thing about my momentum indicator, is that forward testing has indicated that the longer a trade survives, the more likely it is to win! This one looks like we have a double bottom in the works as it approaches the neckline. If it can breakout, instead of testing that take profit, we are likely to smash thru it. I guess patience pays...
The signal was created by the King Trading Momentum Strategy combines the 5 EMA crossing above the 13 EMA, RSI strength, favorable momentum as measured by ADX plus evaluating recent volume changes and even something that measures breakout momentum called Beta for some equities! ETHUSD and over 100 equities are built into this script, as well as, BTCUSD and SOLUSD with optimal backtest take profits and stop losses and can be toggled on by simply checking a box (default they are turned off). I always enable Using Bar Magnifier and On Bar Close in Properties.

The SECRET to BULLISH CHART PATTERNS | EducationBullish chart patterns play out towards the upside... atleast most of the time.
In some cases, a bullish pattern forms - seemingly strong- but ends up going the complete opposite direction. There is a way to navigate this very frustrating outcome - by waiting for confirmation.
Through waiting a little longer, you will surely reduce the profits - but this greatly reduces the risk of playing a "failed" pattern.
Keep a close eye on this bullish chart pattern forming on SUI:
__________________________

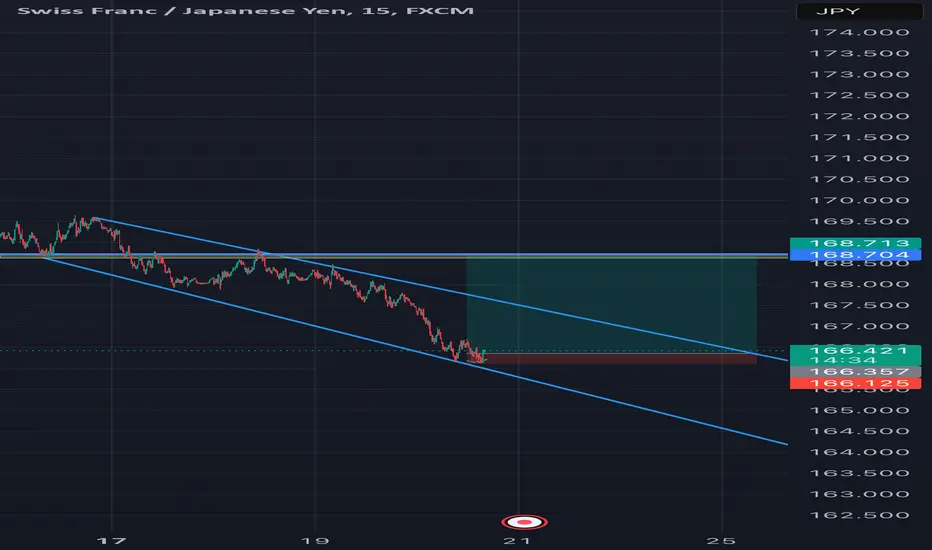
CHF/JPYIn this chart, I present an analyst with a reward-to-risk ratio of at least 1:10. Here are three conditions that support the reversal:
1. We have a double bottom pattern, which is a reversal pattern.
2. We have a divergence between the indicators.
3. We have a bullish engulfing candlestick, which means the price has reached the bottom.
That’s just my opinion, and I may be mistaken. Ultimately, it’s up to you to form your own opinion and make your own decisions. Please trade safely. I’m not a financial advisor.
Is HOOK About to Bounce or Break? Critical Levels to watch!Yello, Paradisers! Are we on the verge of a bullish move with HOOKUSDT, or is a breakdown lurking around the corner? Let’s dive in!
💎HOOKUSDT is currently sitting at a key support zone, and the probability of a bullish bounce from this level is high. However, probabilities in trading are never guarantees, so here’s what you need to watch for to confirm the next move.
💎If we see a bullish I-CHoCH (Internal Change of Character) or classic bullish patterns like the W pattern or Inverse Head and Shoulders on lower timeframes, the chances of a bounce will increase significantly. These patterns indicate that buyers are stepping in at these critical levels.
💎We also need to watch TOTAL2 (the altcoin market cap excluding BTC) and TOTAL3 (altcoin market cap excluding BTC and ETH). These broader market indicators provide context for altcoin sentiment and help avoid making isolated decisions based solely on one chart. Remember, the crypto market moves as a system — you can’t ignore the bigger picture!
💎If the price breaks down and closes below this strong support zone, it will invalidate the entire bullish setup. In that case, waiting for more clear and confident price action before jumping in will be the smarter move. Chasing trades after a breakdown can lead to unnecessary losses, and patience is what separates professional traders from gamblers.
🎖 This is exactly why discipline and patience are your most powerful tools in this market. If the bounce comes, it could be highly profitable, but don’t let emotions drive your decisions if the price breaks down. Staying objective and waiting for confirmations is what makes long-term winners.
MyCryptoParadise
iFeel the success🌴

#ID/USDT#ID
The price is moving in a descending channel on the 1-hour frame and is adhering to it well and is heading to break it upwards strongly and retest it
We have a bounce from the lower limit of the descending channel, this support is at a price of 0.3000
We have a downtrend on the RSI indicator that is about to break and retest, which supports the rise
We have a trend to stabilize above the moving average 100
Entry price 0.3322
First target 0.3156
Second target 0.3237
Third target 0.3322

A monstrous purchase was made in FXA monstrous purchase was made in FX around midnight Eastern time last night, relatively speaking anyway it’s a very thin order book, but it may have shifted the entire balance, and now it may be almost finished printing a very powerful Similar-price double bottom on the hourly chart and surrounding time frames. I think if we start closing above this yellow trend line here then we’re off to the races once again, meaning in the neighborhood of $.30, control belonging to the weekly chart.

APA Corporation Stock Quote | Chart & Forecast SummaryKey Indicators On Trade Set Up In General
1. Push Set Up
2. Range Set up
3. Break & Retest Set Up
Notes On Session
# APA Corporation Stock Quote
- Double Formation
* (Downtrend Argument)) At 32.00 USD | Completed Survey
* 1.618 Area Retracement Configuration | Long Support Invalid | Subdivision 1
- Triple Formation
* 012345 Wave Feature & Short Set Up Execution | Subdivision 2
* 1 Area Retracement Configuration | Reversal Potential & Uptrend Bias | Subdivision 3
* Daily Time Frame | Trend Settings Condition
Active Sessions On Relevant Range & Elemented Probabilities;
European-Session(Upwards) - East Coast-Session(Downwards) - Asian-Session(Ranging)
Conclusion | Trade Plan Execution & Risk Management On Demand;
Overall Consensus | Buy

Kainos Group PLC Stock Quote | Chart & Forecast SummaryKey Indicators On Trade Set Up In General
1. Push Set Up
2. Range Set up
3. Break & Retest Set Up
Notes On Session
# Kainos Group PLC Stock Quote
- Double Formation
* A+ Set Up Short Entry Bias | Completed Survey
* (Area Of Value)) | Pattern Set Up Invalid| Subdivision 1
- Triple Formation
* (Consolidation Argument)) On Retracement Area | Subdivision 2
* Trendline 1&2 | Neutral Bias & Triangle Feature | Subdivision 3
* Daily Time Frame | Trend Settings Condition
Active Sessions On Relevant Range & Elemented Probabilities;
European-Session(Upwards) - East Coast-Session(Downwards) - Asian-Session(Ranging)
Conclusion | Trade Plan Execution & Risk Management On Demand;
Overall Consensus | Neutral

Power in the plug.A beat down stock with lots of upside potential. Plug power has had many false break outs and appears to have double bottomed. I am targeting $8 but it is possible that it could go much higher.

$NYSE:BBAI 72% Upside - Breaking double bottom resistanceLooks like NYSE:BBAI is finally breaching the double bottom resistance line.
Volume is respectable, relatively higher.
Squeeze is starting to expand
MACD and Williams %R are also flowing in the right direction.
Entry point - anything after the stock closes above $4.81
Initial Price target is ~$8
72% Upside

$NASDAQ:APPS Breaking Out on Massive Volume 73%++ upsideNASDAQ:APPS is breaking out, having closed above the double bottom pattern resistance (at $4.64).
Entry: Any point now. If you want to get it at a more affordable price point, this may retest $4.64.
Price Targets:
$8.06 to complete the Double Bottom pattern 73% upside
$9.91 to complete the Falling Wedge pattern 113% upside

$NYSE:BBAI Gapping up for the next Price TargetNYSE:BBAI broke resistance overnight of $9.94 and is now working toward its next Price Target of ~$12 - $13
$9.94 Should now become the support and we should close above it for the day even if retesting it.

BEL/USDThello friends
Considering the drop we had, now we see the formation of a double bottom, which we can expect to move the specified resistance range.
*Trade safely with us*

DOLLAR INDEX (DXY): Bearish Move From Key Level
Dollar Index looks bearish after a test of a significant resistance cluster.
I see a tiny double top pattern on an hourly, indicating a highly probable
local bearish movement.
Goals: 106.92 / 106.87
❤️Please, support my work with like, thank you!❤️

GBPNZDWe can attempt to buy GBPNZD from specified level as it break LH , also bullish divergence occur indicate that it moves upward.
SL , TP mention in chart

GOLD (XAUUSD): Consolidation ContinuesQuick update for 📉Gold.
The market is currently trading in a wide horizontal range on a 4-hour time frame.
After testing the support of the range, there was a significant bullish reaction as the price formed a double bottom pattern and broke below its neckline on the hourly time frame.
I believe that the price may continue to rise towards the resistance of the range with targets at 2916 and 2933.

NVDA Trading AnalysisLong Positions:
Buy at 138 and 132 with profit targets at 144 and 150.
Short Positions:
Sell at 148 and 152 with profit targets at 142 and 133.
Risk Management:
Ensure proper stop losses and adjust position sizes according to market volatility.
Disclaimer:
This analysis is for informational purposes only and does not constitute investment advice. Trading in financial markets involves risks and may result in losses. It is recommended to conduct your own analysis and consult with a financial advisor before making any investment decisions.

GBPCADWe can attempt to buy GBPCAD from specified level as it break LH , also triple bottom occur indicate that it moves upward.
SL , TP mention in chart.

Is SHIBUSDT Preparing for a Major Move? Yello, Paradisers! SHIBUSDT has retraced to a critical support zone and is currently consolidating, leaving traders speculating about its next big move. Could this be the setup for a bullish breakout? Let’s dive in.
💎If SHIBUSDT forms a W-pattern at this support zone, backed by a supportive trendline, the chances of a bullish rally become significantly higher. This classic pattern is often a precursor to strong upward momentum.
💎However, if the retracement continues, we can anticipate a bounce from an even stronger support zone below. To stack the odds in our favor, we need confirmation from bullish signals such as - bullish I-CHoCH (Internal Change of Character), Patterns like the W-pattern or Inverse Head and Shoulders on lower timeframes.
💎Key Takeaway: Without confirmation, any bullish setup remains speculative.
💎On the flip side, if the price breaks down and closes below the strong support zone, the bullish scenario will be invalidated. In this case, it’s prudent to exercise patience and wait for more favorable price action to develop.
🎖 Discipline Over Impulse: This is why trading requires patience and a clear strategy. Avoid emotional decisions and let the market present high-probability opportunities. Mastering this mindset is what sets profitable traders apart.
MyCryptoParadise
iFeel the success🌴
