GE Aerospace Stock Quote | Chart & Forecast SummaryKey Indicators On Trade Set Up In General
1. Push Set Up
2. Range Set up
3. Break & Retest Set Up
Notes On Session
# GE Aerospace Stock Quote
- Double Formation
* (Consolidation Argument)) | Complete Reversal Area
* ABC Flat Feature | Continuation Entry | Subdivision 1
- Triple Formation
* Pattern Reversal | Uptrend Bias & Entry | Subdivision 2
* Numbered Retracement | Long Entry & Supported Survey
* Daily Time Frame | Trend Settings Condition | Subdivision 3
Active Sessions On Relevant Range & Elemented Probabilities;
European Session(Upwards) - US-Session(Downwards) - Asian Session(Ranging)
Conclusion | Trade Plan Execution & Risk Management On Demand;
Overall Consensus | Buy
Double Top or Bottom

Rush Street Interactive Stock Quote | Chart & Forecast SummaryKey Indicators On Trade Set Up In General
1. Push Set Up
2. Range Set up
3. Break & Retest Set Up
Notes On Session
# Rush Street Interactive, Inc. Stock Quote
- Double Formation
* (Uptrend Argument)) At 7.50 USD | Subdivision 1
* 012345 Wave Count | Entry Feature Survey
- Triple Formation
* ABC Flat Wave Continuation | Subdivision 2
* Numbered Retracement | Uptrend Bias | Subdivision 3
* Daily Time Frame | Trend Settings Condition
Active Sessions On Relevant Range & Elemented Probabilities;
European Session(Upwards) - US-Session(Downwards) - Asian Session(Ranging)
Conclusion | Trade Plan Execution & Risk Management On Demand;
Overall Consensus | Buy

US30 Bearish M-Pattern Setup for Next Week Overview: Potential M-Pattern (Double Top) Formation
Analyzing the US30 4H chart, we might see a bearish M-pattern develop next week.
Here’s why:
🔹 Price Action: Rejection near the 0.786 - 0.886 Fibonacci zone suggests a potential reversal.
🔹 Bollinger Bands 📊: Price hit the upper band and is contracting, signaling a potential downside move.
🔹 RSI 📉: Falling from overbought and heading toward 40, confirming bearish momentum.
🔹 MACD ⚡: Bearish crossover happening, with the histogram turning red—momentum is shifting down.
🔹 Fundamental Catalyst: Next week’s economic events:
CPI Data (Tuesday) 🏦
Retail Sales (Thursday) 🛍️
Unemployment Claims (Thursday) 📊If inflation remains high, the Fed could maintain a hawkish stance, further weighing on US30.
🔥 Bearish Trade Plan 🔥
🔢 Entry Zone: 44,600 - 44,750 (Watch for rejection)
🔢 Confirmation:
✅ Bearish engulfing candle 🔥
✅ RSI below 50
✅ MACD maintaining bearish momentum🎯 Take Profit Levels:
TP1: 44,350 (0.618 Fib Level)
TP2: 43,950 (0.5 Fib Level)
TP3: 43,075 (0.382 Fib Level - Strong Demand Zone)
🚨 Stop Loss: Above 44,900 to protect against false breakouts ⚠
💸 Risk-Reward: Aim for 1:2 or better
Final Thoughts 🤔
If the M-pattern plays out, expect a bearish move next week. However, CPI data will be a key factor—stay flexible and manage risk!
🚀 Trade smart & stay disciplined! 🚀
Do not risk more than 1% of your account.
Comment your thoughts and follow for more cool ideas
Regards,
Nozuk
#US30 #Trading #PriceAction #TechnicalAnalysis #Forex #Indices #Nozuk

Selling SPY after signs of lost of momentumSPY has once again tested the ATH level, marking its third approach to this price zone and, once again, making a reversal candle. It feels like the market may be losing momentum, so I’ve decided to set up a bear put spread trade that would benefit from a potential decline within the next 42 days. All information is available on the chart.


NATGATE - 11 RECORD SESSION LOWS ?NATGATE - CURRENT PRICE : RM1.79
On 02 August 2024, the stock made a FALLING WINDOW . The selling pressure continues until price starts to stabilize and create a double bottom support level near RM1.65 - 1.68.
On 29 October 2024, the share price closes above the top of FALLING WINDOW resistance level indicates strong bullish momentum. At the same time, the share price also successfully closed above ICHIMOKU CLOUD (after trading below KUMO almost 3 months). This two scenario gives strong bullish outlook for NATGATE. From here, the stock continue moving upside until RM3.03 (ALL TIME HIGH) - upside movement of 40% from the breakout point on 29 OCTOBER 2024.
After reach ALL TIME HIGH, the stock made an EVENING STAR pattern. From there, the stock starts declining and makes 11 RECORD SESSION LOWS.
Here is the important points to have a look. We can expect a rebound from current price as there are some hints given by chart :
1) 11 RECORD SESSION LOWS creates an OVERSOLD situation (The record session topic is discussed by STEVE NISON in his book - BEYOND CANDLESTICK , PAGE 121 - 127)
2) The last two session was bullish HAMMER - the long lower shadows give hint that potential bottom had reached and the bears are getting tired.
3) Price bounce from the previous DOUBLE BOTTOM support level area near RM1.65 - RM1.68 indicates that the BULLS are aggresively buying the shares near the support level.
In conclusion, as a aggresive trader, this is an oppurtunity for me to buy the stock at price RM1.79 - RM1.81. If as expected the share price starts rebound higher, i would take my profit at RM1.95 (+8%) and RM2.05 (+14%). My support level will be RM1.68 (the low of bullish hammer). My time frame for trading this stock is only one month.
ENTRY PRICE : RM1.79 - RM1.81
TARGET PRICE : RM1.95 , RM2.05
STOP LOSS : RM1.68
TIME FRAME - Not more than ONE MONTH
TAYOR !

EURCAD - Bearish Double TOPHello Traders !
The EURCAD price formed a double top pattern.
Currently, The neckline is broken !
So, I expect a bearish move📉
______________
TARGET: 1.47880🎯

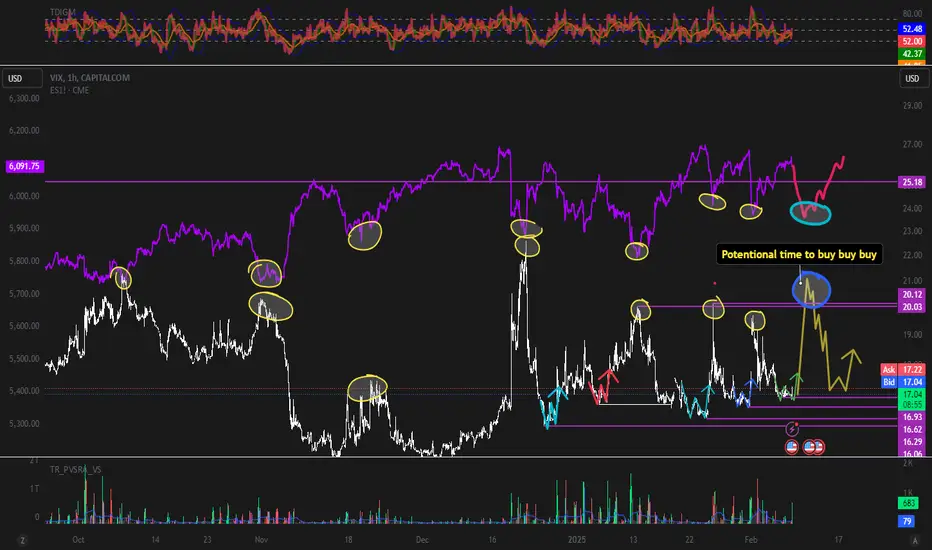
VIX & SXP There is some W on actual lows in VIX , so if it will play out ...It will be next higher low on VIX. It could lead in to higher high. Time will show how markets react on today employment data .I think it was little bit pro inflation with can lead in to stronger DXY situation ...
Short1.DoubleTop formed
2.Major timeframe resistance
3.Tp-1: Upper Neckline level
4.Tp-2: Lower nickline level
5. Aud currency forming a rising wedge

Bullish for NFP news Good is showing and trapping shorts as gold looking for reaching new high. Wait for 5 min of bullish candle close above the zone.

NODE COIN PUMP SOON?As wee can see it bounced 3 times from the trend line indicating momentum of buyers also Spot is recommended for this coin. if you want futures you must have a good risk management. Anyways my stop loss is indicated if the stop loss is hit bearish scenario is expected.

Different Types of W Patterns and How to Trade ThemHello dear KIU_COIN family 🐺 .
Recently, I decided to provide some educational content for you, my dear audience, and introduce some essential and basic trading terms.
Here’s what you should know: In these lessons, we will cover three different seasons:
🔹 Season 1: Reversal and continuation patterns.
🔹 Season 2: How to use RSI and other indicators to find good entry points.
🔹 Season 3: Definitions of Fibonacci and seasonality in trading.
Stay tuned for valuable insights! 🚀
✅ For the first section of 🔹 Season 1 , I’ll be covering W patterns— a well-known bullish reversal pattern :
As you can see in the chart above, we usually have three types of W recovery patterns , which are the most important ones for us. However, in this section, we just want to get a general understanding of them. In the upcoming section, we will learn how to trade them and explore how they actually appear on the chart and the story behind them !
✅ This is the first and most common type of W pattern:
✅ This is the second type of W pattern:
✅ This is the third type of W pattern:
Ok, guys; I think this is enough for today, and I hope you enjoyed this educational content. However, don't forget to ask your questions below and support me with your likes and follows for more of this content. 🐺🔥

BTC Dominance might fool..The world. What if this fractal/scenario plays out. Well retail wait that long for their air bags to really moon?? NFA!

SOXL Has Room to Run?This one has a double bottom look, with a higher low, and another 4% remaining to hit take profit enroute to retesting the neckline before breaking out (another 8% from here) or balance and fail! Stop loss of 5% is pretty steep, so typically I either lower my position size or stop loss. Even at 4% stop loss, according to backtest results this wins more than it loses and has done pretty decent in the past, as I have been forward testing this model for over the past 18 months and profiting from over 100 different equities that I signal on.
The King Trading Momentum Strategy combines the 5 EMA crossing above the 13 EMA, RSI strength, favorable momentum as measured by ADX plus evaluating recent volume changes! SOXL and over 100 equities are built into this script with optimal backtest take profits and stop losses and can be toggled on by simply checking a box (default they are turned off). Check out my script, as I am always looking for people to help test and I am always interested in feedback...

A price action lesson - GoldI opened a more risky trade (With lower volume for these kinds of trades). I think I got a lesson.

DOUBLE TOP NECKLINE BREAKOUTThe analysis showed that the Market formed Double top and a breakout occurred on the Neckline and now it's being retested meaning if the candlesticks closed bullish on the Neckline(retest) there's a high chance the market will go down so get your sells ready👍

EURNZD - SELL ( Double Top )Well We Can See A Scenario Of A Sell Side In EURNZD. Lets See What Happens, Price Action Is Really Following Good....

S&P500 INDEX (US500): Bearish Move From Resistance
Amid the uncertainty caused by the recent actions of Trump,
US500 may continue the intraday bearish movement.
The market may reach at least 5994 level soon.
❤️Please, support my work with like, thank you!❤️

TRADE RECAPmonthly = bearish
weekly = bearish
daily = bullish
h4 = bullish
h1 = bullish
15 = bullish
5m = entry buy

$BTC Bearish Trend next 6-8 monthsPosting what I see, as I always do, based on technicals. Sure, fundamentals are all bullish but we have all seen bullish fundamentals like ETF's become top signals. I will say $TRUMP coin was a massive top signal; add to that Michael Saylor on the cover of Forbes, and there are plenty of other things imho, but technicals are all I care about.

Chinese Technology Stock Quote | Chart & Forecast SummaryKey Indicators On Trade Set Up In General
1. Push Set Up
2. Range Set up
3. Break & Retest Set Up
Notes On Session
# Chinese Technology Stock Quote
- Double Formation
* 1st Trendline | Short Set Up | LL & LH's
* 2nd Trendline | Entry Bias | Subdivision 1
- Triple Formation
* (Downtrend Argument)) | Entry Feature | Subdivision 2
* (Open Trade)) | Pattern Target Hit | Subdivision 3
* Daily Time Frame | Trend Settings Condition
Active Sessions On Relevant Range & Elemented Probabilities;
European Session(Upwards) - US-Session(Downwards) - Asian Session(Ranging)
Conclusion | Trade Plan Execution & Risk Management On Demand;
Overall Consensus | Buy

LINKUSDT: Bullish Setup or Breakdown Ahead?Yello, Paradisers! Could this head & shoulders structure spell trouble for LINKUSDT? Or is the market setting up for a bullish reversal?
💎LINKUSDT appears to be showing signs of a retracement due to its head and shoulders pattern. If the price retraces to the identified support zone and presents a bullish I-CHoCH, W-pattern, or inverse head and shoulders on lower timeframes, the probability of a significant bullish move increases.
💎However, if the price drops further to sweep below the current zone (inducement), it’s prudent to wait for confirmation at the strong support zone. Although reaching this level might seem unlikely, if the price does drop, it would strengthen the likelihood of a bullish rebound. In this case, watch for bullish patterns such as I-CHoCH, W-patterns, or inverse head and shoulders to form before taking any action.
💎On the flip side, if a breakdown occurs and the candle closes below the strong support zone, this would invalidate our bullish outlook. In such a scenario, patience will be key—waiting for better price action and clearer market structure before considering the next move.
🎖 As always, the disciplined and patient approach wins in this market. Stick to the plan, follow the confirmations, and trade smart, Paradisers!
MyCryptoParadise
iFeel the success🌴

Is PYTHUSDT About to Explode or Break Down?Yello, Paradisers! PYTHUSDT is shaping up nicely after forming a W pattern at a key supportive trendline. But the real question is—will the price hold and push upward, or is a breakdown lurking just around the corner? Let’s break down the critical levels and scenarios you need to watch closely.
💎If PYTHUSDT breaks above the resistance level and closes a candle above it, the odds of a bullish move increase significantly. This breakout would confirm the W pattern, signaling potential upside momentum.
💎There's still a risk that PYTHUSDT could retrace further before any bullish breakout happens. If the price drops lower, it could be a liquidity grab (inducement) to shake out weaker hands before bouncing from the strong support zone.
💎In that case, it’s better to wait for the retracement to play out and then look for a bullish reaction from the strong support zone before taking any action.
💎Now, here’s the worst-case scenario: if PYTHUSDT breaks below the strong support zone and closes a candle beneath it, the bullish structure will be completely invalidated.
💎In this case, it’s better to stay patient and wait for a clearer price structure to form before re-entering any positions. Never chase the trade—we wait for the highest probability setups to align.
🎖 Remember, patience is key in trading! The market will always provide opportunities, but it’s the disciplined traders who capitalize on them. Stay focused on key levels, wait for confirmations, and don’t get caught by false moves.
MyCryptoParadise
iFeel the success🌴
