BTC , 4hr , BearishBTC is Forming a Pattern and it is at the top of the Another Pattern and It is facing rejection 3 Times from Above and now it is forming another pattern inside and Ready for Break Down of the Pattern , if it breaks the Pattern Down then it will be bearish almost 90% it will move to down side , if it has not given Breakdown and moving inside the small pattern then wait patiently and observe carefully .
Then it may also give Breakout for up side .
Follow Risk Management Properly
Follow for More Swing Ideas Like this .
Double Top or Bottom

SHORT ON SPY (SPX/USD)SPY has a double top and is currently pulling back to a supply zone.
I expect spy to drop to the next demand level or FVG to the downside.
This is a sell limit order. Waiting for price to reach the supply area before taking the sell.

GBPCAD: Bullish Continuation Ahead?! 🇬🇧🇨🇦
One of the pairs that we discussed on the today's live stream
is GBPCAD.
The price nicely respected a key daily/intraday horizontal support.
A double bottom pattern on that and a bullish violation of its neckline
provide strong bullish confirmations.
I expect up move to 1.8666
❤️Please, support my work with like, thank you!❤️
I am part of Trade Nation's Influencer program and receive a monthly fee for using their TradingView charts in my analysis.

GBPJPYTargeting 1:7 RR this trade can be risky but have good potential as Price can even Take me out ( touch me SL then go UP ) so be cautious but yes its a good trade and has reason low liquidity retailers are trying to push price below and later retailers will try to buy at Double bottom same will be done by institutional and sellers will be taken out then buyers will be taken out so it will go up then can go down than back up

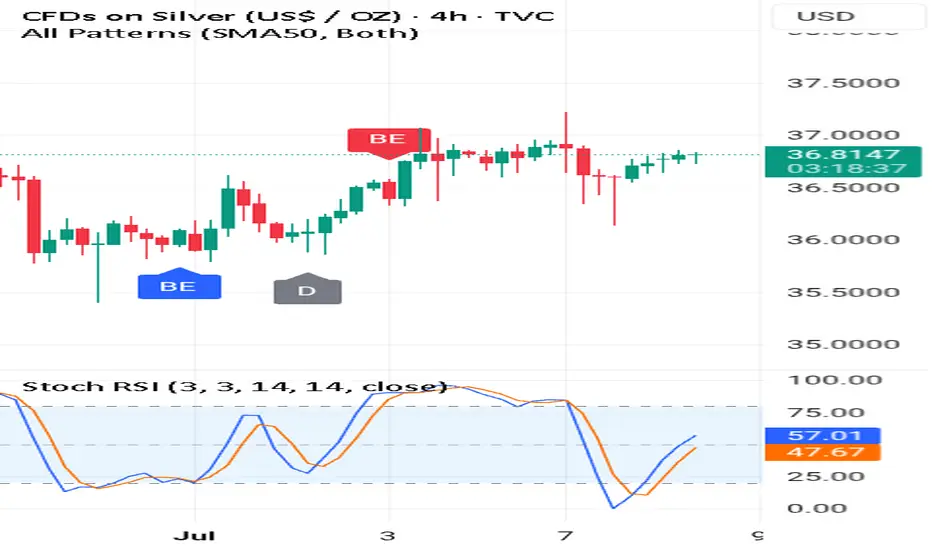
#1 Breaking News: Silver The Bullet Price Am listening to a podcast online this podcast mainly focusses on :
1-Gold
2-Silver
3-Mining Stocks
I always wondered what is it about these sectors that makes them "special"
Well I have recently mastered how to trade the double or triple tops.
And I can see why the experts in this commodity industry love double tops and triple tops.
Silver is hitting a top and has bounced from the neckline.
This is very important for you to understand.Also am using the 🚀 Rocket Booster strategy.
This strategy helps me pick the strength of the price trending.
It can also be used as a stop loss.This means you can use the moving averages for risk management.
Now I dont want you to worry too much about the technicals in this article but I just want us to have a conversation.
Sometimes technical analysis ca be boring but you will learn from conversations such as podcasts as well.
Rocket Boost This Content To Learn More.
Disclaimer ⚠️ Trading is risky please learn more about risk management and profit taking strategies and feel free to use a simulation trading account before you use real money.
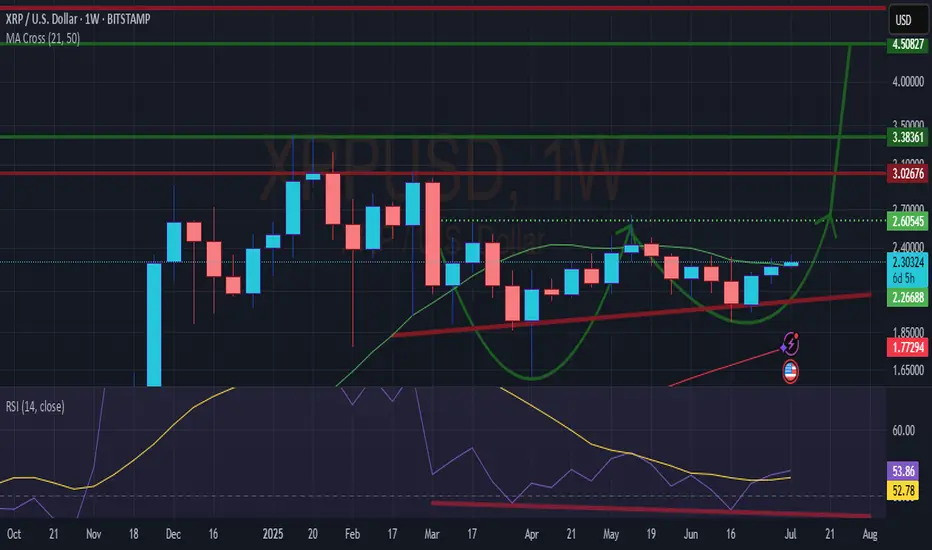
XRPUSD Double BottomHi all, looking on the weekly, this might be a larger run ahead of us.
The weekly shows a Double Bottom, With Hidden Bullish Divergence.
Should reach $4.5 according to the larger cup size, maybe $5.
The divergence makes it more probable to break out.
Not financial advice, just my next move.
Happy & safe trading.
US Equities Index – Retesting Breakout Zone After Strong RallyUS Equities Index recently broke through the 4,760.00 resistance zone with strength, but price is now pulling back slightly, possibly retesting this level as new support. The projected upside targets the 4,876.76 zone, which remains the next key resistance.
Support at: 4,760.00 🔽 | 4,650.00 🔽
Resistance at: 4,876.76 🔼
🔎 Bias:
🔼 Bullish: Holding above 4,760.00 confirms breakout structure with potential continuation toward 4,876.76.
🔽 Bearish: A breakdown back below 4,760.00 could shift bias short-term toward 4,650.00 and 4,555.95.
📛 Disclaimer: This is not financial advice. Trade at your own risk.

3 Reasons the Meta (META) Double Top Is a Buy Signal3 Reasons the Meta (META) Double Top Is a Buy Signal – Rocket Booster Strategy Explained
Meta Platforms Inc. (META) recently printed what looks like a double top pattern on the 4-hour chart.
Many traders are expecting a reversal. But from my perspective, this setup could actually be a trap for early short-sellers. Here's why.
The overall trend remains bullish. Price is still trading above the 50 EMA and the 200 EMA, which confirms that the long-term and
short-term momentum is still upward. When a double top appears in a strong uptrend but fails to break the neckline, it often
becomes a fakeout. Instead of reversing, the price consolidates, shakes out weak hands, and then breaks higher. This is where my
strategy comes in.
I call it the Rocket Booster Strategy. It works like this:
1. First, the price must be above both the 50 EMA and 200 EMA. This confirms we’re in an active uptrend.
2. Then, if a bearish pattern like a double top appears but the neckline does not break, that’s a sign of a trap.
3. We wait for price to bounce near the neckline or break above the recent top. That’s the ignition point – the rocket is ready to fire.
In this Meta setup, if price holds above the neckline or quickly reclaims the recent high, it becomes a strong buying opportunity.
The pattern fakeout acts like fuel, giving bulls the momentum to push price even higher.
This is a high-probability setup because many traders get caught
in the trap, expecting a sell-off, and their stop-losses become buy fuel for the next rally.
Trade idea:
Entry: near neckline bounce or breakout above second top
Stop loss: below the neckline or under the 50 EMA
Target: new highs and above
Final thoughts:
Don’t fall for surface-level patterns. In strong uptrends, failed double tops are often just launchpads. The Rocket Booster
Strategy helps us spot the fakeout and ride the breakout.
How 3 Simple Conditions Turn a Double Top Into a Buy Signal
Most traders see a double top and expect a reversal. But in strong uptrends, this pattern can fail — and when it does, it often sets up
a high-probability buying opportunity. Traders who use the Rocket Booster Strategy understand how to spot these traps and trade them in the direction of the trend.
Here’s how the strategy works — and why some double tops become launchpads, not ceilings.
1. Price Above Both 50 EMA and 200 EMA
When price remains above the 50 EMA and 200 EMA, it confirms strong bullish momentum in both the short and long term. In
these conditions, many reversal patterns like the double top often fail. Instead of selling off, price consolidates and continues higher.
Traders using this strategy only look for buy setups when both EMAs are pointing up and price stays above them.
2. Bear Trap Setup
A double top often attracts sellers. These traders place their stop-losses just above the highs. If price fails to break the neckline and
instead rallies above the top, those stop-losses are triggered, creating a surge in buy orders. This becomes a trap — not a
reversal — and the breakout can be fast and aggressive. The Rocket Booster Strategy takes advantage of this liquidity burst.
3. Entry After Confirmation, Not Assumption
Instead of shorting the pattern, traders using the Rocket Booster Strategy wait for one of two bullish confirmations:
A bounce off the neckline without breaking below it
A breakout above the second top after the trap is set
At that point, the trend is considered intact, and momentum is ready to continue. The "rocket" is refueled, and the strategy shifts
into entry mode.
Trade Setup Example:
Entry: Near neckline bounce or breakout above second top
Stop Loss: Below neckline or under the 50 EMA
Target: New highs and above the pattern top
Final Thoughts
In strong trends, failed double tops are not warning signs — they’re opportunities. The Rocket Booster Strategy filters out weak signals by requiring clear alignment:
price above both EMAs, pattern failure, and bullish confirmation. When these conditions align, a pattern that looks bearish on the surface becomes a fuel source for the next breakout.
Disclaimer: This article is for educational purposes only and not financial advice. Always do your own research.

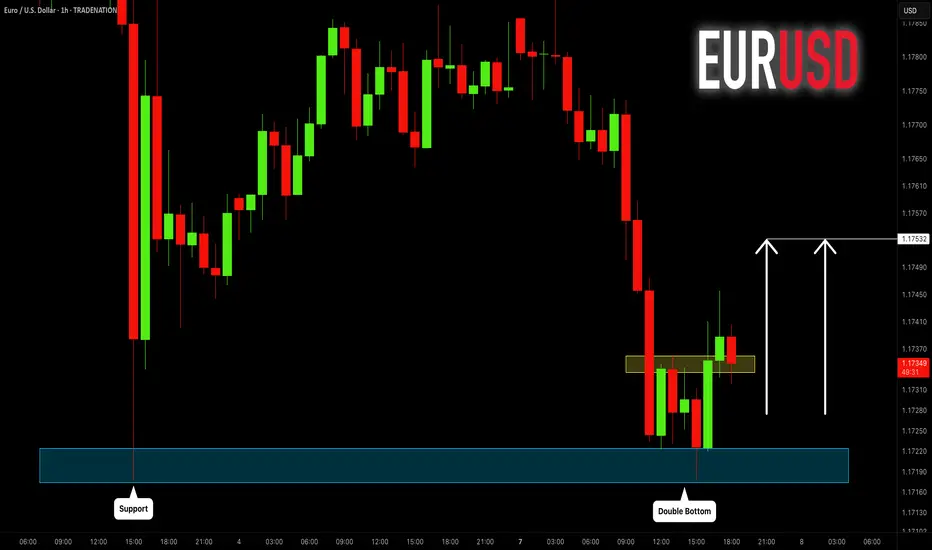
EURUSD: Another Pullback Trade for Today 🇪🇺🇺🇸
EURUSD formed a double bottom pattern on a key daily horizontal support.
Its neckline violation signifies a local strength of the buyers.
I think that the pair may move up and reach 1.1753 level.
❤️Please, support my work with like, thank you!❤️
I am part of Trade Nation's Influencer program and receive a monthly fee for using their TradingView charts in my analysis.
$EIX - Edison: Wild Fires, Double Bottom - A Trend Reversal? The decline from $88.77 looks to have completed its five-wave sequence.
Primary wave 4 (black) unfolded as a triangle, and the decline to $47.73 could be all of primary wave 5.
Primary waves 3 and 5, if the decline is complete, have created a double bottom reversal pattern.
$47.73 is the key invalidation level for the bullish outlook.

NZDCHF - Bearish Triple TOPHello Traders !
The NZDCHF price formed a triple top pattern.
Currently, The neckline is broken!
So, I expect a bearish move📉
________________
TARGET: 0.47280🎯

EUR/USD: UPDATEHello friends
Everything is clear on the chart for you, our probability is price growth until the specified areas.
In case of price decline, we have identified two support areas where you can buy.
Be sure to observe risk and capital management.
*Trade safely with us*

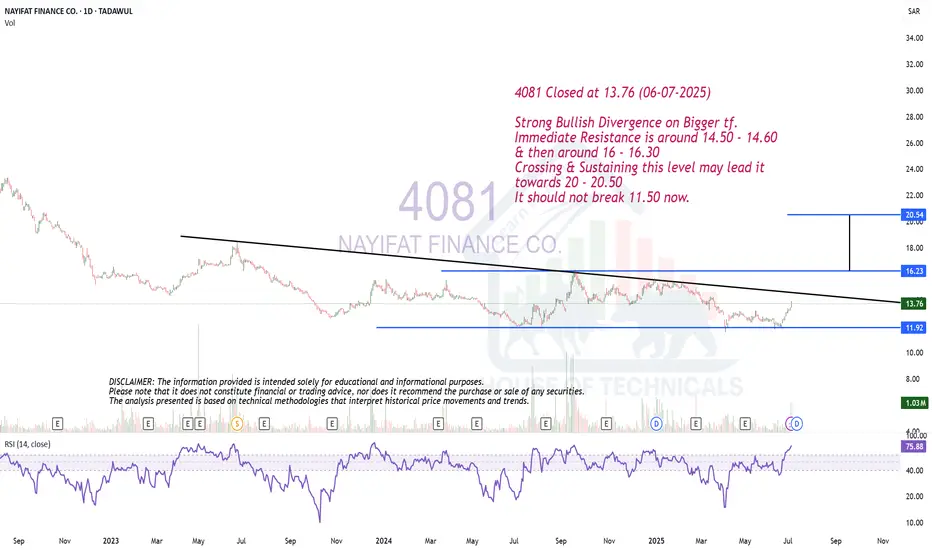
Strong Bullish Divergence on Bigger tf.4081 Closed at 13.76 (06-07-2025)
Strong Bullish Divergence on Bigger tf.
Immediate Resistance is around 14.50 - 14.60
& then around 16 - 16.30
Crossing & Sustaining this level may lead it
towards 20 - 20.50
It should not break 11.50 now.
renderwithme | XAUUSD - GOLD Pre-NFP Technical AnalysisCurrent Market ContextPrice Levels: Gold (XAU/USD) is trading around $3,341.79 as of July 4, 2025, with recent price action showing consolidation between $3,300 and $3,400 after a pullback from highs near $3,500.
Recent Performance: Gold rose slightly by 0.27% to $3,335.17 per troy ounce on July 4, supported by positive momentum from trading above the 50-day EMA. However, it has faced resistance near $3,400 and experienced low liquidity due to the U.S. Independence Day holiday.
Market Sentiment: The overall sentiment remains cautiously bullish, driven by a weakening U.S. dollar amid concerns over U.S. fiscal imbalances (e.g., Trump’s tax-cut bill adding $3.4 trillion to the national debt) and expectations of a dovish Federal Reserve policy. However, short-term volatility is expected due to holiday-thinned liquidity and upcoming economic data
# Technical Outlook
Bullish Scenario: If gold holds above $3,300 and breaks $3,353, it could retest $3,400 and potentially climb toward $3,435–$3,451. A weekly close above $3,400 would negate near-term bearish risks and signal a continuation of the broader uptrend.
Bearish Scenario: A sustained break below $3,300 could trigger a deeper correction toward $3,248 (monthly low) or $3,226–$3,203. A drop below $3,203 would challenge the medium-term uptrend, potentially opening the door to $3,150 or lower.
Range-Bound Expectation: Due to low liquidity and pending NFP data, gold may consolidate between $3,320 and $3,340 early next week, with volatility increasing post-NFP
Disclaimer --
This analysis is based on recent technical data and market sentiment from web sources. It is for informational purposes only and not financial advice. Trading involves high risks, and past performance does not guarantee future results. Always conduct your own research or consult a SEBI-registered advisor before trading.
#Boost and comment will be highly appreciated

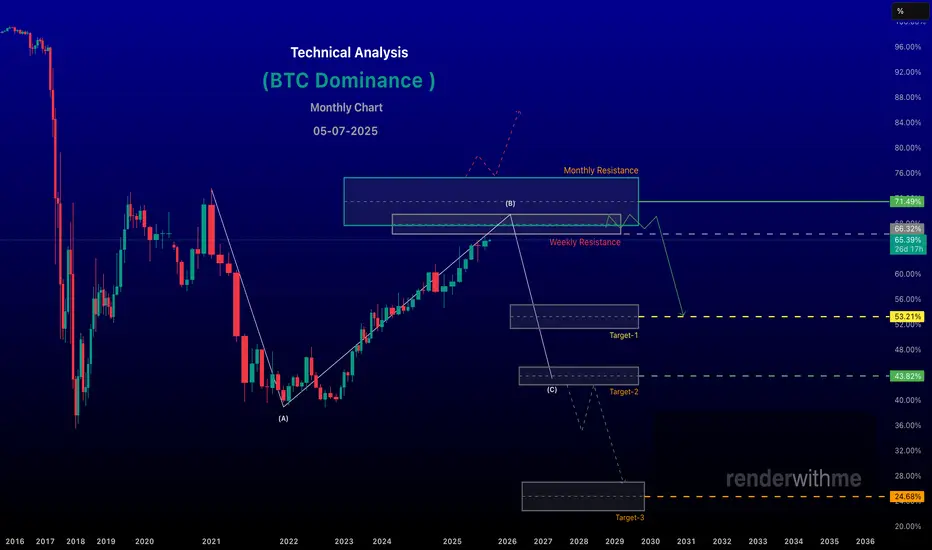
renderwithme | BTC - Dominance about to hit resistanceBitcoin dominance (BTC.D), which measures Bitcoin’s market capitalization as a percentage of the total cryptocurrency market cap, is a key indicator of market sentiment and capital flow between Bitcoin and alt coins . As of July 5, 2025, recent data and technical analysis suggest Bitcoin dominance is at a critical juncture, with potential shifts in market dynamics for the upcoming week. Below is an analysis based on current trends, historical patterns, and technical indicators.Current State of Bitcoin DominanceCurrent Level: Bitcoin dominance is approximately 64.36% to 65.68%, based on recent data .
Recent Trends: Dominance has been testing a multi-year resistance zone between 66.5% and 69.5%
Historical highs in this range (e.g., 64.34% in early 2025) have often preceded pullbacks or altcoin rallies.
Chart indicate bearish signals, such as weekly bearish divergences and potential reversal candles, suggesting a possible decline.
Technical Analysis for Next WeekResistance and Support Levels:Resistance: The 66.8%–67.2% zone is a critical resistance level, aligning with Fibonacci extensions and a long-term descending trend line. A failure to break above this could signal a reversal.
Support: Key support levels are at 61.90%–62.20%, with a potential drop to 58% if bearish momentum accelerates.
Chart for your reference
Disclaimer --
This analysis is based on recent technical data and market sentiment from web sources. It is for informational purposes only and not financial advice. Trading involves high risks, and past performance does not guarantee future results. Always conduct your own research or consult a SEBI-registered advisor before trading.
#Boost and comment will be highly appreciated
BAJAJFINSRV - A BULLISH RALLY AFTER DOUBLE BOTTOMHUHH!!
This rally is still on!! After double bottom "w" pattern it crosse300+ pts.
Now there is a consolidation phase.

USOIL - Bearish Double TOPHello Traders !
The USOIL failed to create a new higher high!
The price formed a double top pattern.
Currently, The neckline is broken !
So, I expect a bearish move📉
________________
TARGET: 64.960🎯

7/4: Trade Within the 3313–3346 RangeGood morning, everyone!
Yesterday’s intraday trades delivered solid profits. Since the U.S. market will be closed today, news-driven volatility is expected to be limited. Therefore, today’s trading focus will primarily revolve around technical setups.
Current structure:
Key support: 3321–3316
Immediate resistance: 3337–3342, followed by 3360
If support holds and resistance breaks, a potential inverse head-and-shoulders pattern may form on the 4H chart, with the next target near 3380
If support breaks, focus shifts to the 3303–3289 support zone
Given the likelihood of range-bound price action today, the suggested intraday range is 3313–3346, with a preference for selling near resistance and buying near support.
If an upside breakout occurs, consider using the MA20 on the 30-minute chart as a guide for pullback entries.

IMX — Double Bottom & Weekly RSI Div1. Buy sweep of all-time low, spot weekly RSI divergence
2. Entry: Confirm double bottom or strong bounce
3. Main target: $0.81+ (super bullish if break/hold above)
4. Stop: Below all-time low — scenario invalid

Xauusd market update This chart presents a 4-hour analysis of Gold Spot (XAU/USD) against the US Dollar, showing potential bullish scenarios based on price zones and market reactions.
Key Insights:
Current Price:
$3,353.31, slightly down 0.11%.
---
Highlighted Zones:
1. Resistance Zone (~$3,420–$3,455):
Price reacted here previously.
Marked as a potential final target for bullish momentum.
2. Mid Supply/Resistance Zone (~$3,370–$3,405):
Critical decision area.
Price might face consolidation or rejection.
3. Demand Zone (~$3,240–$3,270):
Previously respected support.
Ideal area for a bullish reversal if price dips.
---
Projected Price Paths (Black Dotted Lines):
Scenario A (Immediate Bullish):
Price consolidates above $3,350.
Breaks into the mid-zone, then pushes to $3,450 resistance.
Scenario B (Pullback Then Rally):
Declines to the $3,250 demand zone.
Rebounds strongly, breaks mid-zone, and heads for $3,450.
Scenario C (Range-bound):
Multiple bounces between $3,250 and $3,405 before a decisive breakout.
---
Conclusion:
The chart suggests a bullish bias as long as price holds above the $3,250 support zone. Breakout confirmation above $3,405 could pave the way toward $3,450+. However, a drop below the demand zone would invalidate the bullish outlook short-term.
Would you like a trading plan based on these scenarios?

USOIL Double Top Breakdown | Short Setup Alert!USOIL Double Top Breakdown | Short Setup Alert!
Hey traders! A classic Double Top pattern has formed on the 4H USOIL chart (Top 1 & Top 2), signaling a potential trend reversal. After breaking the neckline, price action confirms bearish momentum. The stop-out level is clearly marked at 70.00 , while the target zone is set around 58.00. This setup offers a great risk-reward ratio.
📍 Supertrend also aligns with bearish confirmation.
💬 Drop your thoughts in the comments section – let's discuss the trade!
❤️ If you find this helpful, don’t forget to support with a like and follow!
Stay sharp and trade safe!

We hit. We failed. Now we drop.OANDA:GBPAUD
Inside this price channel, the market is forming a flag in an attempt to break out.
But given the market cycle and three failed breakout attempts,
I believe it's time for sellers to take control.
📉 I’m siding with the bears on this one!

Political Uncertainty, Dollar Weakness & A Projected CorrectionDespite being a technical trader, there are some fundamental factors floating in the background of today's trading idea.
1) We saw weakness on the GBP today due to some political uncertainty & investors having concerns over the stability of the UK's leadership and economic direction.
2) We saw a drop in the ADP Non-Farm Employment Change for the US Dollar today which is starting to look like a trend rather than a one-off.
Why this is important is because, despite the very bearish day that the FX:GBPUSD had today, I don't think the GBP reaction is as relevant as it's shown and I do think the USD is weaker than it's shown on this particular chart, due to the reactions that we've seen on other crosses.
All in all, that this means is that I wouldn't be shocked to see today's move corrected and price is at the perfect technical level to do just that.
If you have any questions, comments or opinions, please don't hesitate to leave them below.
Akil
