EURNZD Eyes 1.99 — Technical & Fundamental Bulls AlignedToday, I want to analyze EURNZD ( OANDA:EURNZD ) for you, which is in good shape both technically and fundamentally .
Please stay with me.
EURNZD is moving close to the Support zone(1.88750 NZD-1.7970 NZD) and 100_SMA(Daily) and has managed to form a Double Bottom Pattern .
From the perspective of Elliott Wave theory , EURNZD seems to have completed the main wave 4 , and we should wait for the main wave 5 . The main wave 5 could complete at the Heavy Resistance zone(2.120 NZD-1.9927 NZD) .
-----------------------------------
EURNZD – Fundamental Analysis:
The EURNZD pair currently reflects a divergence between two very different economic outlooks.
Eurozone (EUR):
The European Central Bank (ECB) has recently begun cutting interest rates to support slowing economic activity, especially in the industrial and manufacturing sectors. Despite this dovish shift, inflation remains relatively under control, and the euro has held up well against riskier currencies thanks to global uncertainty and safe-haven flows.
New Zealand (NZD):
New Zealand's economy is under pressure. The latest GDP figures confirmed a weak growth outlook, and signs of a technical recession are mounting. While the Reserve Bank of New Zealand (RBNZ) has maintained a relatively hawkish tone, it faces a dilemma: inflation is sticky, but domestic demand and housing remain fragile. The RBNZ may be forced to soften its stance sooner than expected.
Outlook:
This fundamental backdrop supports a bullish bias for EURNZD. The euro’s relative stability versus the increasingly vulnerable New Zealand dollar makes this pair attractive for long positions — especially if upcoming NZ data disappoints or global risk sentiment weakens further.
-----------------------------------
Based on the above explanation, I expect EURNZD to rise to at least 1.9917 NZD .
Note: Stop Loss(SL): 1.8779 NZD
Please respect each other's ideas and express them politely if you agree or disagree.
Euro/New Zealand Dollar Analyze (EURNZD), Daily time frame.
Be sure to follow the updated ideas.
Do not forget to put a Stop loss for your positions (For every position you want to open).
Please follow your strategy and updates; this is just my Idea, and I will gladly see your ideas in this post.
Please do not forget the ✅' like '✅ button 🙏😊 & Share it with your friends; thanks, and Trade safe.
Double Top or Bottom

6/24 Gold Analysis and Trading OutlookGood morning, everyone!
Gold closed yesterday with a T-shaped candlestick. Although there was an intraday recovery after briefly breaching the MA20, the closing price remained below the MA5, indicating continued pressure on the upside.
Today’s opening saw a direct drop in price, suggesting a potential break below key support. Two important levels to monitor today:
Whether the closing price stays above 3355
Whether the intraday support at 3328 holds
If 3328 breaks down, the 3300 level may become the next major battleground between bulls and bears.
Driven by geopolitical news, gold has shown sharp volatility over the past two days. While this increases trading risk, it also presents more opportunities. From a technical perspective, today’s strategy should prioritize selling on rebounds, with buying at lower levels as a secondary approach. As always, stay disciplined and manage risk effectively.

GBPCHF: Pullback From Support 🇬🇧🇨🇭
GBPCHF is going to pull back from a wide daily support cluster.
I see a strong intraday bullish confirmation and a bullish
imbalance candle after the news.
Goal - 1.0986
❤️Please, support my work with like, thank you!❤️
I am part of Trade Nation's Influencer program and receive a monthly fee for using their TradingView charts in my analysis.

GOLD (XAUUSD): Intraday Bullish Confirmation
Gold is retesting a recently broken trend line of a bullish flag
pattern that I shared with you earlier.
A double bottom pattern on that and a violation of its neckline
provide a strong intraday confirmation.
I think that the price may rise to 3392 level.
❤️Please, support my work with like, thank you!❤️

EUR/USD analysis and pending orderTwo days ago, there was a FED meeting, where it was stated that the benchmark interest rate will be kept at 4.25-4.50% level.
What is important is what they told - the expectations - economicp rojections are lower, and inflation is higher.
Maybe they’ll decrease rates in future?
Right now, it’s not so important. It’s summer already, and by the old “Sell in May, and go aways” mentality, I don’t expect some huge impact on the market.
I know… Iran, Israel, Trump, maybe even Putin? Anybody can do some stupit stuff and everything can go to Hell.
And it’s Friday, not very smart time to open trades, so I’m putting pending order.
I decided for EUR/USD.
Timeframe is 4h.
On my chart I can see clear uptrend in the last couple of weeks, especially in the last 3 months.
Also, I see lower highs.
Upward trend is breached… Where it could stop?
Overall, I don’t expect the pair will come near parity, even though ECB lowered rates before FED did.
But some “selloff”, probably.
I used good old Fibonacci, draw it, and the price could potentialy drop to 50% level or even ideal 61…8%-78.6% zone.
Pending entry: 1.15577
TP: 1.12645
SL: 1.1671
If it activates today, I’ll leave it over the weekend.

TOTAL 2 Analysis (6H)The TOTAL2 chart — representing the altcoin market cap excluding Bitcoin — currently shows signs of weakness. A double top formation has emerged and is actively playing out. In addition, a micro trend change of character has clearly appeared, further validating short-term bearish pressure.
Technical Observations:
Price recently retested a broken support level and failed to reclaim it — a typical bearish confirmation.
In such scenarios, it’s common for the price to decline at least the depth of the double top formation.
However, it’s important to note that macro trend indicators still remain bullish, so entering aggressive short positions is not advised. Instead, consider setting alerts at the key reversal zones marked on the chart — these levels are likely to trigger a strong rebound.
If TOTAL2 breaks above the $1.23T resistance, this double top analysis becomes invalid.
— Thanks for reading.

GOLD (XAUUSD): Bullish Confirmation SignalI observe two solid bullish signals on 📈GOLD following a pullback to a recently violated key horizontal support.
The price has risen, breaking through both the neckline of a double bottom pattern and the resistance line of a falling wedge pattern.
We can expect a bullish trend towards a new higher high.

#Btc Breakdown Begins: Double Top + Iran-Israel Tensions = CrBitcoin has clearly formed a double top pattern and is currently hanging near the critical 100K support. If this level breaks, we may first see a fall to 90K, followed by a deeper decline toward 73.5K. If that too fails to hold, the market could slide drastically to 64K–45K zones. The pattern indicates Bitcoin is exiting the distribution phase, with profit booking at aggressive levels.
The Iran-Israel conflict, intensified by U.S. involvement, has triggered panic and short positions across the market. This is a high-risk environment, and long entries could be dangerous right now. Caution is advised — we are entering a potentially sharp correction phase.

IHSG / COMPOSITE (IDX) DAILY CHART DOUBLE TOP DETECTEDIHSG going to close the gap at 65xx.. (first gap).
the worst case IHSG will close the 2nd gap (61xx) << Mostly happened.
after that we hope IHSG will start to Bullish once more.
so just wait n see for now. After IHSG closing all the gap, we can start buying all the bluchip stock like banking sector (BBRI, BBCA, BMRI, BBNI).

Birlasoft Ltd (BSOFT) – Long-Term Technical Analysis (TF-1D)📊 Chart Pattern Observed:
• The stock is forming a symmetrical triangle pattern, a consolidation pattern often leading to a breakout.
• Points A-B-C form higher lows, showing long-term support.
• The upper resistance lies near ₹739.90, indicating a potential breakout target.
⸻
📉 Current Price:
• ₹421.40, which is just above the highlighted “Best Buying Range” zone.
⸻
🟨 Best Buying Zone:
• Marked between ₹387.25 and ₹351.25.
• This zone is close to the lower trendline support (rising support), making it an ideal accumulation level.
⸻
📈 Upside Potential:
• If the stock sustains above the trendline and continues the triangle structure, it may head toward the ₹739.90 level.
• A breakout above ₹739.90 could trigger a strong upward move.
⸻
🔍 Momentum & RSI:
• The RSI is at 43.28, which is near the lower end — suggesting the stock is neither overbought nor oversold.
• Good for long-term entry if bullish confirmation appears.
⸻
📌 Key Support Levels:
• ₹387.25 (first support)
• ₹351.25 (strong support)
🚀 Key Resistance:
• ₹739.90 (major breakout level)
⸻
📝 Conclusion:
Birlasoft is currently in a long-term consolidation phase within a symmetrical triangle. The current price is above a strong support zone, making it a good risk-reward entry for long-term investors, especially between ₹387–₹351. A breakout above ₹740 could signal a major bullish rally.
⚠️ Disclaimer:
This analysis is for educational purposes only. I am not a SEBI registered advisor. Please consult your financial advisor before making any investment decisions.

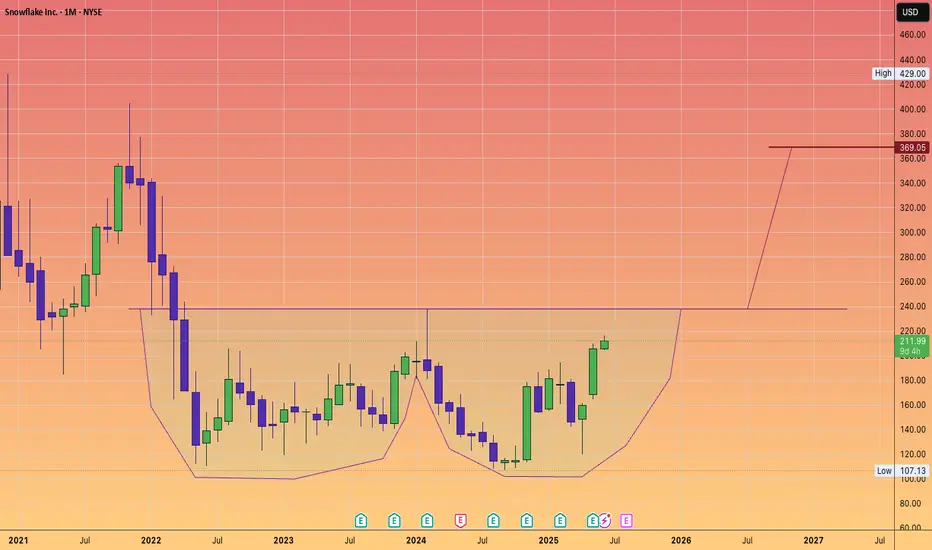
SNOWFLAKE to $369Snowflake Inc. is an American cloud-based data storage company.
Headquartered in Bozeman, Montana, it operates a platform that allows for data analysis and simultaneous access of data sets with minimal latency. It operates on Amazon Web Services, Microsoft Azure, and Google Cloud Platform.
As of November 2024, the company had 10,618 customers, including more than 800 members of the Forbes Global 2000, and processed 4.2 billion daily queries across its platform
#DoubleBottom
#Wformation
HYPE Long-short-Long planHYPE is good for the short-term long-position at this moment, as it could go as far as 40 from 34.18 to form a Second shoulder.
But it will not sustain over there, and will come down to 22.
There could be another possibility that it may come between 28-29 and form shoulder 2, and then come back to 22.
I will only enter a long position when it takes support from 28 or 22.
Future traders may see short opportunities near 40-41. You will have to wait for price rejection at 40-41.
If it fails these 2 support areas, then I will look for 15-16.

AMAZON TROUBLENASDAQ:AMZN Is currently trading Just 11% below its all time high and currently Facing exhaustion.
Amazon is currently trading 217$ range which was previous support now turned resistance (Daily Timeframe) , making a double top pattern and a negative divergence on the RSI.
The best Trades are the ones with multiple confirmations
- Trading at a resistance (1D chart)✅
- Negative Price Action at the resistance (Double Top Pattern)✅
- RSI negative divergence✅
- Market Structure ✅
Entry Criteria
- A Red candle at the entry Line Marked
- Stoploss Above the Entry Candle
Target 1- 211$
Target 2- 208$
Keep Your Risk Reward Intact! Not An investment Advice

EURUSD BuysWe have reached a HTF support level. On the lower timeframe we have a double bottom with a bullish engulfing candle giving us the confluence needed to enter the trade.

Crypto consolidating ahead of rally towards All Time HighsWith US equity markets closed for Juneteenth, I'm checking in on an equal weight basket of cryptos. Recently I said crypto looked to be heating up for a run at new highs.
As I look today, prices appear range bound on the daily chart. There's a bearish double-top formation, beside declining momentum. The bottom of the range resting at the 200 Day Moving Average, and a test of it seems likely.
Should there be a bounce off the 200 Day SMA, and a break through the top end of the range we might get a shot at those new All Time Highs.

EURUSD - Bearish Double TOPHello Traders !
The EURUSD failed to create a new higher high.
The price formed a Double TOP pattern.
Currently, The neckline is broken !
So, I expect a bearish move📉
_____________
TARGET: 1.13995🎯

Gold — Awaiting Clarity at the Neckline (FRL Setup)“Trading is capital management under uncertainty. The red horizontal zone is the zone of uncertainty. Neckline levels are rubicons — thresholds where the market becomes clear to us. Don’t fear uncertainty. Learn to wait for the moment when everything becomes clear.”
Right now, gold is forming an upward trend. But as we know, every trend consists of impulses and corrections — and each of those is a trend of its own.
According to Fractal Reversal Law (FRL):
• Every structure ends with a reversal pattern.
• A neckline is always strictly horizontal and defined by the last impulse’s top.
• The MA100 tells us the scale we’re working with — helping us select the right timeframe to confirm.
🔍 In this setup:
• A potential reversal pattern is forming.
• The neckline coincides perfectly with the MA100 — a strong alignment of structure and scale.
• We also see early signs of MACD divergence, suggesting loss of bearish momentum.
Neckline levels: 3400 for a Double bottom and 3300 for a Double top.
✅ What to wait for:
• A full-bodied candle close above the neckline (not just a wick).
• This signals the end of correction and potential beginning of a new impulse.
🎯 Target:
• Measure the height from the neckline to the bottom of the correction.
• Project it upward from the neckline to estimate the first profit target.

USOIL - BULLISH MOVE !Hello Traders !
Previously, The USOIL price formed a double bottom pattern.
Currently, The resistance (71.280 - 72.252) is broken !
So, I expect a bullish move🚀
______________
TARGET: 77.200🎯

BTCUSD potential double top patternOn the daily chart, BTCUSD forms a potential double top pattern. Currently, we can pay attention to the support near 100400. If it falls below, it is expected to continue to fall, and the downside target is 94000-98000 area.

EURUSD 1H is forming a Potential Bullish Reversal pattern
Price formed a Potential Double Bottom pattern with a neckline as current Temporary Resistance.
• ✅ Entry is triggered only after a confirmation candle breaks above the neckline.
• Buy Stop is placed around the neckline to catch the momentum move.
• Stop Loss is at the recent lower Low (safe and logical placement).
• 🎯 Take Profit levels are based on measured move projections.
Trade Plan:
• Buy Stop = 1.15264
• Stop Loss = 1.14552
• Take Profit 1: 1.15960
• Take Profit 2: 1.16663
• Lot size : 1:2 Risk Reward Ratio
“Waiting for neckline to break with Bullish confirmation candle” – this ensures you enter only on strong momentum.
EURUSD is forming a Potential Bullish Reversal pattern with wait and watch scenario.
Key Highlights:
• ✅ Pattern: Double Bottom
• ⚠️ Confirmation: Break + Bullish candle
• 🔄 Risk Management: Tight SL, 2 TP levels
• 🧩 Confluence: Trendline break + structure shift + RSI Divergence

NZDUSD SELL OFF (Counter-Trend Setup)(Daily) - Price hit Key resistance level at (0.60308 - 0.59985) and consolidated at the level attempting to breakout but failing and forming double top in 4H.
(4H) - Price formed double top at the Key resistance level (0.60308 - 0.59985) which is reversal pattern, neckline of the DT at (0.60031).
(4H) - Bearish market structure at the level price forming new lower high and lower low at (0.60578 - 0.60535)
(4H) - Rising trendline connecting low of the price at (0.58522 - 0.59556).
Entry ;
-We have 2 entry models;
1.Aggressive Entry at the Double top after the close of the bearish Engulfing Candle SL above double top at 0.60808
2.Conservative Entry wait for the break of the rising trendline to signal trend change from an uptrend to downtrend then execute.

UK100 [Consolidation Below Resistance] – Will Bulls Break Out?After a strong recovery from the April lows, UK100 has been trending upward, recently stalling just below the 8,912.17 resistance level. The price action is currently consolidating between the 8,809.57 support and the key resistance. The structure remains bullish overall, though the momentum has slightly weakened near the top.
Support at: 8,809.57 🔽 | 8,729.00 🔽 | 8,625.00 🔽
Resistance at: 8,912.17 🔼
🔎 Bias:
🔼 Bullish: A strong break and close above 8,912.17 could trigger a continuation toward fresh highs.
🔽 Bearish: A sustained drop below 8,809.57 and especially 8,729.00 may open downside moves toward 8,625.00 and 8,490.00.
📛 Disclaimer: This is not financial advice. Trade at your own risk.

GBPUSD London ShortsWhat I see and we could have one massive push down to setup a mid reversal today/tomorrow
