Most overbought condition 1) Most overbought condition since May 2021 on the weekly RSI 14.
2) Converging trendlines at 38,200 stretching back since late 2021 create solid roof tested 3 times at least on 2 separate trend-lines which would make for a very tough level to break, especially when it's this overbought.
***A correction down to retest the connecting lows trend-line since late 2022 would make a lot of sense even if a new high would be reached in the future, a correction down is very likely in the current technical condition - Which would be down to the 34,200 floor.
DOW

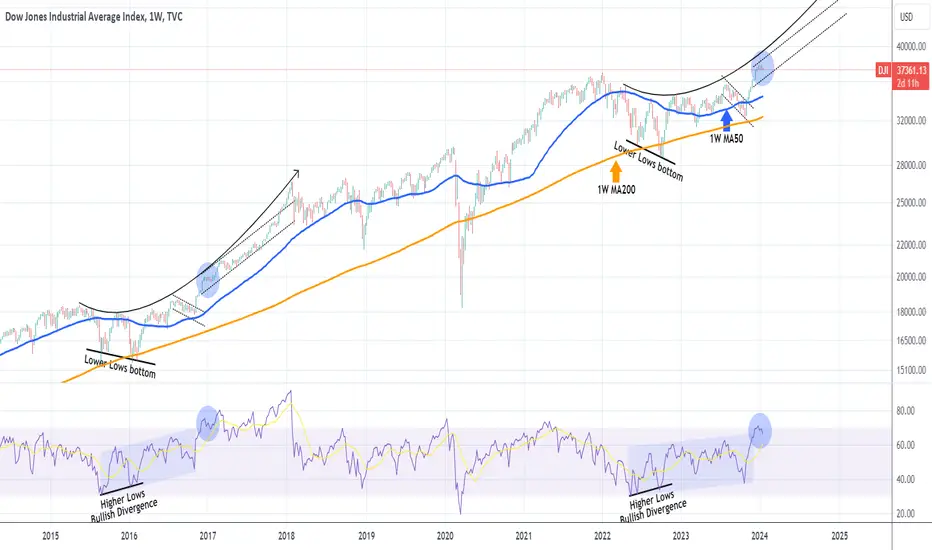
DOW JONES Why you don't want to miss this rally.Dow Jones (DJI) is pulling back on a technical correction as the 1W RSI got overbought (above the 70.00 mark) on the December 26 1W candle. That was basically the first time since June 01 2021 it got overbought and that time also gave a technical pull-back.
What draws our attention more than that time though is the December 19 2016 pull-back when the 1W RSI was again overbought. The difference here is that the price action and patterns that preceded that pull-back/ consolidation are very similar. A Lower Lows bottom on the 1W MA200 (orange trend-line) that took place on a 1W RSI Higher Lows Bullish Divergence, gave way to a break and sustainable rise above the 1W MA50 (blue trend-line). Following the current pull-back/ consolidation we are at, a very strong Channel Up took place.
As a result, even though the sentiment is bearish on the short-term, possibly until the January 31 Fed Meeting, it is clear that the long-term trend is bullish. Every such correction has high probabilities from now on to be a buy opportunity. The target can be as high as 43000 within 2024.
-------------------------------------------------------------------------------
** Please LIKE 👍, FOLLOW ✅, SHARE 🙌 and COMMENT ✍ if you enjoy this idea! Also share your ideas and charts in the comments section below! This is best way to keep it relevant, support us, keep the content here free and allow the idea to reach as many people as possible. **
-------------------------------------------------------------------------------
💸💸💸💸💸💸
👇 👇 👇 👇 👇 👇
Dow failed to breakout of the 1929 & 2000 Trend - Crash IncomingThese are serious setups, I found a trendline that connected to the Feb 2020 top and it drop from there the next day. This is BIG we failed to breakout of the trendline connecting 1929 to 2000, it went above and came back under, this is VERY Bearish. First target 26000 under that it gets nasty.

DOW Elliott Wave Analysis for Wednesday 17/01/2024We made a new ATH in the DOW JONES so the bullish sequence in the higher time frame continues. We believe we are now working on a wave ((3)). Alternatively, the wave ((1)) might still be ongoing as a leading diagonal. In the lower time frame, it looks like we are moving corrective and that we have not started wave 5 yet. We could be close to complete another WXY structure.

DOW Elliott Wave Analysis for Monday 15/01/2024 (+ HTF)We made a new ATH in the DOW JONES so the bullish sequence in the higher time frame continues. We believe we are now working on a wave ((3)). Alternatively, the wave ((1)) might still be ongoing as a leading diagonal. In the lower time frame, it looks like we are moving corrective and that we have not started wave 5 yet.

DOW Elliott Wave Analysis for Friday 12/01/2024We made a new ATH in the DOW JONES so the bullish sequence in the higher time frame continues. We believe we are now working on a wave ((3)). Alternatively, the wave ((1)) might still be ongoing as a leading diagonal. In the lower time frame, it looks like we are moving corrective and that we have not started wave 5 yet.

Dow Jones H4 | Potential bullish breakoutDow Jones (US30) is rising towards a pullback resistance and could potentially break above this level to climb higher.
Buy entry is at 37,871.59 which is a potential breakout level.
Stop loss is at 37,350.00 which is a level that sits under a pullback support.
Take profit is at 38,256.87 which is a level that aligns with the 161.8% Fibonacci extension level.
High Risk Investment Warning
Trading Forex/CFDs on margin carries a high level of risk and may not be suitable for all investors. Leverage can work against you.
Stratos Markets Limited (www.fxcm.com):
CFDs are complex instruments and come with a high risk of losing money rapidly due to leverage. 67% of retail investor accounts lose money when trading CFDs with this provider. You should consider whether you understand how CFDs work and whether you can afford to take the high risk of losing your money.
Stratos Europe Ltd, previously FXCM EU Ltd (www.fxcm.com):
CFDs are complex instruments and come with a high risk of losing money rapidly due to leverage. 72% of retail investor accounts lose money when trading CFDs with this provider. You should consider whether you understand how CFDs work and whether you can afford to take the high risk of losing your money.
Stratos Trading Pty. Limited (www.fxcm.com):
Trading FX/CFDs carries significant risks. FXCM AU (AFSL 309763), please read the Financial Services Guide, Product Disclosure Statement, Target Market Determination and Terms of Business at www.fxcm.com
Stratos Global LLC (www.fxcm.com):
Losses can exceed deposits.
Please be advised that the information presented on TradingView is provided to FXCM (‘Company’, ‘we’) by a third-party provider (‘TFA Global Pte Ltd’). Please be reminded that you are solely responsible for the trading decisions on your account. There is a very high degree of risk involved in trading. Any information and/or content is intended entirely for research, educational and informational purposes only and does not constitute investment or consultation advice or investment strategy. The information is not tailored to the investment needs of any specific person and therefore does not involve a consideration of any of the investment objectives, financial situation or needs of any viewer that may receive it. Kindly also note that past performance is not a reliable indicator of future results. Actual results may differ materially from those anticipated in forward-looking or past performance statements. We assume no liability as to the accuracy or completeness of any of the information and/or content provided herein and the Company cannot be held responsible for any omission, mistake nor for any loss or damage including without limitation to any loss of profit which may arise from reliance on any information supplied by TFA Global Pte Ltd.
The speaker(s) is neither an employee, agent nor representative of FXCM and is therefore acting independently. The opinions given are their own, constitute general market commentary, and do not constitute the opinion or advice of FXCM or any form of personal or investment advice. FXCM neither endorses nor guarantees offerings of third party speakers, nor is FXCM responsible for the content, veracity or opinions of third-party speakers, presenters or participants.

DJ30 H4 | Potential pullback before bullish bounceDJ30 could fall towards a pullback support and potentially bounce off this level to rise towards our take-profit target.
Entry: 37,665.45
Why we like it:
There is a pullback support level
Stop Loss: 37,247.85
Why we like it:
There is a pullback support level
Take Profit: 38,250.77
Why we like it:
There is a resistance that aligns with the 161.8% Fibonacci extension level
Please be advised that the information presented on TradingView is provided to Vantage (‘Vantage Global Limited’, ‘we’) by a third-party provider (‘Everest Fortune Group’). Please be reminded that you are solely responsible for the trading decisions on your account. There is a very high degree of risk involved in trading. Any information and/or content is intended entirely for research, educational and informational purposes only and does not constitute investment or consultation advice or investment strategy. The information is not tailored to the investment needs of any specific person and therefore does not involve a consideration of any of the investment objectives, financial situation or needs of any viewer that may receive it. Kindly also note that past performance is not a reliable indicator of future results. Actual results may differ materially from those anticipated in forward-looking or past performance statements. We assume no liability as to the accuracy or completeness of any of the information and/or content provided herein and the Company cannot be held responsible for any omission, mistake nor for any loss or damage including without limitation to any loss of profit which may arise from reliance on any information supplied by Everest Fortune Group.

BTC EFT Update and US30 Analysis. Today's focus: US30
Pattern – Consolidation / ascending triangle pattern.
Support – 37,400
Resistance – 37,770
Hi, and thanks for checking out today's update.
Crypto had a mainly higher but, in some cases, muted response to news that BTC ETFs will become a reality. We have run over some of the news and moves since yesterday.
The US30 is today's chart, and we are seeing a similar situation to what we discussed in yesterday's ETH update. ETH was one of the better-performing majors after the news hit yesterday.
The US30 sits in a continuation pattern that's inside a consolidation pattern. Buyer momentum remains firm today after yesterday's rally, and we are looking at tonight's CPI data. If CPI remains unchanged or surprises the downside, we will look for further upside on the US30. If it comes in hotter than expected, this could turn the price lower from resistance or above, depending on where price is later tonight.
US CPI data is due at 12:30 am ADET Friday.
Good trading.

DOW Elliott Wave Analysis for Wednesday 10/01/2024We made a new ATH in the DOW JONES so the bullish sequence in the higher time frame continues. We believe we are now working on a wave ((3)). Alternatively, the wave ((1)) might still be ongoing as a leading diagonal. In the lower time frame, we are observing a finished WXY corrective structure. This could mean the start of a wave 5 up.

DOW JONES Correction has started. Where can it stop?Dow Jones (DJI) started a strong decline since our December 29 2023 sell call (see chart below), the strongest since the remarkable rally started on the October 29 bottom:
On today's analysis, we want to look into the same market dynamics and the pattern we drew 10 days ago but this time on the 1D time-frame. What stands out the most is that this time on the January 02 2024 High, the RSI peak that was made a few days back on December 19 2023 (hence the Bearish Divergence) was a (much) Higher High that the previous two (red arrows down) on the Higher Highs trend-line (July 26 2023 and April 13 2023), that was made on the vastly overbought level of 87.50 (highest since January 11 2018).
Our short-term target remains 36750, which represents the 0.618 Fibonacci retracement level from the Jan 02 High. The other feature on this 1D chart that stands out is the 38.50 1D RSI Support, which provided rebounds on May 25 2023 (long-term) and August 24 2023 (short-term). That RSI Support reveals where our first buy attempt should be. Price-wise that could be as low was the 0.5 Fibonacci retracement level (35100) of the October 27 Low. By the time it potentially makes contact with it, the 1D MA200 (orange trend-line) could be there as well.
A medium-term candidate is also a -4.50% range from the Jan 02 High, which would give us 36150 and is where the 1D MA50 (blue trend-line) is headed right now.
-------------------------------------------------------------------------------
** Please LIKE 👍, FOLLOW ✅, SHARE 🙌 and COMMENT ✍ if you enjoy this idea! Also share your ideas and charts in the comments section below! This is best way to keep it relevant, support us, keep the content here free and allow the idea to reach as many people as possible. **
-------------------------------------------------------------------------------
💸💸💸💸💸💸
👇 👇 👇 👇 👇 👇

DOW Elliott Wave Analysis for Tuesday 09/01/2024We made a new ATH in the DOW JONES so the bullish sequence in the higher time frame continues. We believe we are now working on a wave ((3)). Alternatively, the wave ((1)) might still be ongoing as a leading diagonal. In the lower time frame, we are observing a finished WXY corrective structure. This could mean the start of a wave 5 up.

DOW Elliott Wave Analysis for Monday 08/01/2024We made a new ATH in the DOW JONES so the bullish sequence in the higher time frame continues. We believe we are now working on a wave ((3)). Alternatively, the wave ((1)) might still be ongoing as a leading diagonal. In the lower time frame, we are observing a potential WXY corrective structure.

DOW Elliott Wave Analysis for Friday 05/01/2024We made a new ATH in the DOW JONES so the bullish sequence in the higher time frame continues. We believe we are now working on a wave ((3)). Alternatively, the wave ((1)) might still be ongoing as a leading diagonal. In the lower time frame, we are observing an ending impulse. The high could hold or alternatively, we might see a fifth wave to end the impulsive structure.

DOW Elliott Wave Analysis for Thursday 04/01/2024 (+ HTF)We made a new ATH in the DOW JONES so the bullish sequence in the higher time frame continues. We believe we are now working on a wave ((3)). Alternatively, the wave ((1)) might still be ongoing as a leading diagonal. In the lower time frame, we are observing an ending impulse.

DOW WILL GO DOWN!we are in overbought area in the daily timeframe . and also there is a huge gap between the price and 200 ema. so i think we see 36500 soon.

TARGET REACHED Dow Jones at 37,242 - Still bullishReverse Cup and Handle formed on Dow Jones.
The price broke up and since then has been rocketing to its first target at 37,242.
Now that it is the new year generally we can expect the January Effect to kick in with enhanced optimism and positive buying.
I don't like the USD looking to strengthen though, that might change the course.
RIght now I don't have a setup or pattern line up. SO we will just go with the momentum and trend.
Let's see if we can hit 40,000.

DOW JONES: Under the 4H MA50 for the first time in 2 months.Dow Jones has turned neutral on the 4H technical outlook (RSI = 55.920, MACD = 42.900, ADX = 19.367) as today it crossed under the 4H MA50 for the first time since November 1st. Even though the price remains inside the two month Channel Up, this 4H MA50 crossing constitutes the first validated sell signal coming off the big Bearish Divergence on the 1D RSI which is trading inside a Channel Down.
Even though the S1 level is the first level of Support, we expect the pullback to correct a sizeable portion of that rally and target the 1D MA50 (TP = 36,000) around the S2 level with a relative tolerance range up to the 0.382 Fibonacci level.
## If you like our free content follow our profile to get more daily ideas. ##
## Comments and likes are greatly appreciated. ##

Dow Jones Gap Fill TradeHow many gaps get filled?
Gaps in the chart fill 80% of the time .
......................................................................................................................
We are not registered or licensed in any jurisdiction whatsoever to provide investing advice or anything of an advisory or consultancy nature.
and are therefore are unqualified to give investment recommendations.
Always do your own research and consult with a licensed investment professional before investing.
This communication is never to be used as the basis of making investment decisions, and it is for entertainment purposes only.

EOY Review $DOW how to make 0,11 $ in 4 years....NYSE:DOW a great example why long term investing doesn't always beat shorter term speculating/trading
current price at same level as EOY '19....
closed the 2 down quarter green, above the low of previous quarter = positive
inside year = no clear direction, until market gives us new clues = neutral
anything can happen

Same story, different fuel. Really could have been avoided.
Powell had no choice to print during the pandemic, we cannot fault him for that.
Ignoring the US Debt problem?
Not rising the rates sooner?
Not allowing weak banks to fail?
Not allowing real estate to be crushed?
What is the point of the Interest rate system if you're just going to always pick the light method out that causes a super bubble that will end in chaos.
Here we are at 2023 like 1927 where the rate's are lowered and the folk are happy their "homes" will rise in value to lower interest rates.
Happy their "stocks will increase"
Careful what roller coaster you sign up for because the drops can be brutal.
We learn nothing from history.

DOW Elliott Wave Analysis for Thursday 21/12/2023We made a new ATH in the DOW JONES so the bullish sequence in the higher time frame continues. We believe we are now working on a wave ((3)). In the lower time frame, we are observing an ending impulse.

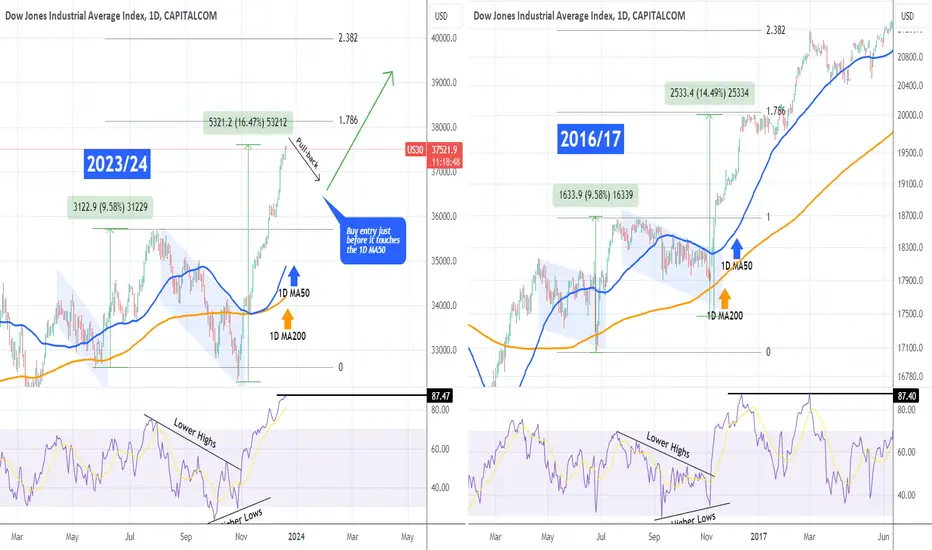
DOW JONES Correction expected due to insanely overbought RSI.Dow Jones (DJI) easily hit last week's (December 12) target (37000) at the top of the 2-month Channel Up (see chart below) with the price grinding ever since on its top:
That was a short-term signal, today we shift our attention to the medium-term and the 1D time-frame where the 1D RSI is 'insanely' overbought near 87.50, a level it hasn't touched since January 2018. In fact if we look a little longer, we can see a perfectly fitting sequence with today's price action in late 2016. The 1D RSI got hugely overbought at 87.40 on December 13 2016 and pulled-back to the 1D MA50 (blue trend-line) before resuming the uptrend.
This overbought 1D RSI peak was made after two straight Channel Downs leading to approximately +9.58% and +14.50% rises, which is quite similar to what's been happening since April. This tells us not to engage in any buying any more, even though due to being on the end of year euphoria and post Fed rate cut anticipation, it can rise some more. But the risk is higher now than buying near the 1D MA50 again.
-------------------------------------------------------------------------------
** Please LIKE 👍, FOLLOW ✅, SHARE 🙌 and COMMENT ✍ if you enjoy this idea! Also share your ideas and charts in the comments section below! This is best way to keep it relevant, support us, keep the content here free and allow the idea to reach as many people as possible. **
-------------------------------------------------------------------------------
💸💸💸💸💸💸
👇 👇 👇 👇 👇 👇