does technical analysis work? dia is wonderingDIA has been stuck in channel and will eventually pick a side.
rates rising, jpowell speaking, will treasuries pull assets form dollar sensitive dow?
DOW

DOW JONES The opportunity to buy again is NOWWe have been following this Triangle pattern on Dow Jones (DJI) trading within what we called the 'High Volatility region' since last year, with are last buy signal given 1 week ago:
The 33400 target was reached and yesterday's rejection on the 4H MA200 (orange trend-line) is providing us with a new opportunity to buy. We have a confirmed Triple Bottom ranging from November 09 2022 and today's low makes a Higher Lows sequence similar to what followed after the December 20 2022 Low on the 32480 Support. Even the 4H CCI is on the exact same levels as December.
Target 1 is again 33400 and Target 2 is 34350 assuming the index breaks and closes a 1D candle above the Pivot Zone and then re-tests it successfully as a Support.
-------------------------------------------------------------------------------
** Please LIKE 👍, FOLLOW ✅, SHARE 🙌 and COMMENT ✍ if you enjoy this idea! Also share your ideas and charts in the comments section below! **
-------------------------------------------------------------------------------
💸💸💸💸💸💸
👇 👇 👇 👇 👇 👇

DOW JONES High probability buy opportunity.Dow Jones quickly reached our first two targets (see bottom of the idea for the previous analysis).
Yesterday's rejection on Pivot Zone (2) creates the conditions for a new buy position since the index entered Pivot Zone (1) again.
Trading Plan:
1. Buy on the current market price.
2. Buy if it closes a candle over the MA200 (4H).
Targets:
1. 33500 (inside Pivot Zone (2) and on the tranjectory of the MA200 (4H)).
2. 34300 (near Resistance 1).
Tips:
1. The RSI (4H) has a Rising Support similar to late December. In fact the two bottom formation are very much alike, both bottomed on a Declining Support and initially hit Pivot Zone (2).
2. 1. The MA50 (1D) moves parallel with Support (2) and essentially has provides the same level of support pressure as that level. Trend changes long term if it breaks.
Please like, follow and comment!!
Notes:
This is an extension of this trading plan:

DJI Possible Drop Incoming for 2023Good morning, Traders. Right now, weekly timeframe looking like some minor up movement is still possible, but don't let that move fool you. Monthly timeframe printed a HUGE bullish engulfing candle, if that level is broken, I am expecting DJI to drop down to the 28k level.
Projecting the first half of the 2023 will not be great for the stock market maybe the entire 2023. Only time will tell...
Well, that's it for today, Happy holidays everyone and have a great rest of the years! Happy Trading!

Intraday Bullish setup on DJIOn a weekly chart, the price broke above the upper band of an expanding wedge channel, now it just made its second retest of the upper band- making that level a bit more stronger (provided it does not get broken).
So, i am having 2 bias, one is mid-term bullish bias as shown in the above chart. A break above the Intraday - OB followed by a retest would mean that buyers are still very much interested in riding the price back up.
Alternatively, if the price break down and fall back inside the wedge (weekly) then the FVG could get filled up and it's going to be a quick bearish down pour.
So, stay close and watch how it plays out.

Dow Jones by EOY
Based on fundamentals, economics, economic data, geopolitics, Fed QT. It'll be a zig zag on the way down. S&P completed a 50% retracement during this last 5-week rally. The trend seems to have reversed with a resumption in selling that started in Nov 2021, accelerated in Jan 2022, with a recovery in June to Mid August.

DOW JONES Massive breakout. Where to profit and where to rebuy.We got the perfect buy on Dow on Tuesday and now we will discuss how to best manage it:
The index is now approaching not just the 4hour MA200 but also the 33450 Resistance, which rejected the Dec 20th-21st rally. This along with the Jan 20th-23rd rally, pulled back to Fibonacci 0.618 before resuming the bullish trend.
The long term Target is 34000, top of the Channel Down.
Follow us, like the idea and leave a comment below!!

US30 SHORT BIAS (UPDATED)!Hello all!
US30 Idea for you!
I will be looking to sell Dow to 32250. From there a Strong DEMAND zone would be mitigated.
This isn't my exact entry on this pair, as i will look for confirmation due to the BUY volume (Looking at hourly TF)
Monitor LTF and execute the SHORT position accordingly! Will only enter aggressively if the POI is mitigated during US news tomorrow!
Take care!

💾 DJI Bullish But Why? & BitcoinNotice how the August 2022 peak is followed by a strong correction, instantly.
The November and December 2022 peak is followed by sideways consolidation.
That's why I consider this chart to be bullish.
I make the same argument for Bitcoin.
In the past, each time a peak is hit we have a strong correction immediately after.
In the present, as each new peak is hit, we get sideways consolidation.
That's a bullish signal.
Thank you for reading.
Namaste.

dowjones 4 hour say = above low,looking for buy when you see pinbar on 15-60-2240-1440min chart ,pick buy and put SL in pinbar low,uunderstand?
hold your buys minimum to fibo 50% (dont close soon)
if you have old buy ,dont fear ,dow will back to high ,but put hedge sellstop in low ok? (if it open,never close it in low ,even in 10.000$ profit(ca go downer and margincall you ),wait dow goes down and back ,up trend apear,then close sell,then on high close buys)
alert= dow will go to 35800 ,be carefull from sell 100% put sl
good luck

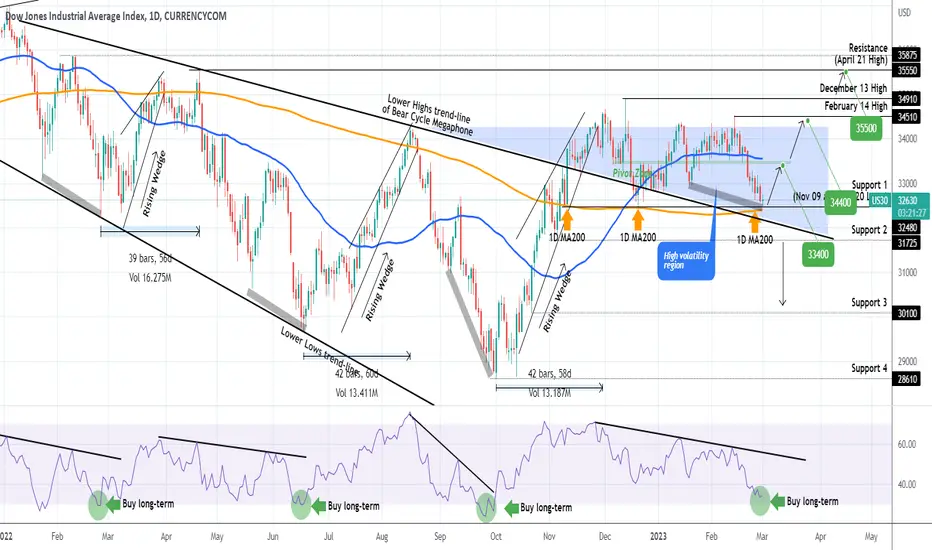
DOW JONES This is the bottom. Fractals from 2022 confirm.Not surprisingly to us, Dow Jones has stayed inside the High Volatility region that we have identified back in late November:
The 1D MA200 (orange trend-line) has supported twice already since November 10 and is now going for its 3rd hold. If we pay a closer attention to the 1D RSI we see that it has printed the very same pattern it made on all Lows during the 2022 Bear Cycle. That is basically 3 occasions. The RSI is very close to the 30.00 oversold barrier and as the 1D MA100 supports, it makes it the most optimal long-term buy level on a 2-month horizon.
Even though it has been mostly trading sideways within the High Volatility Zone, on RSI terms, it is comparable to all 2022 Lows that bottomed out on an oversold 30.00 1D RSI and started an aggressive rally in the form of a Rising Wedge.
Our Targets are: short-term = 33400 (Pivot Zone), medium-term = 34400 (February 14 Resistance), long-term 35500 (April 21 Resistance).
-------------------------------------------------------------------------------
** Please LIKE 👍, FOLLOW ✅, SHARE 🙌 and COMMENT ✍ if you enjoy this idea! Also share your ideas and charts in the comments section below! **
-------------------------------------------------------------------------------
💸💸💸💸💸💸
👇 👇 👇 👇 👇 👇
DOW - Any relief rally is guilty until proven otherwise !Seems to me like this could unfold as a complexe correction if bulls are to remain in power longer term.
We could see soon a move up but if it stays sideways it's most likely going to be a wave (b) of higher degree Y imho.
Look for individual names showing relative strength right now, those are most likely to be the next big leaders.

DOW JONES bottomed out on a 4 month Support!Dow Jones almost hit Support (2) at 32470 a level that worked out twice since November 9th 2022, starting strong rallies to 34390 (Resistance 1).
The same Declining Support on price - Rising Support on the RSI (4h) Bullish Divergence was formed on the December 20th bottom.
Trading Plan:
1. Buy on the current market price.
Targets:
1. 33050 (MA50 (4h))
2. 33500 (MA200 (4h) and bottom of the Pivot Zone.
3. 34300 (under Resistance 1).
Tips:
1. The MA50 (1d) moves parallel with Support (2) and essentially has provided the same level of support pressure as that level. Trend changes long term if it breaks.
Please like, follow and comment!!

DOW JONES hasn't been such strong buy since Dec 20thDow Jones' long term pattern is a Channel Down. On this chart you can see that all 1D candles have closed inside the Channel regardless of the length of their wicks.
The 1D RSI is inside a Channel Down of its own. The price is approaching a Triple Support Zone: the 32500 horizontal Support, the 1day MA200 and the bottom of the Channel Down.
Last time all three were fulfilled was more than two months ago, on the December 20th low. This is a strong buy and our target is the top of the Channel Down at 33950.
Follow us, like the idea and leave a comment below!!

DOW JONES: Bottom similar to December. Buy opportunity.Dow Jones is technically heavily bearish on both the 4H and 1D time-frames (RSI = 34.017, MACD = -241.550, ADX = 52.078) but the 4H RSI has been rising for the past week, despite the corrective wave on the index. This price action is similar to the late December that ended with a bottom formation. Even the patterns that preceded this are similar.
We are turning long again on Dow, targeting both the 4H MA50 (TP = 33,200) and 4H MA200 (TP = 33,600).
## If you like our free content follow our profile to get more daily ideas. ##
## Comments and likes are greatly appreciated. ##

#US DOWUS DOW Trading in a range with strong supportive trendline @ 32850 level, watch levels in chart.

YM1! US30USD DOW 2023 FEB 27
YM1! US30USD DOW 2023 FEB 27
No trades for Dow last week.
Possible scenarios:
1) Rotational play: Trades can be executed at boundary of rotation
range 34605 / 32789
2) Supply takes control = short on test and reject of 32789
Volume Analysis:
Weekly: Lower vol down bar close toward low = minor supply
Daily: Ave vol down bar close toward low = minor supply
H4: UHV vol up bar + level close up bar close toward low = supply > demand
Price reaction levels
Short on Test and Reject | Long on Test and Accept
35750 35228 34605
32789 30513 28635
Remember to like and follow if you find this useful.
Have a profitable week ahead.

Dow closing on support, Monday candle can decide the trend, it may go down big time if the support is broken. Probably previous lows are going be tested!

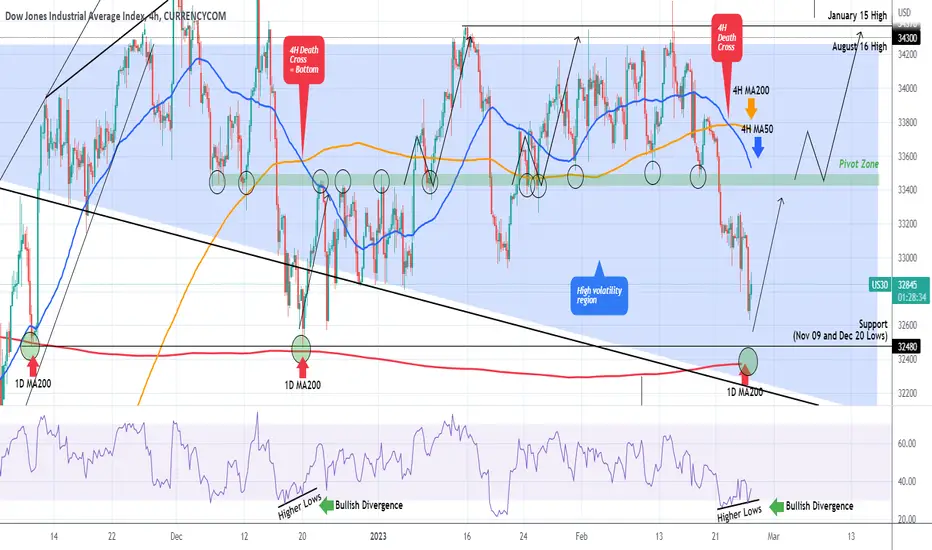
DOW JONES Aggressive bullish reversal expectedDow Jones (DJI) broke below its Pivot Zone and Higher Lows trend-line and as per our strategy published 2 weeks ago, we took that break-out sell opportunity:
With the 4H RSI though printing Higher Lows against the price's Lower Lows (i.e. a Bullish Divergence) and the price approaching the 32480 Support level and the 1D MA200 (red trend-line), which both provided Support and started aggressive rebounds on November 09 2022 and December 20 2022, Dow is turning into a medium-term (at least) buy opportunity again.
In fact the very same RSI Bullish Divergence formed the December 20 Low. It is important to add that this Low was formed after a 4H Death Cross, a pattern that we already formed again 2 days ago.
We are buyers again on Dow, targeting the 4H MA50 (blue trend-line). Then we will either wait for a pull-back or buy when the price breaks above the Pivot Zone and re-tests it as Support, in similar fashion as on January 06 2023 and January 23 2023. Long-term target 34300.
-------------------------------------------------------------------------------
** Please LIKE 👍, FOLLOW ✅, SHARE 🙌 and COMMENT ✍ if you enjoy this idea! Also share your ideas and charts in the comments section below! **
-------------------------------------------------------------------------------
💸💸💸💸💸💸
👇 👇 👇 👇 👇 👇
clear mind patience focus results in higher learningthis journey is forever yielding patience experience gut and courage; it is true that you dont know what it is that you do not know. Grow Strong each day!

Key Levels and Market overview for the Asian session open 24/02A review of the price action from the European session and recap of US price action as US indexes followed on from some strength this time in the Asian and European trade. The US gapped up on the open, sold off hard only to bounce back into the close to wipe off the majority of the earlier losses. I look at some key levels to watch and the price action setups I expect to see play out.
Markets covered :-
DOW
Nasdaq
DAX
FTSE
ASX200
Hang Seng
USD Index
Gold
Oil
Copper

DOW ANALYSIS ON CAD/CHFDow Theory is one of the oldest and most widely used methods for technical analysis in the financial markets. It was developed by Charles Dow, the founder of the Wall Street Journal, and is based on his observations of market trends in the late 19th and early 20th centuries. The theory is based on the premise that the stock market moves in trends and that these trends can be analyzed and predicted by studying market price movements and trading volume.
According to Dow Theory, there are three types of market trends:
Primary Trend: This is the major trend in the market, lasting for several months to several years. It can be either bullish (rising) or bearish (falling) and is determined by a series of higher highs and higher lows (in an uptrend) or lower highs and lower lows (in a downtrend).
Secondary Trend: This is a minor trend within the primary trend, lasting for several weeks to several months. It is a counter-trend move that retraces a portion of the primary trend. In an uptrend, a secondary trend would be a temporary pullback or correction, while in a downtrend, it would be a temporary rally.
Minor Trend: This is the smallest trend within the primary and secondary trends, lasting for a few days to a few weeks. It represents the daily fluctuations in the market and is often influenced by news and other short-term events.
Dow Theory also states that the market is made up of three types of movements:
Primary Movements: These are the long-term movements that define the primary trend.
Secondary Movements: These are the medium-term movements that retrace a portion of the primary trend.
Minor Movements: These are the short-term movements that represent the daily fluctuations in the market.
Dow Theory is used by technical analysts to identify trends and potential trend reversals in the market. It is often used in conjunction with other technical indicators, such as moving averages, oscillators, and chart patterns, to confirm signals and make trading decisions.

DOW JONES Trading plan based on the MA50 4H.Dow Jones is holding the Channel Up since December and on Friday it came the closest to the bottom in 1 month.
There is a potential Channel Down emerging and the key to which pattern prevails will be the MA50 4H.
Trading Plan:
1. Sell below the MA50 4H.
2. Sell if the price breaks under the Channel Up.
3. Buy above the MA50 4H.
4. Buy at the bottom of the Channel Up.
Targets:
1. 33470 (bottom of Channel Up).
2. 33000 (above Support 1).
3. 34500 (below Fibonacci 0.786).
4. 34850 (below Resistance 1).
Tips:
1. The RSI is supported in a similar way like December-January. That kick started a strong rise. Break below and the pattern might be negated.
Please like, follow and comment!!
