US30 weekly analysis. October month was extremely bullish. In-fact, it was the single most bullish month is all of US30.. at 4350 pips!... Successfully taking out Septembers highs just last week. It could possibly make a reversal this week or continue to take out Augusts highs as well since that's only about 600 pips away. Will watch Monday and see how it plays out. probably will push to take out August high and then reverse on Friday for NFP.
DOW

S&P 500 RalliesThe S&P 500 has shrugged off Amazon losses, pivoting just above our level at 3758. Amazon has given up $trillion status as weak holiday spending as forecasts project the weakest holiday sales growth quarter ever. We will see if stocks can continue to rally, as a red triangle on the KRI is confirming resistance at current levels. The price action is rounding off and the Kovach OBV has slumped. If we continue to rally, we will face resistance from 3887, and 3909, the latter corresponding to a relative high. If we retrace, anticipate support at 3758 again.

No Man's LandTo recap how the market's ended yesterday, we had the DOW close at 0.61%, the S&P -0.61%, and the NASDAQ -1.63% (I think this even went positive at some point during trading hours). Something is holding this market up. You would think with all these bad tech earnings, the market would be coming down substantially more. But it's not. So is this market rally going to hold tech up? Or is tech going to ruin this rally? We're currently in between the 20 day and 50 day which most call "no man's land". Market is still trying to decide where it wants to go. Wednesday's candle was our reversal signal with Thursday candle being our confirmation candle since it traded lower than the previous day. So naturally, we should expect movement to the downside. Gotta see what today brings us.
The chart on the Nasdaq looks more Bearish to me. Which again. Does Tech bring the market down? Or does the rally save Tech? There are too many mixed signals everywhere. My lean is still Bearish but as the days come, I need to react to what the market is telling me. Be patient, stay disciplined. Happy trading everyone!

DJI Potential For Bearish ContinuationOn H4, with the price tapping onto our sell entry at 32144.40 where the 61.8% and 50% Fibonacci lines are. We are looking to take profit at 29640.37, where the 100% Fibonacci line and previous swing low is. Stop loss will be set at 33364.70, slightly above where the 78.6% Fibonacci line is located.
Please be advised that the information presented on TradingView is provided to Vantage (‘Vantage Global Limited’, ‘we’) by a third-party provider (‘Everest Fortune Group’). Please be reminded that you are solely responsible for the trading decisions on your account. There is a very high degree of risk involved in trading. Any information and/or content is intended entirely for research, educational and informational purposes only and does not constitute investment or consultation advice or investment strategy. The information is not tailored to the investment needs of any specific person and therefore does not involve a consideration of any of the investment objectives, financial situation or needs of any viewer that may receive it. Kindly also note that past performance is not a reliable indicator of future results. Actual results may differ materially from those anticipated in forward-looking or past performance statements. We assume no liability as to the accuracy or completeness of any of the information and/or content provided herein and the Company cannot be held responsible for any omission, mistake nor for any loss or damage including without limitation to any loss of profit which may arise from reliance on any information supplied by Everest Fortune Group.

DJI Potential for Bearish Momentum | 28th October 2022On the H4 chart, the overall bias for DJI is bearish . With price tapping onto our sell entry at 31896.61, where the 50% and 61.8% Fibonacci lines are located. We are looking to take profit at 29653.29 where the 0% Fibonacci line and previous low is located. We have a pretty safe stop loss set at 34519.93 where it is slightly above where the 100% Fibonacci line and previous highs are located.
Any opinions, news, research, analyses, prices, other information, or links to third-party sites contained on this website are provided on an "as-is" basis, as general market commentary, and do not constitute investment advice. The market commentary has not been prepared in accordance with legal requirements designed to promote the independence of investment research, and it is therefore not subject to any prohibition on dealing ahead of dissemination. Although this commentary is not produced by an independent source, FXCM takes all sufficient steps to eliminate or prevent any conflicts of interest arising out of the production and dissemination of this communication. The employees of FXCM commit to acting in the clients' best interests and represent their views without misleading, deceiving, or otherwise impairing the clients' ability to make informed investment decisions. For more information about the FXCM's internal organizational and administrative arrangements for the prevention of conflicts, please refer to the Firms' Managing Conflicts Policy. Please ensure that you read and understand our Full Disclaimer and Liability provision concerning the foregoing Information, which can be accessed on the website.

DOW 4HOUR: we can sell now as predict 3days ago dow touch fibo 61 it is so clear dow dax and many index have sell now but daily chart trend can go to 35000
if you have old sell you must close above 31250
good luck

Euphoric Bounce in DOWYou know, I usually don't follow the DOW as much. I mean, I'll glance at it every day but I think the surge we've seen can't go unnoticed. The question is: Is this surge over? I mean, this thing blew right through the 50, through a resistance level and now it's looking like it wants to go touch the 200 day! Hey, if it does....it does. Two possible outcomes here that I think could happen. Bears will step back in but the Bull's will absorb it and either base or head higher. If the Bull's can't absorbs the Bear's stepping in, we can erase this euphoric move in days. Or, a move similar to what we saw from about the middles of August to the end of September. In the coming days we should know better.
I believe the markets understand that sentiment is Bearish and if this rally we've had is in fact the C wave of this ABC correction, then we should start to expect downside movement. Worse case, we could see some gaps down to 3700ish then 3500ish. These tech earnings are not painting a nice picture. I'm sure everyone has been watching META's plunge overnight. But again, the markets are going to do what they do. I'm still Bearish and plenty to worry about. Always remember to trade the markets in front of you, be patience, stay disciplined. Happy Trading Everyone!

Stocks Edge Higher Despite Earnings MalaiseStocks have rounded off, but still edge higher despite disappointing Microsoft guidance , Meta malaise, and general tech sector weakness. Goldman Sachs is bullish on a recovery for Microsoft, and it is one of the only AAA rated companies on the planet. These facts have weighed on the indexes, but have not contributed to much of a sell off yet. If earnings continue to come in weak, then it is difficult to image that this rally will continue. Technically, we are very close to our next target of 3909 where we will likely face resistance as it is a relative high. The Kovach OBV is still edging up, but does appear to be showing signs of leveling off. Expect support at 3792 if so. We should see further support at 3758.

Let's Dump Dow jones!!US stock indexes might not finish the week with healthy gains so this my forecast for Dow jones So yesterday the price has reached Supply Area So I think we will have huge drop from this level

DOWJONES this week Pump it before FOMCI think this week everything against dollar will go up until next week and after fed interest rate they will dump it

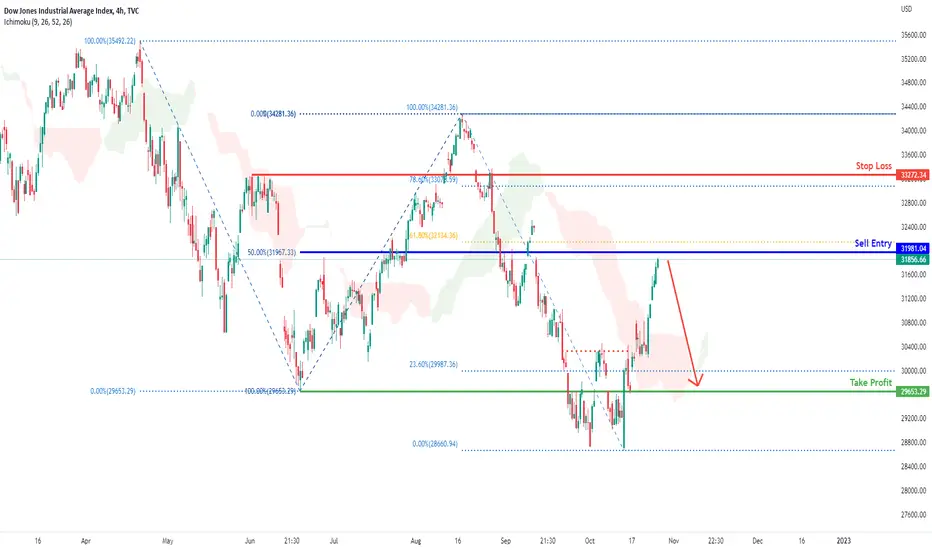
DJI Potential For Bearish ContinuationOn the H4 chart, DJI's overall bias is bearish. At 31981.14, which holds the 50% and 61.8% Fibonacci lines, look for a pullback sell entry. A market gap that seems to be fillable furthers the confluence. The stop loss level will be 33272.34, well above the 78.6% Fibonacci line. The previous swing low and 100% fibonacci line, which is at 29640.37, will serve as the take-profit point.
Please be advised that the information presented on TradingView is provided to Vantage (‘Vantage Global Limited’, ‘we’) by a third-party provider (‘Everest Fortune Group’). Please be reminded that you are solely responsible for the trading decisions on your account. There is a very high degree of risk involved in trading. Any information and/or content is intended entirely for research, educational and informational purposes only and does not constitute investment or consultation advice or investment strategy. The information is not tailored to the investment needs of any specific person and therefore does not involve a consideration of any of the investment objectives, financial situation or needs of any viewer that may receive it. Kindly also note that past performance is not a reliable indicator of future results. Actual results may differ materially from those anticipated in forward-looking or past performance statements. We assume no liability as to the accuracy or completeness of any of the information and/or content provided herein and the Company cannot be held responsible for any omission, mistake nor for any loss or damage including without limitation to any loss of profit which may arise from reliance on any information supplied by Everest Fortune Group.

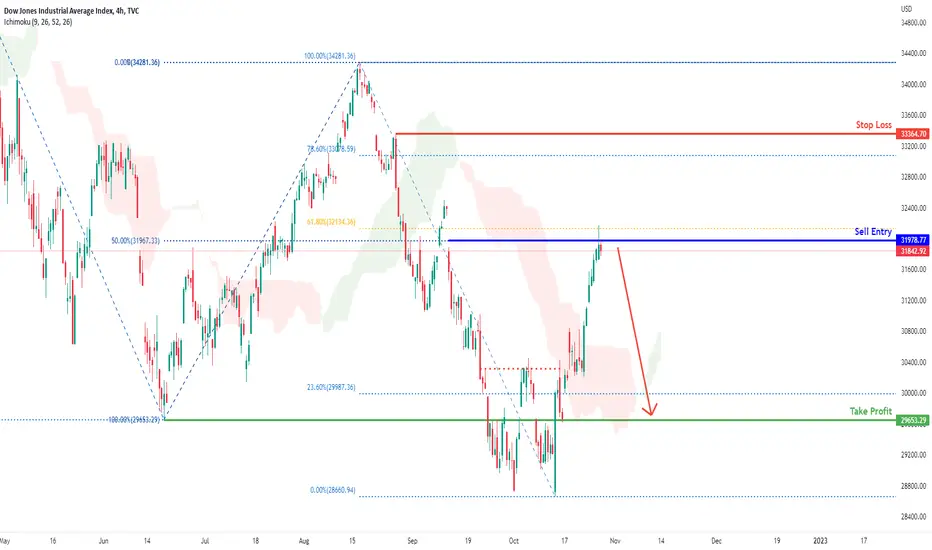
DJI Potential for Bearish Momentum | 27th October 2022On the H4 chart, the overall bias for DJI is bearish . Looking for a sell entry at 31978.77, where the 50% and 61.8% Fibonacci lines are. There is also a market gap there which adds confluence to that area. Stop loss will be set at 33364.70, slightly above where the 78.6% Fibonacci line is located. Take profit will be set at 29653.29 where the 100% Fibonacci line and previous low is.
Any opinions, news, research, analyses, prices, other information, or links to third-party sites contained on this website are provided on an "as-is" basis, as general market commentary, and do not constitute investment advice. The market commentary has not been prepared in accordance with legal requirements designed to promote the independence of investment research, and it is therefore not subject to any prohibition on dealing ahead of dissemination. Although this commentary is not produced by an independent source, FXCM takes all sufficient steps to eliminate or prevent any conflicts of interest arising out of the production and dissemination of this communication. The employees of FXCM commit to acting in the clients' best interests and represent their views without misleading, deceiving, or otherwise impairing the clients' ability to make informed investment decisions. For more information about the FXCM's internal organizational and administrative arrangements for the prevention of conflicts, please refer to the Firms' Managing Conflicts Policy. Please ensure that you read and understand our Full Disclaimer and Liability provision concerning the foregoing Information, which can be accessed on the website.
Dow Jones And The Next Rejection ZoneI drafted this chart up a week ago and forgot to post it. I see its playing out, so better late that never... My original opinion was that we could run up and retest the 200ma. This would be a good place to reject and let fundamentals collide with technicals. Nothing in this world has changed enough from last month to warrant a bull market and geopolitics are too wild to get heavy long, yet the market is not logical per se . Not financial advice, obviously, just a rant full of observations.

DOW JONES on an aggressive rally towards the 1D MA200!It was 2 weeks ago when we made a case for a medium-term buy on the Dow Jones index (DJI), against popular belief, as we had early signs that the index made a June 17 type bottom and was about to repeat the June-Aug rebound:
Our view has been confirmed so far and following the 1D RSI break above the Lower Highs and the 1D MACD Bullish Cross, the rally broke above the 1D MA50 (red trend-line) with ease and is headed towards the 1D MA200 (grey trend-line).
Today's analysis is on the 4H time-frame, in order to get a more detailed look on the short-term. We see that Dow Jones has already formed the 4H Golden Cross (when the 4H MA50 (blue trend-line) crosses above the 4H MA200 (orange trend-line)) that comes when the price breaks above the 1D MA50. At the same time, the price has already broken inside the volatility zone of the 0.5 - 0.618 Fibonacci retracement levels. Based on the previous fractal, we could see a week of sideways price action before Dow targets the rejection zone (and the medium-term target) within the 1D MA200 (grey trend-line) and the 1D MA300 (yellow trend-line).
For comparison purposes in order to get a better understanding of Dow's proportionate position compared to the previous rebounds, we've plotted all rebound sequences on top of another (Black line = Feb 24 - March 22, Grey line = June 17 - August 16 and Green line = October 02 - today). Though not 100% correlated, it is obvious that there is a high degree of convergence among all three sequences.
-------------------------------------------------------------------------------
** Please LIKE 👍, SUBSCRIBE ✅, SHARE 🙌 and COMMENT ✍ if you enjoy this idea! Also share your ideas and charts in the comments section below! This is best way to keep it relevant, support me, keep the content here free and allow the idea to reach as many people as possible. **
-------------------------------------------------------------------------------
You may also TELL ME 🙋♀️🙋♂️ in the comments section which symbol you want me to analyze next and on which time-frame. The one with the most posts will be published tomorrow! 👏🎁
-------------------------------------------------------------------------------
👇 👇 👇 👇 👇 👇
💸💸💸💸💸💸
👇 👇 👇 👇 👇 👇

ATLX PARABOLIC GROWTH CURVE IN PLAY TARGET $36 ATLX formerly known as BMIX is in this parabolic growth curve. Volume has been increasing steadily over the past year or so, lots of buying happening from what I see. I think this stock has a lot of potential. This is a great cheap entry point in my opinion. Also ATLX has acquired some land right next to Sigma Lithium Corp. which stock is valued at almost $40. This is not trading or financial advice this is just my opinion. Thank you and if you appreciate this content please give me a boost and follow for more updates.

Stocks Rally! Is this Just Exhuberance?The S&P 500 has rallied off increased expecatations of a Fed tapering after housing price data came in negative. Additionally, Coca-Cola and GM posted earnings
results yesterday suggesting that there is hope for some companies feared to be hit by inflation. Be careful trading this, as the markets have been fooled before, and we will need to wait for forward guidance from Fed speakers before any rally is confirmed. The Kovach OBV is climbing steadily, and we have reached our target of 3849, with 3909 the next major level and next target. If we reject current levels, 3792 or 3758 could provide support.

DJI Potential For Bearish ContinuationThe overall bias for DJI on the H4 chart is bearish. In addition, the price is below the Ichimoku cloud, indicating a bearish market. Looking for a pullback sell entry at 31981.14, which contains the 50% and 61.8% Fibonacci lines. To add to the confluence, there is a market gap that appears to be fillable. Stop loss will be set at 33272.34, which is slightly above the 78.6% Fibonacci line. Take profit will be at 29640.37, which is the previous swing low and the 100% fibonacci line.
Please be advised that the information presented on TradingView is provided to Vantage (‘Vantage Global Limited’, ‘we’) by a third-party provider (‘Everest Fortune Group’). Please be reminded that you are solely responsible for the trading decisions on your account. There is a very high degree of risk involved in trading. Any information and/or content is intended entirely for research, educational and informational purposes only and does not constitute investment or consultation advice or investment strategy. The information is not tailored to the investment needs of any specific person and therefore does not involve a consideration of any of the investment objectives, financial situation or needs of any viewer that may receive it. Kindly also note that past performance is not a reliable indicator of future results. Actual results may differ materially from those anticipated in forward-looking or past performance statements. We assume no liability as to the accuracy or completeness of any of the information and/or content provided herein and the Company cannot be held responsible for any omission, mistake nor for any loss or damage including without limitation to any loss of profit which may arise from reliance on any information supplied by Everest Fortune Group.

DJI Potential for Bearish Momentum | 26th October 2022On the H4 chart, the overall bias for DJI is bearish . Looking for a sell entry at 31981.04, slightly above where the 50% and 61.8% Fibonacci lines are. Stop loss will be at 33272.34 slightly above where the 78.6% Fibonacci line is located. Take profit will be at 29653.29, where the previous swing low and 100% Fibonacci line is.
Any opinions, news, research, analyses, prices, other information, or links to third-party sites contained on this website are provided on an "as-is" basis, as general market commentary, and do not constitute investment advice. The market commentary has not been prepared in accordance with legal requirements designed to promote the independence of investment research, and it is therefore not subject to any prohibition on dealing ahead of dissemination. Although this commentary is not produced by an independent source, FXCM takes all sufficient steps to eliminate or prevent any conflicts of interest arising out of the production and dissemination of this communication. The employees of FXCM commit to acting in the clients' best interests and represent their views without misleading, deceiving, or otherwise impairing the clients' ability to make informed investment decisions. For more information about the FXCM's internal organizational and administrative arrangements for the prevention of conflicts, please refer to the Firms' Managing Conflicts Policy. Please ensure that you read and understand our Full Disclaimer and Liability provision concerning the foregoing Information, which can be accessed on the website.
Will Resistance Hold? We got to 3800 yesterday and it's really testing resistances at this level. So do we move higher from here? If you look at the DOW, it's actually above it's 50 MA and at resistance as well. And yet, 74% of stock are still trading below their 50 MA. We are still in a Bear Market, so we have to remain Bearish. Did you look at the volume we had yesterday compared to Friday? The amount of volume we had yesterday was about half of Friday's. Also a cautious sign.
Still sitting on my hands and waiting for a clearer picture. Remember, 90% of trading is patience. Overall, I think Markets still expect the Fed to stay on track or even slow. Google is to announce earnings today, and Microsoft after market close. We could just hang out in this area today, push higher (because the market still has room to go higher) or volatility can start to kick in. Be patient and trade the market in front of you. Happy trading everyone!

Stocks Attempt Hihger LevelsStocks have continued to edge higher, though they are looking quite weak. We were able to break past 3792, but the very next level at 3810 is providing significant resistance. The price action rounding off, and red triangles on the KRI are confirming resistance. Additionally, the news sentiment remains bearish, so at some point we are likely to face a swift rejection of current levels. However, the Kovach OBV is still strong. If we are able to break out, then 3849 is a reasonable target with 3909 a likely ceiling. We should start to see some support at 3758 if we retrace.

DJI Potential For Bearish ContinuationOn the H4 chart, the overall bias for DJI is bearish. To add confluence to this, price is below the Ichimoku cloud which indicates a bearish market. Looking for a pullback sell entry at 31981.14 where the 50% and 61.8% Fibonacci lines are located. To add confluence to that area, there is a market gap that looks good to be filled. Stop loss will be set at 33272.34, slightly above where the 78.6% Fibonacci line is located. Take profit will be at 29640.37 where the previous swing low and 100% fibonacci line is located.
Please be advised that the information presented on TradingView is provided to Vantage (‘Vantage Global Limited’, ‘we’) by a third-party provider (‘Everest Fortune Group’). Please be reminded that you are solely responsible for the trading decisions on your account. There is a very high degree of risk involved in trading. Any information and/or content is intended entirely for research, educational and informational purposes only and does not constitute investment or consultation advice or investment strategy. The information is not tailored to the investment needs of any specific person and therefore does not involve a consideration of any of the investment objectives, financial situation or needs of any viewer that may receive it. Kindly also note that past performance is not a reliable indicator of future results. Actual results may differ materially from those anticipated in forward-looking or past performance statements. We assume no liability as to the accuracy or completeness of any of the information and/or content provided herein and the Company cannot be held responsible for any omission, mistake nor for any loss or damage including without limitation to any loss of profit which may arise from reliance on any information supplied by Everest Fortune Group.

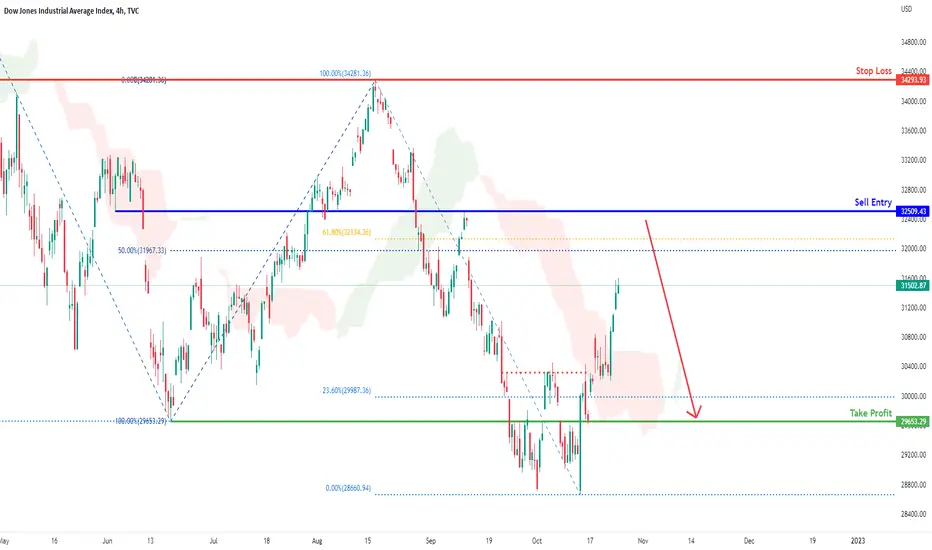
DJI Potential for Bearish Momentum | 25th October 2022On the H4 chart, the overall bias for DJI is bearish. Looking for a pullback sell entry at 32509.43, slightly above where the 61.8% Fibonacci line is located. Stop loss will be at 34293.93 where the previous swing high is located. Take profit will be at 29653.29, where the previous swing low and 100% Fibonacci line is.
Any opinions, news, research, analyses, prices, other information, or links to third-party sites contained on this website are provided on an "as-is" basis, as general market commentary, and do not constitute investment advice. The market commentary has not been prepared in accordance with legal requirements designed to promote the independence of investment research, and it is therefore not subject to any prohibition on dealing ahead of dissemination. Although this commentary is not produced by an independent source, FXCM takes all sufficient steps to eliminate or prevent any conflicts of interest arising out of the production and dissemination of this communication. The employees of FXCM commit to acting in the clients' best interests and represent their views without misleading, deceiving, or otherwise impairing the clients' ability to make informed investment decisions. For more information about the FXCM's internal organizational and administrative arrangements for the prevention of conflicts, please refer to the Firms' Managing Conflicts Policy. Please ensure that you read and understand our Full Disclaimer and Liability provision concerning the foregoing Information, which can be accessed on the website.
Dow 4 hour : 3 best place for sell after pinbar comesas predict 1week ago in low ,dow reach 31500 area ,,, in next 3 month it can reach 35000
alert: BE CAREFUL FROM SELL, DOW CAN FLYUP WILD AND DONT ALLOW YOU CLOSE SELL SO PUT SL
if you have old sells close or hedge them above 31000
wish you win
