DOW JONES: 4 week bottom on the 1W MA50. Best time to buy.Dow Jones turned neutral again on its 1D technical outlook (RSI = 46.611, MACD = -297.980, ADX = 37.851) as it is recovering today and more importantly keeps its price action above the 1W MA50. This is the 4th straight week that it trades and holds the 1W MA50, which is shaping up to be the natural long term support. That is keeping the 1W RSI neutral (47.224), which technically suggets that it is the most low risk level to buy. The 1W RSI made a double bottom due to this consolidation and the 1W MACD printed the first light red bar, all of which are similar to the October 23rd 2023 bottom.
Both have been bottoms after bearish waves of the 1.5 year Channel Up and as a matter of fact similar in decline rate (-9.50%). The highest probability level for a rebound and start of the new bullish wave is this, and based on the previous, it should aim for the 2.0 Fibonacci extension (TP = 49,000).
## If you like our free content follow our profile to get more daily ideas. ##
## Comments and likes are greatly appreciated. ##
DOW

US30 Dow Jones Trade Idea📉 The US30 (Dow Jones) is currently overextended! In this video, we analyze the price action 🔍 and go over my trading plan for a potential short 📊—if the setup plays out as discussed. 🚨 Not financial advice! 🚫e.

US30 bullish LongWall Street goes full bull with tariffs and payrolls looming
I buy the correction
Price closed at low on Friday,for me:Time to buy the correction
Also non farm payrolls looming coming this Friday.
I dont use price action,because it is worthless to use past gone data,on future movements.
Instead I use my favourite commercial analysis
Big commercials buying US30, hedgefunds taking profit and selling it.It means its time to BUY!!!

DOW JONES: Are you ready for what's coming?Dow Jones is neutral on its 1D technical outlook (RSI = 48.157, MACD = -244.290, ADX = 38.724) as it is attempting to recover the 2 month correction. It appears that the bottom has already been made as not only did the price rebound on the LL trendline but it did so on an oversold 1D RSI. This draws comparisons to the last big such correction of Aug-Oct 2023, which also declined by more than -9.40%. They key there was the formation of a 4H Golden Cross.
Right now the price is stuck inside the 4H MA50 - 4H MA200 range, so if it crosses now over the 4H MA200, it will most likely confirm the start of the new bullish wave as it will form a 4H Golden Cross. Technically it can achieve a similar price rally as then, so our thesis remains bullish aiming at the 2.0 Fibonacci extension (TP = 50,000).
## If you like our free content follow our profile to get more daily ideas. ##
## Comments and likes are greatly appreciated. ##

DOW JONES Last chance to buy before it breaks the 1D MA50.Dow Jones (DJIA) has been trading within a 1.5 year Channel Up pattern since the July 2023 High. The market found itself under heavy pressure recently as the Channel unfolded its Bearish Leg which found Support right below the 1D MA200 (orange trend-line).
As the 1D RSI got oversold (<30.00) and rebounded, this is perhaps the last opportunity to buy low, before it breaks above its 1D MA50 (blue trend-line) on what is technically the new Bullish Leg.
The previous Bullish Leg (November 2023 - March 2024) hit the 2.0 Fibonacci extension on a +23.94% rise, before it broke below its 1D MA50 again. As a result, it is possible for Dow not to break again below its 1D MA50 once broken, before it reaches the 2.0 Fib which sits at 50000. Our Target is a little lower than that at 49000.
-------------------------------------------------------------------------------
** Please LIKE 👍, FOLLOW ✅, SHARE 🙌 and COMMENT ✍ if you enjoy this idea! Also share your ideas and charts in the comments section below! This is best way to keep it relevant, support us, keep the content here free and allow the idea to reach as many people as possible. **
-------------------------------------------------------------------------------
Disclosure: I am part of Trade Nation's Influencer program and receive a monthly fee for using their TradingView charts in my analysis.
💸💸💸💸💸💸
👇 👇 👇 👇 👇 👇

Promising Breakout Setup Ahead! Chart 1W CBOT_MINI:YM1! BLACKBULL:US30
Promising Breakout Setup Ahead!
The chart highlights RSI and Williams %R trendline breakout plays. My strategy? Identify trendlines on the chart, monitor RSI and Williams %R, and target breakouts on these momentum indicators.
Current Situation:
All key signals have already triggered.
Strong bullish seasonality
Favorable COT data (small specs bearish, commercials bullish)
Low open interest
This setup aligns with high-probability breakout criteria.
Chart Indicator
SMA 1W 52 (red)
SMA 1W 18 (green)
Bottom Indicators
WilVal
Williams R% 9 length
RSI 9 length
Not Financial Advice
for more questions ask in the comments or
check my X @valuebuffet

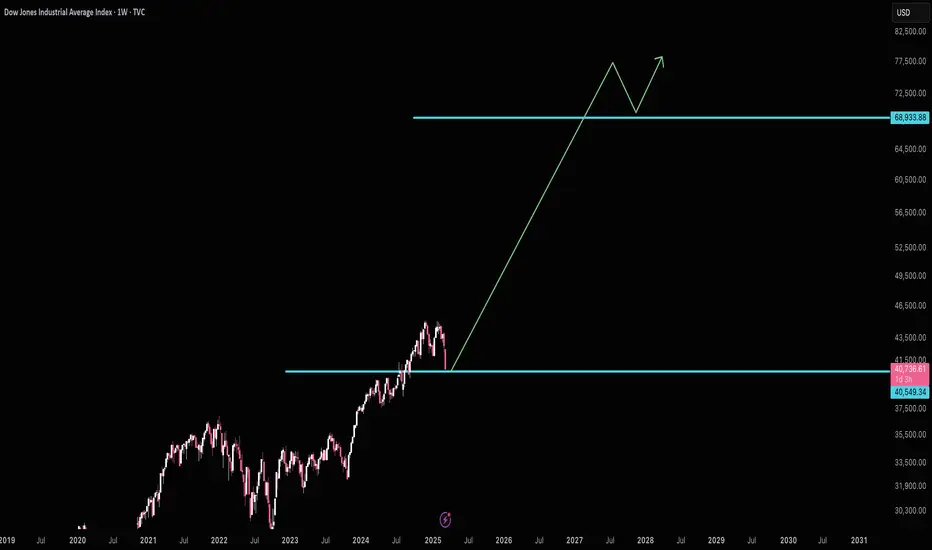
DOW JONES targeting 50000 on this final Bull yearDow Jones / US30 posted the first green weekly candle after hitting last week the 1week MA50.
This is obviously a critical support level as it has been holding since the October 30th 2023 rebound.
As this chart shows, Dow has been repeating the same patterns, Cycle after Cycle.
Right now it has entered the Final Year of Bull, which is the part where it rises aggressively to form the Top before the new Bear begins in the form of a Megaphone pattern.
The previous Bull peaked on the 2.382 Fibonacci extension of the Megaphone.
This means that a 50000 Target for Dow is perfectly plausible by the end of 2025.
Follow us, like the idea and leave a comment below!!

DOW JONES: MA50-100 Bearish Cross says we've bottomed.Dow Jones is almost neutral on its 1D technical outlook (RSI = 43.171, MACD = -608.620, ADX = 62.568), rising aggressively since last week. Technically that was the bottom no just on the 8 month Channel Up but also on the LL trendline. We've seen the very same LL bottom on the October 2023 and March 2023 lows, all of which had oversold 1D RSIs. The 1D MA50-100 Bearish Cross marked those bottoms and today we've completed a new one. Technically the index can rise as high as the 2.0 Fibonacci extension (TP = 49,000).
## If you like our free content follow our profile to get more daily ideas. ##
## Comments and likes are greatly appreciated. ##

Dow 200 Points from Major SupportThe Dow Jones is just about 200 points from major support. I should caution there's often a move through support and slightly below, but this is where all the buyers are.
(I should have drawn the arrow to hit the next major resistance/support around 2031 lol, but you get the idea)
Good luck!
DOW JONES: Starting the final stage of 3year Bull Cycle.Dow Jones got oversold on its 1D technical outlook (RSI = 29.297, MACD = -550.130, ADX = 76.606) as it is currently testing its 1W MA50. This is a level that has been intact since November 2023 and is of high importance to the trend as it has a key cyclical attribute. The driving growth pattern of Dow since the 2009 bottom is a Channel Up and every time a Bull Cycle starts, the 1W MA50 is the first level of support, with every touch of it being the strongest buy opportunity. When the 3 year Bull Cycle is coming to an end, the 1W MA50 breaks and the index approaches the 1M MA50 during its Bear Cycle correction, which becomes the ultimate buy entry for the new long term 3 year Bull Cycle.
The current Cycle should starts getting completed technically after September 2025, so there is a high chance that the 1W MA50 holds here. The three Bull Cycles we've had so far had a fairly similar growth percentage, rising by +70.38% to +76.64%. If the +70.38% minimum range is followed on the current (4th) Bull Cycle, then we're aiming at 48,000 (TP) towards the end of the year. The 1M CCI seems to be printing the exact same build up to the Bear Cycle as in the past.
## If you like our free content follow our profile to get more daily ideas. ##
## Comments and likes are greatly appreciated. ##

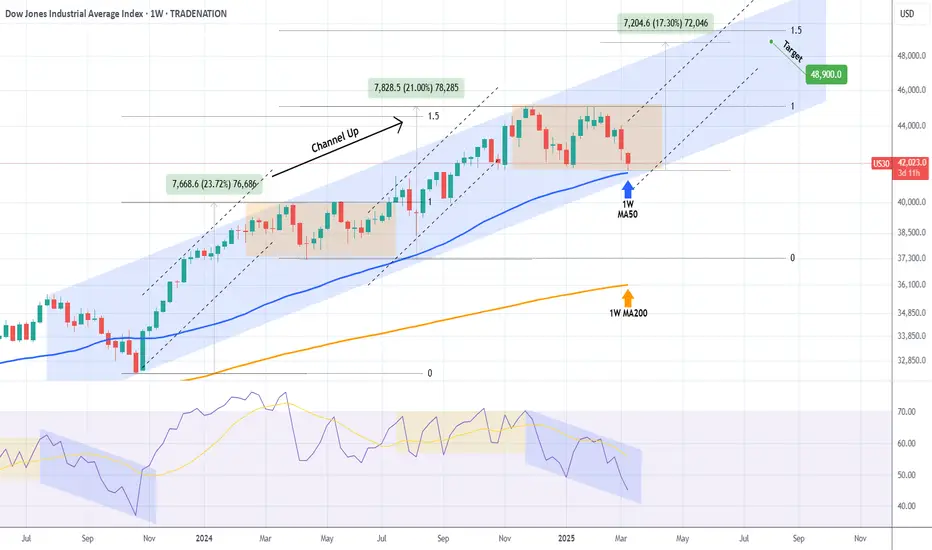
DOW JONES Can the 1W MA50 hold and spark an end-of-year rally?Dow Jones (DJIA) has been trading within a Channel Up pattern since the late July 2023 High. The decline of the last 30 days can be technically seen as the Bearish Leg that will price its new Higher Low bottom.
The price isn't only close to the Channel's bottom but also the 1W MA50 (blue trend-line), a level that has been supporting since the October 30 2023 bullish break-out. As a result, a 1W MA50 hit will be a potential double support test, with the 1W RSI also printing a Bearish Leg similar to the one that led to the October 2023 bottom.
On the other hand, the ranged price action since the late November 2024 High, resembles the sideways volatility of the first half of 2024. Both were initiated after Higher High pricings at the top of the Channel Up. The rallies that led to those tops have been +21.00% and +23.72% respectively.
If there is a decreasing rate on each Bullish Leg, then the new one should be +17.30% (i.e. -3.30% less than the previous one), which falls marginally below the 1.5 Fibonacci extension, which is where the November 2024 High was priced.
As a result, as long as Dow is closing its 1W candles above the 1W MA50, the 2-year Channel Up is more likely to push upwards again for its new Bullish Leg, potentially targeting 48900 (+17.30%).
-------------------------------------------------------------------------------
** Please LIKE 👍, FOLLOW ✅, SHARE 🙌 and COMMENT ✍ if you enjoy this idea! Also share your ideas and charts in the comments section below! This is best way to keep it relevant, support us, keep the content here free and allow the idea to reach as many people as possible. **
-------------------------------------------------------------------------------
Disclosure: I am part of Trade Nation's Influencer program and receive a monthly fee for using their TradingView charts in my analysis.
💸💸💸💸💸💸
👇 👇 👇 👇 👇 👇
DOW New LowAs per my view DOW is going down side in near future , this is totaly based on price action and Astro based .

AMAZON at important support. Positive days coming?AMZN looking at good support. We can see positive days if it works.
Many cryptocurrency dominance charts, as well as Nasdaq and other stock charts too, showing the same pattern. Is the reversal starting? Check my other analysis too.
We’ll see.
This is not investment advice. Please do your own research.
Wishing you best.
-YusufDeli

DOW JONES MA200 (1d) test on the Channel Up bottom. BULLISH.Dow Jones is trading inside a Channel Up but lately finds itself on a pull back.
This pull back is about to test the MA200 (1d) at the bottom of the pattern.
The MA200 (1d) has been holding as Support since November 3rd 2023, so overall that makes it a buy opportunity.
Trading Plan:
1. Buy on the current market price.
Targets:
1. 46400 (the 1.382 Fibonacci extension).
Tips:
1. The RSI (1d) is almost oversold and at 35.00 it has turned sideways. Every time the RSI was on this level or belowsince October 2023, it was the best buy opportunity.
Please like, follow and comment!!

Digesting the US & Canada job numbers The numbers are out and, so far, the market is reacting logically. Let's dig in!
NASDAQ:AMD
NASDAQ:AVGO
NASDAQ:NVDA
MARKETSCOM:GOLD
MARKETSCOM:EURUSD
MARKETSCOM:DOLLARINDEX
MARKETSCOM:USDCAD
Let us know what you think in the comments below.
Thank you.
74.2% of retail investor accounts lose money when trading CFDs with this provider. You should consider whether you understand how CFDs work and whether you can afford to take the high risk of losing your money. Past performance is not necessarily indicative of future results. The value of investments may fall as well as rise and the investor may not get back the amount initially invested. This content is not intended for nor applicable to residents of the UK. Cryptocurrency CFDs and spread bets are restricted in the UK for all retail clients.

US30 Setup: 50% Fib & Imbalance in Focus for a Potential Short.The US 30 Dow Jones index is under pressure 📉 but is currently hovering around a significant previous support level. I’m watching for a retracement into a four-hour imbalance as a potential opportunity to go short. Additionally, I’m looking for the retrace to align with the equilibrium point, which is the 50% Fibonacci level of the current price swing from high to low 📊. For this trade, the price must stay within the imbalance zone and avoid breaking the high. If there’s a clear break of structure near the imbalance point of interest, I plan to sell 🔻. This is not financial advice. 🚨

SPX S&P 500 Gearing Up For A 10x Over Next 10 yearsSPX looks extremely bullish and the patterns are obvious to me. This parabola will continue into the 2030's and be even more vertical than we've seen in any prior runs. This next decade is going to be wonderful. There may be some corrections along the way but in the bigger picture we are going to go absolutely vertical. Hold onto your hats.
None of this is financial advice just my opinion.

DOW JONES: 1D MA200 and Channel Up bottom. Bullish.Dow Jones is bearish on its 1D technical outlook (RSI = 36.722, MACD = -181.150, ADX = 58.438) as it is running the bearish wave of the 16 month Channel Up. Being so close to the 1D MA200 has been a buy signal since November 2nd 2023. Additionally, the price just hit the 0.382 Fibonacci level from the last consolidation phase. If that's confirmed, then the index is about to complete the new consolidation phase. The target on the previous one has been at least the 3.0 Fibonacci extension. The trade is long, TP = 50,500.
## If you like our free content follow our profile to get more daily ideas. ##
## Comments and likes are greatly appreciated. ##

Dow Jones: Neutrality Strengthens Around 44,000 PointsThe Dow Jones Industrial Average has fluctuated within a 1% range over the past few trading sessions, encountering a neutral barrier near the 44,000-point zone.
For now, investors remain cautious as uncertainty grows amid trade and diplomatic tensions from the White House with multiple countries. This prolonged uncertainty has reinforced a neutral bias in recent price movements.
Persistent Neutrality
Currently, the Dow Jones remains trapped in a sideways range, with:
45,000 resistance at the upper boundary.
42,300 support at the lower boundary.
The price remains in the middle of this range, reinforcing the market’s indecision. As long as price action stays within this zone, the neutral structure may extend further in the coming sessions.
MACD Indicator
MACD movements confirm the current neutral market outlook. Both the MACD line and signal line remain oscillating near the 0 neutral zone.
The histogram also remains close to 0, indicating low momentum. As long as these conditions persist, price neutrality is likely to continue in the coming sessions.
Key Levels to Watch:
45,000 – Key Resistance:
Upper boundary of the sideways range.
A breakout above this level could mark new highs, potentially reviving the long-term uptrend that has been stagnant in recent weeks.
43,000 – Neutral Zone:
Converges with the 50-period and 100-period moving averages.
Also aligns with the 38.2% Fibonacci retracement level.
The most important short-term barrier that could limit any short-term bullish attempt.
If price fails to reclaim this level, bearish momentum could grow.
42,000 – Critical Support:
Lower boundary of the sideways channel. A break below this level could create a stronger bearish bias, potentially threatening the long-term uptrend that has been in place since last year.
By Julian Pineda, CFA – Market Analyst

Dow Oversold reversal, The Week Ahead 03rd March '25The Dow Jones Industrial Average (US30) index maintains a bullish outlook within its long-term uptrend. However, after reaching an all-time high on December 4, 2024, price action has entered a sideways consolidation phase, suggesting indecision in the market.
________________________________________
Bullish Scenario:
• The 42980 level serves as a critical support zone, aligning with the previous consolidation range and the rising trendline.
• A pullback to this level, followed by a bullish rebound, would reaffirm the uptrend and could trigger upside momentum.
• Potential upside targets include:
44240 (20-day moving average)
44660 (next resistance level)
45000 (key psychological resistance)
A strong recovery from 42980 would reinforce bullish sentiment and indicate a continuation of the broader uptrend.
________________________________________
Bearish Scenario:
• A confirmed break below 42980, with a daily close beneath this level, would signal weakness in the uptrend.
• This could lead to a deeper retracement, exposing key downside levels:
42520 (next significant support)
41920 (200-day moving average), a critical level for long-term trend validation
A sustained breakdown below 42980 could shift sentiment in favour of sellers, increasing the probability of further declines.
________________________________________
Market Outlook:
The 42980 level remains pivotal—holding above this zone will keep the bullish trend intact, while a decisive break lower could trigger an extended pullback. Traders should watch for price action signals and volume confirmation at this key level to assess the market's next move.
This communication is for informational purposes only and should not be viewed as any form of recommendation as to a particular course of action or as investment advice. It is not intended as an offer or solicitation for the purchase or sale of any financial instrument or as an official confirmation of any transaction. Opinions, estimates and assumptions expressed herein are made as of the date of this communication and are subject to change without notice. This communication has been prepared based upon information, including market prices, data and other information, believed to be reliable; however, Trade Nation does not warrant its completeness or accuracy. All market prices and market data contained in or attached to this communication are indicative and subject to change without notice.

DJI - Dow Jones Industrial Target 40000sChart analysis can be simple.
We take our tools, surround them with rules and follow them.
The rules and the framework of the Medianlines are simple, but not easy to follow every time.
The Shiff-Fork catches the resistance and support very nicely. Especially at the Center-Line.
Above the Upper-Medianline-Parallel, at the extreme where the stretch became clear, price had a job to to do, to trade up to the Warning Line. But it failed twice so far.
When price fails to trade to the next line, comes back into the Fork, Chances are >90% that we go to the Center-Line. The first time, it failed (10% fail). The second time, with these market sentiment, I'm even more convinced to follow the rules.
Target at the Center-Line around 40'000ish.

Dow Theory Part 1 | Univers Of Signals AcademyWelcome to the Educational Content Section of Our Channel Technical Analysis Training
We aim to produce educational content in playlist format that will teach you technical analysis from A to Z. We will cover topics such as risk and capital management, Dow Theory, support and resistance, trends, market cycles, and more. These lessons are based on our experiences and the book The Handbook of Technical Analysis
🎨 What is Technical Analysis?
Technical Analysis (TA) is a method used to predict price movements in financial markets by analyzing past data, especially price and trading volume. This approach is based on the idea that historical price patterns tend to repeat and can help traders identify profitable opportunities.
🔹 Why is Technical Analysis Important?
Technical analysis helps traders and investors predict future price movements based on past price action. Its importance comes from several key benefits:
Faster Decision-Making: No need to analyze financial reports or complex news—just focus on price patterns and trading volume.
Better Risk Management: Tools like support & resistance, indicators, and chart patterns help traders find the best entry and exit points.
Applicable to All Markets: Technical analysis can be used in Forex, stocks, cryptocurrencies, commodities, and even real estate.
Understanding Market Psychology: Charts reveal investor emotions like fear and greed, allowing traders to react accordingly.
📌 Real-Life Example
Imagine you own a mobile phone shop and want to predict whether phone prices will go up or down in the next few months.
🔹 Fundamental Analysis Approach
You follow the news and see that the USD exchange rate is rising, and phone manufacturers plan to increase prices. Based on this, you predict that phone prices will go up soon.
🔹 Technical Analysis Approach
You analyze past price trends and notice that every year, phone prices tend to increase before the New Year. This pattern has repeated for several years, so you assume it will happen again. As a result, you buy stock before the price hike and make a profit.
This example shows that technical analysis allows you to make decisions based on past market behavior without relying on external news.
📊 Introduction to Dow Theory
Today, for the first part of our lessons, we will begin with Dow Theory, which was developed by American journalist Charles Dow. Many traders still use this method for analysis and trading.
Dow Theory is one of the fundamental concepts in technical analysis, developed by Charles Dow, the founder of The Wall Street Journal and co-founder of the Dow Jones Industrial Average (DJIA). This theory provides a structured approach to understanding market trends and price movements and is still widely used today by traders and analysts.
Dow Theory consists of six core principles, which we will explain in detail:
📑 Principles of Dow Theory
1 - The Averages Discount Everything (Not applicable to crypto)
2 - The Market Has Three Trends
3 - Trends Have Three Phases
4 - Trend Continues Until a Reversal is Confirmed
5 - The Averages Must Confirm Each Other
6 - Volume Confirms the Trend
💵 Principle 1: Price is All You Need
According to this principle, all available information is already reflected in asset prices. This includes economic data, political events, earnings reports, trader expectations, and even market sentiment.
If a company releases strong earnings, its stock price might not rise significantly because investors had already anticipated this and bought in advance.
❗ Why This Is Important
Technical analysts focus on price movements rather than external news since all information is already factored into the market.
Instead of reacting to news, traders analyze historical price trends to predict future price movements.
📊 Principle 2: The Market Has Three Types of Trends
Dow Theory states that markets move in three types of trends, each occurring over different timeframes:
1 - Primary Trend: This is the main movement of the market, dictating the long-term direction, and can last for years.
2 - Secondary Trends: These are corrective movements that run opposite to the primary trend. For instance, if the primary trend is bullish, the corrective trend will be bearish. These trends can last from weeks to months.
3- Minor Trends: These are the daily price fluctuations in the asset. Although minor trends can last for weeks, their direction will always align with the primary trend, even if they contradict the secondary trend.
💡 Final Thoughts for Today
This is the end of this part, and I must say we have a long journey ahead. We will continually strive to produce better content every day, steering clear of sensationalized content that promises unrealistic profits, and instead, focusing on the proper learning path of technical analysis.
⚠️ Please remember that these lessons represent our personal view of the market and should not be considered financial advice for investment.

DOW pullback triggered by weak US consumer confidenceThe Dow (US30) index price action sentiment appears bullish, supported by the longer-term prevailing uptrend. However, since reaching an all-time high on 04th December 2024 the Dow index price action is consolidating in a sideways trading range.
The key trading level is at 42980, the previous consolidation zone and the rising support trendline. A corrective pullback from the current levels and a bullish bounce back from the 42980 level could target the upside resistance at 43800 followed by the 44080 and 44540 levels over the longer timeframe.
Alternatively, a confirmed loss of 42980 support and a daily close below that level would negate the bullish outlook opening the way for a further retracement and a retest of 42520 support level followed by 41820 (200 Day Moving Average).
This communication is for informational purposes only and should not be viewed as any form of recommendation as to a particular course of action or as investment advice. It is not intended as an offer or solicitation for the purchase or sale of any financial instrument or as an official confirmation of any transaction. Opinions, estimates and assumptions expressed herein are made as of the date of this communication and are subject to change without notice. This communication has been prepared based upon information, including market prices, data and other information, believed to be reliable; however, Trade Nation does not warrant its completeness or accuracy. All market prices and market data contained in or attached to this communication are indicative and subject to change without notice.
