SHORT US30 HAS BEEN PREPAREDTeam, we have been prepare to SHORT US30/DOW at the current market price
Why do we enter the short before the CPI. It a good psychology that the market would expect poor data come out base on last Friday sell off. Similar market expectation.
Short position at 40725-15 , with stop loss at 40779.80
Target at 40592.70
DOW

US30 | Trade ideaKey Points:
Tesla: Shares fell 1.6% after a report that the company plans to produce a six-seat Model Y in China by late 2025.
Boeing: Dropped 7.3% following a downgrade from Wells Fargo to "underweight" from "equal weight."
Nvidia: Slumped nearly 10%, wiping out a record $279 billion in market value, marking the largest single-day decline for a U.S. company.
U.S. Manufacturing: Edged up in August from an eight-month low but remained subdued, according to ISM data.
Market Performance:
S&P 500 fell 2.1%
Nasdaq dropped 3.3%
Dow declined 1.5%
This marks the biggest daily percentage decline for these indexes since early August.
Nine out of 11 S&P 500 sectors fell, with technology, energy, communication services, and materials leading the decline.
Market Sentiment: Weakened amid concerns about the Federal Reserve’s interest rate decisions, with September being historically one of the worst months for stock market performance.
Volatility: The CBOE Volatility Index (VIX) jumped 33.2% to 20.72, the highest close since early August.
Trading Volume: Totaled 12.14 billion shares across U.S. exchanges, above the 20-day moving average of nearly 11 billion.
Labor Market: Traders are awaiting labor market reports ahead of the August non-farm payrolls data.
Fed Meeting: Scheduled for Sept. 17-18, with a 63% chance of a 25-basis point rate cut and a 37% chance of a 50-basis point cut, according to the CME FedWatch Tool.
Market Breadth: On the NYSE, declining issues outnumbered advancers by 2.52-to-1, while on the Nasdaq, decliners outnumbered advancers by 3.5-to-1.

Dow Futures (YM) room to 42kBreak of ATH into month end has set up a somewhat easy push to new highs at 42,375 fib extension level into the first week of the month. Markets as a whole ended the month strong and look juiced to try for new highs despite election polls/odds

DOW JONES correction to extend until the Fed.Dow Jones (DJI) did what we expected of it 3 weeks ago (August 13, see chart below) and after pricing a Higher Low at the bottom of the 5-month Channel Up, it rebounded and reached the All Time High (ATH), pricing a Higher High:
In continuation of that analysis, we now expect the new Bearish Leg to extend to possibly as low as the 0.618 Fibonacci retracement level, which was the case with the May 30 pull-back.
The 1D RSI suggests that a 35.00 value would be ideal to signal a buy (same as May 30, see how both RSI fractals priced the top on the 70.00 overbought limit), while a Bullish Cross on the 1D MACD would be the final confirmation of the buy.
Our long-term Target remains 42400 (+11.00% from the Higher Low, the same % rise as the July 18 High).
-------------------------------------------------------------------------------
** Please LIKE 👍, FOLLOW ✅, SHARE 🙌 and COMMENT ✍ if you enjoy this idea! Also share your ideas and charts in the comments section below! This is best way to keep it relevant, support us, keep the content here free and allow the idea to reach as many people as possible. **
-------------------------------------------------------------------------------
💸💸💸💸💸💸
👇 👇 👇 👇 👇 👇

Technical Review–Agape ATP Corporation (ATPC)
As investors loom over the slowdown in the US market, the Dow Jones had tumbled close to 500 points in a single trading day. With this, our key stock pick, Agape ATP Corporation (ATPC) sees selling pressure, however a strong support was formed around $1.570 key support level (S1). We believe this selling is short term in nature, and both RSI and MACD showed a trade divergence where there is actually accumulation exercise in place for the shares of ATPC in the range of $1.570 ~ $1.800.
We had commenced accumulation around $1.600 level.

INTEL SHORT TRADE : 22% Gain - All Profits Done and Dusted!INTEL SHORT TRADE
Short entry at: 34.74
Stoploss: 35.95
Profit targets:
TP1: 33.24
TP2: 30.81
TP3: 28.39
TP4: 26.89
All targets done - INTEL!
Please follow for more analysis, tips and trade setups.

Weekly Recap & Market Forecast $SPX (Sept 1st —> Sept 6th)**DIYWallST Weekly Recap & Market Forecast**
---
Hello Investors! 🌟 This week saw mixed movements in the stock markets as strength in consumer staples, energy, and financials helped offset weakness in discretionary and technology shares. Let’s dive into the key events that shaped the financial landscape. 📈
**Market Overview:**
The week began with consumer staples, energy, and financials providing support to the markets, counterbalancing the softness in discretionary and technology shares ahead of key earnings reports in those sectors. Oil prices rose early in the week as Israel responded to a Hezbollah attack from the North, and uncertainty over Libya’s production reemerged. However, crude prices fell back later in the week after a report suggested OPEC+ might proceed with a planned ‘gradual’ oil output increase starting in October. Gold prices continued to set new all-time highs, maintaining their recent outperformance over bitcoin. The S&P 500 encountered resistance around 5,600—a level approximately 20x average 2025 S&P earnings estimates, which moved up towards $275 following Nvidia and other companies' quarterly results. Stock indexes closed mixed for the week, with the S&P edging up 0.2%, the DJIA rising 0.9%, and the Nasdaq down by 0.9%.
**Stock Market Performance:**
- 📈 S&P 500: Up by 0.2%
- 📈 Dow Jones: Up by 0.9%
- 📉 NASDAQ: Down by 0.9%
**Economic Indicators:**
Economic data this week supported the expectation of more central bank rate cuts next month:
- **European CPI:** Preliminary German and French CPI fell below the ECB’s 2% target for the first time since August 2021, reinforcing expectations of a rate cut from the ECB in September.
- **US Durable Goods:** July data rebounded sharply as expected, but core capital goods (nondefense excluding aircraft) were disappointing, showing no monthly increase since April.
- **Richmond Fed Index:** The August print was soft, contracting to a level not seen since the pandemic.
- **PCE Inflation Data:** The Fed’s preferred inflation gauge did little to alter expectations for a September rate cut, while Q2 preliminary GDP and July personal consumption data remained solid.
- **US Yield Curve:** The 2-10 spread moved closer to de-inverting, with just a few basis points separating it from positive territory.
**Corporate News:**
Earnings reports continued to be a major market driver, especially in the retail sector, which delivered mixed signals:
- **Best Buy:** Exceeded earnings expectations despite posting its 11th consecutive quarter of negative US same-store sales, highlighting that consumers are seeking value but still willing to invest in new technologies.
- **Dollar General:** Missed estimates and confirmed that lower-end consumers are struggling, with many running out of paychecks before month-end and relying on credit cards for basic needs.
- **PDD (Temu-parent):** Shares were hit hard after the company reported that intensifying competition was pressuring revenue growth.
- **Nvidia:** Beat earnings expectations again but saw a slightly more modest increase in guidance than usual, leading to a retracement in big tech stocks on Thursday.
- **Marvell Technology:** Impressed investors with a strong earnings report and forecasted that custom silicon would become a significant revenue growth driver.
- **Intel:** Reportedly considering a major restructuring, which could include spinning off its foundry business.
- **Paramount:** The latest development in the ongoing acquisition saga saw the Edgar Bronfman Jr.-led consortium withdraw its proposal, clearing the way for Skydance to close the deal.
**Looking Ahead:**
Next week will bring several key events and data releases:
- **U.S. Jobs Report**
- **U.S. PMI Surveys**
- **Fed Beige Book**
- **Earnings Reports:** Broadcom ( NASDAQ:AVGO ), Dollar Tree ( NASDAQ:DLTR ), Dick’s Sporting Goods ( NYSE:DKS ), Nio ( NYSE:NIO )
- **Labor Day Holiday:** Markets will be closed on Monday
As we move forward, these developments will be crucial in shaping market sentiment and guiding investment decisions. If you have any questions or need further insights, feel free to reach out. Here’s to another week of informed investing and strategic decision-making! 🌟

Breaking down Dow Jones Elliott WavesThe above chart is my main hypothesis for the Elliott Wave count of Dow Jones which represents the Elliott Wave Analysis of the Bull Market Post 2008 financial crisis.
Kindly read all the details to better understand the Elliott Wave analysis and how Elliott Waves can be used to give us an edge in trading.
Currently it looks like we are in an Ending Diagonal waves. The reason we are in Ending Diagonal Wave 3 instead of Wave B of ABC flat is because we are too far up now for our current market to be considered in wave B of an ABC flat.
The 2008 crisis bear market was an ABC flat, if you look, we crashed at that time when Wave B was at around 138% of Wave A.
I have attached sub wave structure of the rally we have seen so far after the COVID crash.
I have explained my reasoning for my wave counts in the chart which you can take a look.
Now moving further inside our sub waves, below chart shows the sub wave structure of the ABC wave we are in since 27 October, 2023
Further moving inside our sub waves, the chart below shows the breakdown waves of our this year move. Once all the waves shown in the below chart finish, we should see a correction towards our Post COVID peak price levels.

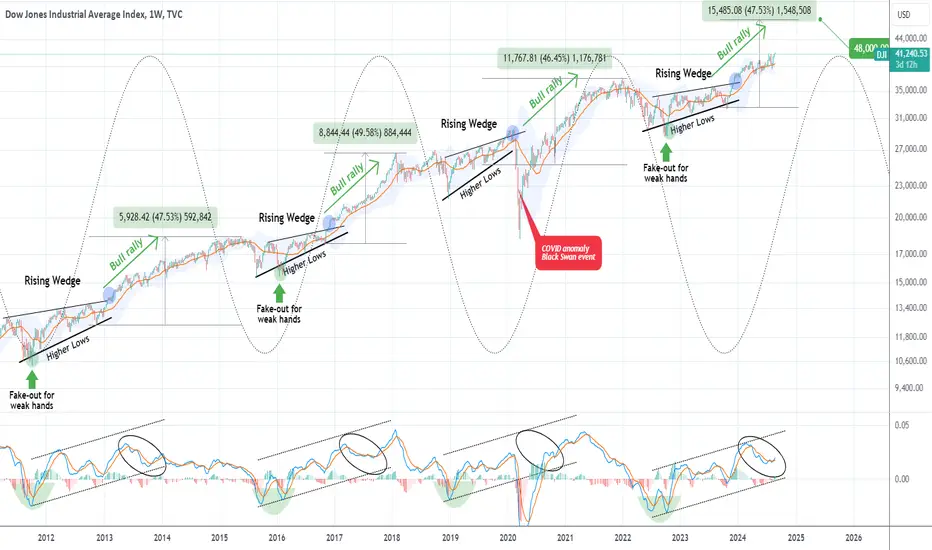
DOW JONES The pattern that never failed is now targeting 48000Dow Jones (DJI) gave us the best bullish break-out signal of the year 8 months ago (December 13 2023, see chart below), as our buy entry at 36577 is very close to hitting our 42900 Target:
At that time we made a clear point why that rally 'shouldn't surprise you' and now you see why. This 1W time-frame chart shows the cyclical behavior of the index, which peaks (Sine Wave top) then pulls back and starts forming a Rising Wedge (Sine Wave bottom) and when it breaks above the Rising Wedge, is where it flashed the bullish break-out signal we got back in December.
As you can see it then starts a gradual rise on the BB20 and completes the Cycle again (Sine Wave top) after roughly a +47% rally. The title mentions that this pattern 'never failed', in practice it only broke during the COVID flash crash, which is a non-technical event than occurs once every 100 years. As you can see even the 1W MACD sequences between the cyclical patterns are identical.
As a result, our Target towards the Sine Wave peak is 48000.
-------------------------------------------------------------------------------
** Please LIKE 👍, FOLLOW ✅, SHARE 🙌 and COMMENT ✍ if you enjoy this idea! Also share your ideas and charts in the comments section below! This is best way to keep it relevant, support us, keep the content here free and allow the idea to reach as many people as possible. **
-------------------------------------------------------------------------------
💸💸💸💸💸💸
👇 👇 👇 👇 👇 👇
Dow30 - US30 Faces DownturnBLACKBULL:US30 has returned to a crucial resistance zone, which aligns with a bearish technical setup. After the recent decline, this move back to the resistance suggests that a further drop may be imminent, especially if the index fails to break above this zone. The pattern indicates that TVC:DJI could start its downward trend again following a retest of this level, where sellers are likely to re-enter the market.
Fundamentally, the rising unemployment claims in the U.S. have heightened fears of a recession. With more individuals out of work, consumer spending could slow down, which negatively impacts corporate earnings and the broader economy. This situation could exert additional downward pressure on the Dow Jones, making the possibility of a significant decline more likely as investors brace for potential economic contraction.

The Future is UP and Gone.This is obviousness. The future is MOON and DOOM. '
2029 is the biggening of the end... hyperinflation and riots. And collapse of our American society. And the USA dollar.. The 2028 elections will be devastating. And will be last elections.

DJI Weekly Rising Narrowing WedgeDow Jones Industrial Average has not shown many signs of slowing in its growth.
Here is a bearish biased shape playing out on the weekly chart in the form of a rising narrowing wedge.
Strictly PA, strictly structure. Keep an eye on this.
Looking for a Macro correction to reach to the .236 or the .382 on a corrective movement.
This is a follow up to a macro long idea on the DJI posted back in March 25th 2023.
NFA
Do your own DD
Like Comment and Share!

Dow Jones Surges on Surprising Jobs Data, Rebounding from LossesThe Dow Jones Industrial Average staged an impressive rally on Thursday, soaring more than 650 points as positive economic data injected fresh optimism into the markets. The blue-chip index reclaimed its 50-day moving average, providing a much-needed boost after a week of significant losses.
Jobs Data Sparks Market Rally
The unexpected drop in initial jobless claims, which fell to 233,000 for the week ended August 3rd, well below the anticipated 240,000, fueled the market's surge. This sharp decline in unemployment claims eased concerns of a looming recession, pushing investors to return to the market with renewed confidence. The strong jobs report was particularly encouraging given the previous week's claims hit a one-year high of 250,000, stoking fears of economic slowdown.
As a result, the Dow Jones jumped 2.24% in late trading, with key gainers including Intel ( NASDAQ:INTC ) and Salesforce ( NYSE:CRM ), which saw gains of over 6% and 3%, respectively. The S&P 500 followed suit, surging 2.3%—its best day of the year—while the Nasdaq Composite rebounded 2.8%, finding support well above its 200-day moving average.
Earnings Hits and Misses
While the broader market celebrated the positive economic news, not all stocks were so fortunate. McKesson (MCK) and Monster Beverage (MNST) were the worst performers in the S&P 500, both diving on disappointing earnings reports. Conversely, Parker Hannifin (PH) and Eli Lilly (LLY) led the S&P gainers, posting strong results that sent their shares higher. Over in the Nasdaq, semiconductor stocks such as Arm Holdings (ARM) and On Semiconductor (ON) led the charge, contributing to the index's impressive rally.
Volume and Market Sentiment
Despite the bullish price action, trading volume was lower on both the New York Stock Exchange and Nasdaq compared to Wednesday's session. However, market breadth was decidedly positive, with advancers outpacing decliners by nearly 4-to-1 on the NYSE and slightly less than 3-to-1 on the Nasdaq.
The DOW Jones stock index displays a long-term rising wedge pattern subsequent to an extensive consolidation phase. The support point at December 2023 now serves as a pivot, with any movement below it indicating a bearish reversal pattern. Despite prevailing market conditions, the DOW Jones stock index has exhibited substantial growth.
Investor sentiment, as reported by Investors Intelligence, reflected the market's mixed emotions. The ratio of bullish advisors dropped to 46.9% from 59.4% over the past two weeks, while bearish sentiment increased to 18.7% from 15.6%. The report highlighted concerns about elevated market risk and limited cash on the sidelines to fuel further gains.
Treasury Yields and Oil Prices
In bond markets, the yield on the benchmark 10-year Treasury note rose by four basis points to 4%, reflecting the market's cautious optimism following the jobs report. Meanwhile, oil prices also ticked higher, with West Texas Intermediate futures trading around $75.30 a barrel, indicating ongoing strength in the energy sector.
Looking Ahead
As the Dow Jones and other major indexes continue to recover from recent losses, investors will be closely watching upcoming economic data and earnings reports for further signs of market direction. The surprising strength in the labor market has provided a temporary reprieve from recession fears, but with inflation concerns and interest rate hikes still looming, the road ahead may be bumpy.
For now, however, Thursday's rally offers a glimmer of hope that the worst may be behind us, as Wall Street looks to build on this momentum in the days ahead.

Dow Jones (US30) Outlook ICT ConceptsDow Jones Industrial Average (US30) Analysis
💰 Welcome to Your Channel!
Welcome to our channel where we delve into the intricacies of financial markets. Today, we focus on US30, dissecting its current price action to uncover strategic trading opportunities. Join us as we analyze key levels and market dynamics, aiming to refine our trading strategies and maximize potential gains.
💡 Previous Analysis Review:
In the previous analysis, we expected the price to expand lower after the Market Structure Shift (MSS), which occurred as anticipated.
📍 Current Market Overview:
The current price is around 38,643.10. The Dow Jones Industrial Average (US30) has swept both the Previous Month Low (PML) and Previous Week Low (PWL), which are significant liquidity levels. The price is currently within a 4H Fair Value Gap (FVG), marked by a line on the chart.
🔍 Identifying Key Levels:
• PMH: Previous Month High
• PWH: Previous Week High
• PWL: Previous Week Low
• PML: Previous Month Low
• BSL: Buy-Side Liquidity
• SSL: Sell-Side Liquidity
• 4H FVG: 4-Hour Fair Value Gap
• MSS: Market Structure Shift
📊 Key Considerations:
• Swept PML & PWL: The price has swept the Previous Month Low and Previous Week Low, indicating the potential for a reversal or at least a short-term expansion higher.
• Inside 4H FVG: The price is within the 4H FVG, which could serve as a support zone for a possible expansion higher.
• Reaction to Bearish FVGs: The key to the next movement lies in how the price reacts to the two bearish FVGs above.
📈 Bullish Scenario:
Given the current price action and key considerations, a bullish scenario is possible if the following conditions are met:
• Support from 4H FVG: The 4H FVG provides support, and the price begins to expand higher.
• Reaction to Bearish FVGs: Watch the reaction to the bearish FVGs above; if the price can break through these, it would confirm the bullish bias.
📉 Bearish Scenario:
A bearish scenario should be considered if the following conditions are met:
• Sweep of Lower Time Frame BSL: On lower time frames, we need to see buy-side liquidity levels swept before considering short positions.
• Target Lower Objectives: After the sweep of lower time frame BSL, the price could target lower objectives such as the SSL (Sell-Side Liquidity) marked below on the chart.
📊 Chart Analysis Summary:
• Bullish Expectation: The price is in a key area after sweeping PML and PWL, and being inside the 4H FVG. We can expect a possible expansion higher from here, especially if the price holds within the 4H FVG and breaks through the bearish FVGs above.
• Bearish Expectation: For a bearish scenario, wait for lower time frame buy-side liquidity to be swept, followed by a reversal to target lower levels like the SSL below.
Conclusion:
The Dow Jones Industrial Average is at a critical juncture after sweeping key liquidity levels and entering a 4H FVG. The next move depends largely on the reaction to the bearish FVGs above. A bullish scenario would see an expansion higher if the 4H FVG holds and the price breaks through the bearish FVGs. A bearish scenario would require a sweep of lower time frame BSL and then a move lower to target SSL and other lower objectives.
🙏 Thank you for joining us!
Exploring US30 today highlighted the importance of effective risk management in trading success. Prioritize research, implement robust strategies, and seek guidance for confident market navigation. Stay tuned for more insights on our channel. Here's to profitable trading and continuous learning!
⚠️ Disclaimer
The information provided here is for educational purposes only and should not be taken as financial advice. Always conduct your own research and consult a licensed financial advisor before making any investment decisions.

US30 - 4H DowJones is in a pullbackThe Dow Jones Industrial Average (DJIA) is currently facing significant bearish pressure, as indicated by recent market trends and technical analysis. The support trend line has broken, leading to a notable drop in the index. This break, coupled with a clear pullback, presents an opportune moment for traders to consider short positions with a logical stop loss.
From a fundamental perspective, the rising rate of unemployment and the postponement of interest rate cuts are increasing the chances of a recession. These economic indicators suggest that the market could experience further declines as investors react to the potential economic downturn.

DOW JONES Is a new rally starting right under our nose again?Consistent with our macro approach to investing (particularly with stocks), we continue to address the recent stock market correction by examining similar behavioural patterns of the past.
It was 10 months ago (October 11 2023, see chart below), when Dow Jones (DJI) was under another short-term turmoil phase that turned out to be exactly that, short-term:
As you can see on that chart, while most were panic selling, we addressed the idea that Dow was "starting a new Bull rally under our nose". And as you can see, the index did exactly that, as it rebounded at the bottom (Higher Lows trend-line) of the Rising Wedge, starting a new +23% rally.
Our basis for this projection was the similar Rising Wedge pattern of September 2015 - November 2016 (almost 1 year), which after a fake-out for the week hands (green circle) on January 2016 (as it was on October 2022), it rebounded in October 2016 at the bottom of the Wedge and posted a +19% rally.
You can see that so far the lows are highly symmetrical as the first was priced in the month of October (2016 then and 2023 now) and the next in April (2017 and 2024 respectively).
The initial rally that broke above the Rising Wedge in 2017, had a small upward extension that then gave a new pull-back for an August 2017. If symmetry continues to dictate the price action, then the current August Low (2024), may be our new bottom as Aug 2017 was.
On the past fractal, the new rally was concluded on a +30.72% rise. As a result, we see it highly possible to get a new long-term peak early next year (January 2025 if symmetry continues) at around 49000.
High as this Target may seem at the moment with the current economic slowdown fears, these are the standard conditions that make rallies start "under our nose".. Especially as November's U.S. elections are approaching.
-------------------------------------------------------------------------------
** Please LIKE 👍, FOLLOW ✅, SHARE 🙌 and COMMENT ✍ if you enjoy this idea! Also share your ideas and charts in the comments section below! This is best way to keep it relevant, support us, keep the content here free and allow the idea to reach as many people as possible. **
-------------------------------------------------------------------------------
💸💸💸💸💸💸
👇 👇 👇 👇 👇 👇

Trend is your Friend. #NKE is a prime example...fade the bullish moves
look for continuation down
that is going to be the money maker
shorting into resistance
not longing on reversals

Combined US Equities - D-Day +1on 31 July, heads up given about D-day. That was based simply of a few compelling technical factors observed.
Outcome was that there was a blow out rally, followed by an awesome Dark Cloud Cover and then a confirmation bearish candle that gapped down and tanked the week to a low. The spike in volatility was just so awesome and it caught many off guard, unfortunately.
Technical indicators were previously mentioned to be bearish already and now it is very evidently so.
Projecting further using supports and TD Sequential, it is also evident that by breaking below the support that closes the gap too was so critical... it broke the TDST support as well. This means that the TD Sequential trend is now bearish, with an expected one bearish week to go.
So all together... a significant technical breakdown.
Some bounce expected, but week ahead looks bearish.
Projected target marked (red ellipse).
Take care!

DOW JONES Any pull-back is a short-term buy opportunity.The Dow Jones Industrial Average Index (DJIA) is completing an Inverse Head and Shoulders (IH&S) pattern following the recovery of its 4H MA50 (blue trend-line). Since the dominant medium-term pattern since the April 19 Low is a Channel Up, any pull-back this short-term IH&S offers, is a technical buy opportunity.
The previous Channel Up Higher Low of May 30 offered one final Higher Low pull-back below the 4H MA50 before the new Bullish Leg started towards the Channel's top (Higher Highs trend-line). Check how their 1D RSI fractals are similar among the two sequences.
As a result, once today's Fed euphoria recedes, we expect one last buy opportunity to emerge with a short-term Target of 42000 (top of blue Channel Up), if note higher on the Diverging Channel Up.
-------------------------------------------------------------------------------
** Please LIKE 👍, FOLLOW ✅, SHARE 🙌 and COMMENT ✍ if you enjoy this idea! Also share your ideas and charts in the comments section below! This is best way to keep it relevant, support us, keep the content here free and allow the idea to reach as many people as possible. **
-------------------------------------------------------------------------------
💸💸💸💸💸💸
👇 👇 👇 👇 👇 👇

Combined US equities - D-DayYesterday, the Gap reopened, after an early week stall on Monday. These last two candles have top wicks suggesting selling pressure to keep the gap open. Thing is, I would have preferred to see a more solid down candle.
Meanwhile, this indecision is biased to the downside from indicators and longer term chart (week) point of view. The MACD is in bearish territory and the VolDiv is bearish too. Price has been supported and one of two things will happen:
1. More probable is the volatility spike and markets breakdown fast as they are overdue; or
2. the less likely sudden extreme bullish rally, at the risk of being a blow out top or near term double top for a bigger bolder downside drop in a few months.
Given these, and other supporting charts for a probable downside, I would watch the support breaks very closely.

Dow Jones - The Next Bull Run Is ImminentThe time has come: the next bull run in the Dow is about to begin.
The reasons for our bullish assessment can be found in the notes in the chart.

#XAU #XAUUSD #GOLD #Update #Short #ShortSetup #Eddy#XAU #XAUUSD #GOLD #Update #Short #ShortSetup #Eddy
According to the specific structure of the distribution, it is in the final phase and soon gold will fall to the specified level. (( This analysis is based on supply and demand style as well as Wyckoff and Dow theory. ))
Related Analysis of Gold : (( XAU/USD )) : Check Link :
My Analysis of Dollar : (( XAU/USD )) : Check Link :

Combined US Indexes shows imminent troublesThe week earlier saw the combined index chart log a double top, where last week started to break down. By midweek, the gap (from the previous rally after a breakout) closed. The week ended with a gap reopening.
On Friday, this would normally signal a reversal and a bullish reopening of the gap, but it looks a lot less likely given that the MACD is clearly downtrending, as well as the VolDiv confirming bearishness in more ways than one... going below zero line, etc.
So, for what it is worth, the reopening is likely to be a flash in the pan, and once it makes a lower low next week, it would really let it go - DOWN
