Dow30 Bearish for 2023Preceding a broadening formation
It seems higher probability to sell DOW30 than to buy it.
Dow30

YM1! US30USD DOW 2023 JAN 01
YM1! US30USD DOW 2023 JAN 01
Welcome us to 2023. Wishing you much trading success
for the new year and great health!
Possible scenarios:
1) Short on rejection at 34607 / 32789
2) Long if supported at 30513 / 28635
Weekly: Low vol down bar close at middle = indecisive
Daily: Low vol down bar close toward high = No Supply
H4: High vol up bar closed at high = demand
Price reaction levels
Short on Test and Reject | Long on Test and Accept
35750 35330 34605-34283
33455 32789 30513
28635
Remember to like and follow if you find this useful.
Have a profitable week ahead.

We Bull!The Dow has to make a new ATH and to do it these stocks have to join the party.
Unemployment rate climbs as DOW makes ATH, then rate cuts will cut the DOW in half over next year.

DJ30 - Expect trading to remain mixed and volatile.DJ30 - Intraday - We look to Buy at 32824 (stop at 32600)
Intraday, and we are between bespoke support and resistance 32824-33421. Expect trading to remain mixed and volatile. We have a 61.8% Fibonacci pullback level of 32821 from 32439 to 33439. Preferred trade is to buy on dips.
Our profit targets will be 33421 and 33779
Resistance: 33422 / 33779 / 334425
Support: 32824 / 32653 / 32439
Please be advised that the information presented on TradingView is provided to Vantage (‘Vantage Global Limited’, ‘we’) by a third-party provider (‘Signal Centre’). Please be reminded that you are solely responsible for the trading decisions on your account. There is a very high degree of risk involved in trading. Any information and/or content is intended entirely for research, educational and informational purposes only and does not constitute investment or consultation advice or investment strategy. The information is not tailored to the investment needs of any specific person and therefore does not involve a consideration of any of the investment objectives, financial situation or needs of any viewer that may receive it. Kindly also note that past performance is not a reliable indicator of future results. Actual results may differ materially from those anticipated in forward-looking or past performance statements. We assume no liability as to the accuracy or completeness of any of the information and/or content provided herein and the Company cannot be held responsible for any omission, mistake nor for any loss or damage including without limitation to any loss of profit which may arise from reliance on any information supplied by Signal Centre.

Buying DOW at 4H candle closes.DOW30 - Intraday - We look to Buy at 32811 (stop at 32561)
The medium term bias remains bearish.
The 261.8% Fibonacci extension is located at 28943 from 34939 to 32649.
Bespoke support is located at 28933.
Although the anticipated move higher is corrective, it does offer ample risk/reward today.
Our profit targets will be 33558 and 34093
Resistance: 33558 / 34093 / 35000
Support: 32810 / 32709 / 28943
Disclaimer – Saxo Bank Group.
Please be reminded – you alone are responsible for your trading – both gains and losses. There is a very high degree of risk involved in trading. The technical analysis , like any and all indicators, strategies, columns, articles and other features accessible on/though this site (including those from Signal Centre) are for informational purposes only and should not be construed as investment advice by you. Such technical analysis are believed to be obtained from sources believed to be reliable, but not warrant their respective completeness or accuracy, or warrant any results from the use of the information. Your use of the technical analysis , as would also your use of any and all mentioned indicators, strategies, columns, articles and all other features, is entirely at your own risk and it is your sole responsibility to evaluate the accuracy, completeness and usefulness (including suitability) of the information. You should assess the risk of any trade with your financial adviser and make your own independent decision(s) regarding any tradable products which may be the subject matter of the technical analysis or any of the said indicators, strategies, columns, articles and all other features.
Please also be reminded that if despite the above, any of the said technical analysis (or any of the said indicators, strategies, columns, articles and other features accessible on/through this site) is found to be advisory or a recommendation; and not merely informational in nature, the same is in any event provided with the intention of being for general circulation and availability only. As such it is not intended to and does not form part of any offer or recommendation directed at you specifically, or have any regard to the investment objectives, financial situation or needs of yourself or any other specific person. Before committing to a trade or investment therefore, please seek advice from a financial or other professional adviser regarding the suitability of the product for you and (where available) read the relevant product offer/description documents, including the risk disclosures. If you do not wish to seek such financial advice, please still exercise your mind and consider carefully whether the product is suitable for you because you alone remain responsible for your trading – both gains and losses.

DJ30 - Bias remains bearishDJ30 - Intraday - We look to Sell at 33735 (stop at 33885)
The 261.8% Fibonacci extension is located at 34398 from 28612 to 30822. The medium-term bias remains bearish. Bespoke resistance is located at 33735. Rallies continue to attract sellers.
Our profit targets will be 33400 and 32700
Resistance: 33735 / 34000 / 34400
Support: 33400 / 32697 / 32600
Please be advised that the information presented on TradingView is provided to Vantage (‘Vantage Global Limited’, ‘we’) by a third-party provider (‘Signal Centre’). Please be reminded that you are solely responsible for the trading decisions on your account. There is a very high degree of risk involved in trading. Any information and/or content is intended entirely for research, educational and informational purposes only and does not constitute investment or consultation advice or investment strategy. The information is not tailored to the investment needs of any specific person and therefore does not involve a consideration of any of the investment objectives, financial situation or needs of any viewer that may receive it. Kindly also note that past performance is not a reliable indicator of future results. Actual results may differ materially from those anticipated in forward-looking or past performance statements. We assume no liability as to the accuracy or completeness of any of the information and/or content provided herein and the Company cannot be held responsible for any omission, mistake nor for any loss or damage including without limitation to any loss of profit which may arise from reliance on any information supplied by Signal Centre.

Dow Jones, downwards to support. US30Hello guys, Everything is clear on the chart for you like always. The market going down to the support zone and there it will show us whether it stay bullish or the trend will turn to bearish. So monitor the price's action in the circle.
Good luck.
If you like the idea, do not forget to support with a like and follow me for next analysis :)
Write your comment and opinion below to me

US30USD YM1! DOW 2022 Dec 12
US30USD YM1! DOW 2022 Dec 12
Scenario3 Long at 33800 and Scenario1 short @ 34246 were fruitful.
This shows the importance of waiting for price reaction at the
price levels.
I'll be off trading for the holiday season, see you in 2023.
Possible scenarios:
1) Have a good break and return in 2023
2) Short on rejection at 34607 / 33455
3) Long if supported at 33455
Price reaction levels
Short on Test and Reject | Long on Test and Accept
35750 35330 34605-34283
33455 31848 30513
28635
Weekly: Ave vol down bar close off low = minor weakness
H4: Supply observed
Remember to like and follow if you find this useful.
Have a profitable week ahead.

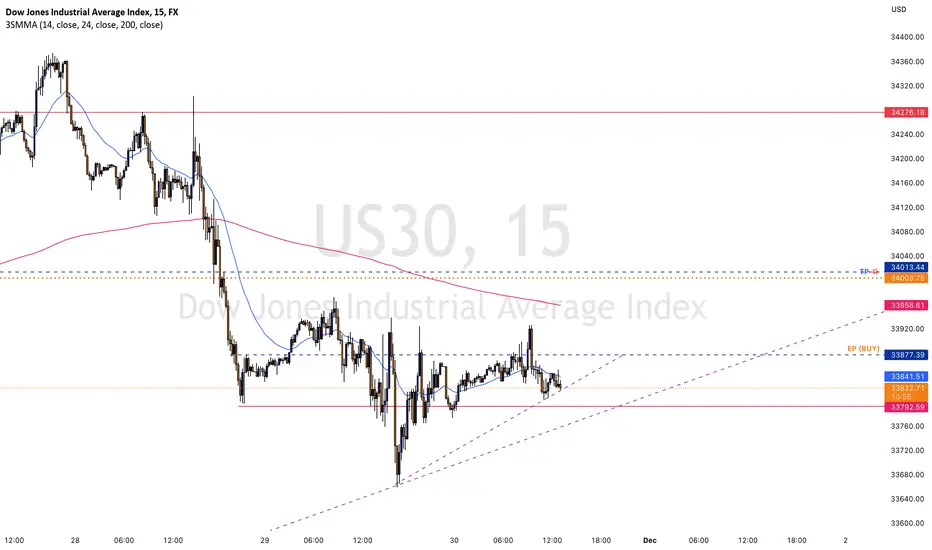
US30 (High Probability BUY Setup SOON)!!
Here we can see clearly the next move for DOW30 today, with the coming USD Core PPI m/m and PPI m/m at 1:30 ( GMT + 00:00 ) London time,
We've got our EP (blue line) and our TP (golden lines),
Keep a close eye on US30 today,
HAPPY PIP HUNTING TRADERS.
FXKIllA.

DOW JONES ready to rally! Inflation peaked on a 100 year line!The Dow Jones index (DJI) has been on an enormous rise since late September that even made a Higher High above the 2022 descending Resistance. With inflation being the main catalyst of this 2022 correction, it should come as no surprise that when it normalizes, the index can start seeing growth again.
Well on July the Inflation Rate (USIRYY) got rejected on its most important Resistance level, the Lower Highs trend-line that has been in place since May 1920! This 100 year old trend-line has had another 2 rejections on inflationary peaks (February 1947 and March 1980).
As this chart shows, every inflation drop from a Lower Highs peak was followed by a multi-year rally on Dow Jones, essentially a new expansion period. An exception parhaps was May 1920 when DJI continued to fall for another year, despite a massive correction on Inflation.
As a result, if this Inflation rejection is sustainable and is the start of a major correction, it is more likely to see the stock market rally and enter a new period of growth.
What do you think?
-------------------------------------------------------------------------------
** Please LIKE 👍, SUBSCRIBE ✅, SHARE 🙌 and COMMENT ✍ if you enjoy this idea! Also share your ideas and charts in the comments section below! This is best way to keep it relevant, support me, keep the content here free and allow the idea to reach as many people as possible. **
-------------------------------------------------------------------------------
You may also TELL ME 🙋♀️🙋♂️ in the comments section which symbol you want me to analyze next and on which time-frame. The one with the most posts will be published tomorrow! 👏🎁
-------------------------------------------------------------------------------
💸💸💸💸💸💸
👇 👇 👇 👇 👇 👇

US30 (TP HIT)!!
Here we can see clearly how our analysis was perfectly executed today by the time of NFP releases,
Well done to whoever took this US30 SELL SETUP with us today,
HAPPY PIP HUNTING TRADERS.
FXKIllA

US30 (High Probability SELL Setup SOON)!!
Here we can see clearly the next move for US30 today, we've got a clear Bearish Symmetrical Triangle, which shows us a clear SELL Setup SOON,
We're using M15 TF for a clearer view of our analysis, hence we can't predict the duration of the setup execution,
We've got our EP (blue line) & our TP (golden line),
Keep a close eye on US30 today, especially with the release of U.S. NFP at 1:30 (GMT+00:00) London Time Zone,
HAPPY PIP HUNTING TRADERS.
FXKIllA.

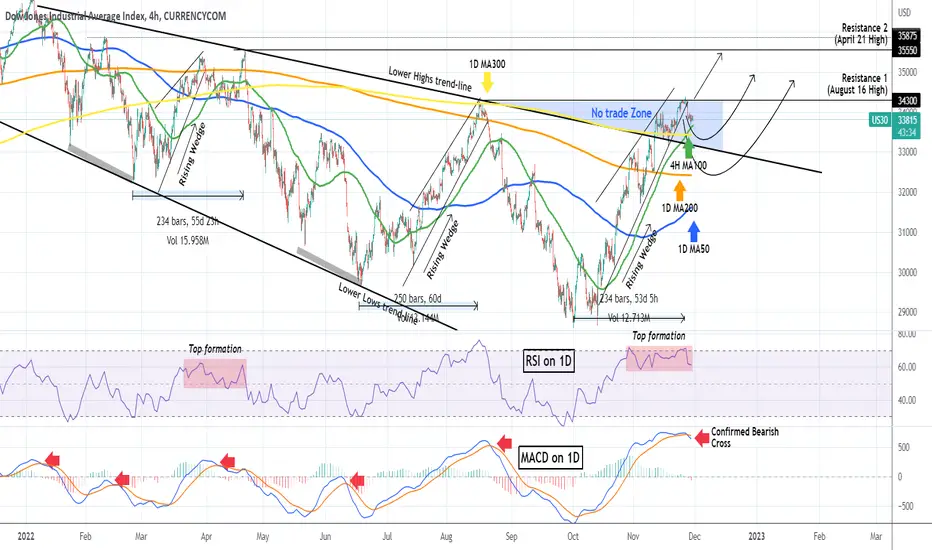
DOW JONES most likely topped at least short-termIt has been almost 6 weeks since Dow Jones (DJI) broke above the top (Lower Highs trend-line) of the Bearish Megaphone pattern that it has been trading in since the start of the year and the beginning of the 2022 correction. At the same time it broke above the 1D MA300 (yellow trend-line), which as we've mentioned numerous times was the barrier for a long-term bullish trend restoration:
As the price was basically rejected on the 34300 Resistance 1 (August 16 High), we can argue that the October - November rally has come to an end, with the price breaking below the Rising Wedge, while also the MACD on the 1D time-frame completed a Bearish Cross (red arrows). Unlike the previous counter trend rallies within the Bearish Megaphone, this time we may have the luxury to expect only a short-term pull-back, and not a new long-term selling sequence to a new market low.
As you see, we were correct for calling the area within the 34300 Resistance and the top (Lower Highs trend-line) of the former Bearish Megaphone, a 'No trade Zone'. A potential Support (and bounce point) can be that Lower Highs trend-line itself and if broken, the 1D MA50 (blue trend-line), which is traditionally the first Support during long-term uptrends. All this of course, assuming that the 4H MA100 (green trend-line), which is supporting now, breaks. If not, we can see one last attempt to break and close above Resistance 1 (34300) and target Resistance 2 (35550).
On a side note, see how the 1D RSI has been printing a Top formation similar to late March - early April. Also the November 25 top came exactly 234 days after the October 02 Low, which is symmetrical to February - April.
-------------------------------------------------------------------------------
** Please LIKE 👍, SUBSCRIBE ✅, SHARE 🙌 and COMMENT ✍ if you enjoy this idea! Also share your ideas and charts in the comments section below! This is best way to keep it relevant, support me, keep the content here free and allow the idea to reach as many people as possible. **
-------------------------------------------------------------------------------
You may also TELL ME 🙋♀️🙋♂️ in the comments section which symbol you want me to analyze next and on which time-frame. The one with the most posts will be published tomorrow! 👏🎁
-------------------------------------------------------------------------------
💸💸💸💸💸💸
👇 👇 👇 👇 👇 👇
US30 (High Probability BUY Setup SOON)!!!!
Here we can see clearly the next move for Dow30, By forming Inverse Head & Shoulder Reversal Pattern (W), Buying pressure from 33631 resulted in all the initial selloff being recaptured, An overnight negative theme in Equities has led to a lower open this morning, A break of bespoke support at 33650, & the move lower is already underway,
We're using M15 timeframe for a clearer view of our analysis, nothing more, therefore we can't predict exact timeframe our analysis going to happen,
We've got our EP (blue lines) & our TP (golden lines),
Keep a close eye on U.S. indices today as it's full of fundamental news, especially with Fed Chair Powell Speaks at 6:30 (GMT + 00:00 London),
HAPPY PIP HUNTING TRADERS.
FXKIllA.
US30, TP HIT!!!Here we can see clearly our previous analysis went exactly as we predicted & published on trading view, well done to whoever took the trade with us, happy pip hunting traders.

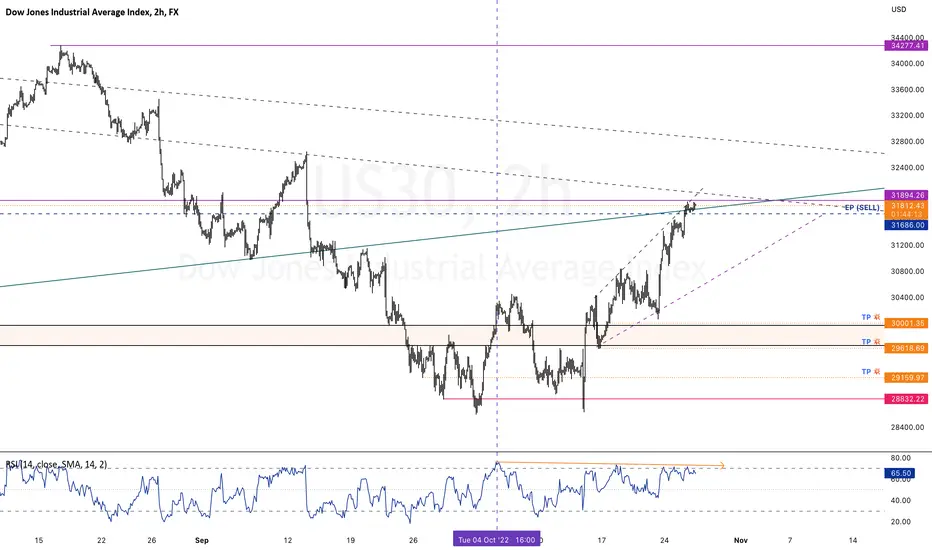
US30USD YM1! DOW 2022 NOV 28
US30USD YM1! DOW 2022 NOV 28
Scenario1 continuation long was in place from Nov 07's analysis.
Weakness are appearing on all timeframes. Tighten stops on
long positions. Volume was thin due to US holidays. Expected
to remain thin as year end approaches.
Possible scenarios:
1) Temporary short if 34246-33800 is rejected
2) Stay out of market since volume is thin
3) Continuation long if 34246-33800 is supported
Price reaction levels
Short on Test and Reject | Long on Test and Accept
35750 35330 34246-33800
33106 31793
30513 28635
Weekly: ND on uptrend = minor weakenss
Daily: Declining volume + narrow spreads = weakness
H4: Supply observed
Remember to like and follow if you find this useful.
Have a profitable week ahead.

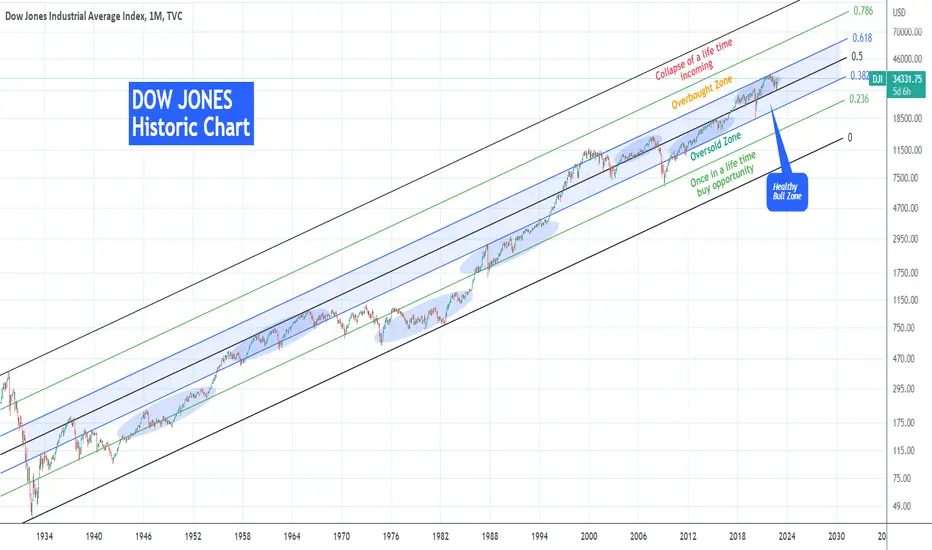
DOW JONES doing what it has always done through history. Rising.This is the Dow Jones Industrial Average Index (DJI) on the log scale since the great depression of the 1930s. A lot of talk is being done lately on whether or not this recent rally is sustainable, or if the high inflation can cause a deeper correction etc. In order to put things into perspective it is always useful to look into the longer term charts, preferably on a multi-year horizon.
This is on the 1M (monthly) time-frame where we've applied the Fibonacci Channel and its retracement levels on this 90 year price action. It is easy to realize that the Fibonacci levels have historically created zones of Support and Resistance. Right now, and despite the 2022 correction (Bear Market), Dow is within the 0.5 - 0.618 Fib, which is part of the larger 0.382 - 0.618 Fib Zone, which we call "Healthy Bull Zone" as when the index stays within it, it tends to rise on healthy growth levels.
To make things more interesting, Dow's early January top (All Time High) and subsequent rejection was made exactly on the 0.618 Fib. It shouldn't be a surprise that the recent October low and the subsequent rebound was made on the 0.5 Fib. This is a Support trend-line that 2017 only broke once during the 2020 COVID crash (which remarkably touched the 0.382 Fib and rebounded). In this 5 years Dow has been rising sustainably within this tight top half of the Healthy Bull Zone.
In fact, when the index trades within two levels tightly, it tends to do so for a very long time. Such periods are indicated by the blue ellipse patterns and besides the 2017 - 2022 one, we can see another 6 major periods.
As a result we can argue that right now Dow Jones is doing "what it always done through history" and that is rise sustainably within a tight Fibonacci zone long-term. This makes the index as bullish as it ever was.
Some added facts on this Channel. As you see we've categorized the zones based on the likely outcome they can provide. Next to the Healthy Bull Zone we see the Oversold (0.382 - 0.236 Fib) and Overbought (0.618 - 0.786 Fib) Zones, which is where the index presents a rare buy and sell opportunity respectively. In fact the 2008 Housing Crisis put us in an oversold position most recently and before that it was the 1987 Black Monday event. At the top of the Channel we have the 0.786 - 1.0 Fib 'Collapse Zone', where a mega collapse event is likely, and the index has only been there at the height of trading before the Great Depression. At the bottom of the Channel we have the 0.236 - 0.0 Fib 'Once in a life time buy opportunity Zone', which as you can imagine is the extremely oversold region where Dow has historically been the most attractive level to buy. The very bottom (March 2009) of the Housing Crisis marginally pierced through and before that (again marginally) the 1987 Black Monday.
** It is worth noting that from 1974 to 1986, the market traded almost entirely within this extremely oversold Fib zone. It was when the U.S. were ravaged by extremely high inflation levels (aftermath of the Vietnam war among others), with many sceptics today comparing the present day to that era.
-------------------------------------------------------------------------------
** Please LIKE 👍, SUBSCRIBE ✅, SHARE 🙌 and COMMENT ✍ if you enjoy this idea! Also share your ideas and charts in the comments section below! This is best way to keep it relevant, support me, keep the content here free and allow the idea to reach as many people as possible. **
-------------------------------------------------------------------------------
You may also TELL ME 🙋♀️🙋♂️ in the comments section which symbol you want me to analyze next and on which time-frame. The one with the most posts will be published tomorrow! 👏🎁
-------------------------------------------------------------------------------
👇 👇 👇 👇 👇 👇
💸💸💸💸💸💸
👇 👇 👇 👇 👇 👇
DOW JONES Holding the 1W MA50 could repeat the 2016/17 rally!This is the price action of the Dow Jones Industrial Average Index (DJI) since the 2008/09 Bear Cycle of the Housing Crisis. On the log 1W chart, we can fit it within a Channel Up pattern, with the January 2022 top as its latest Higher High. As you see there is considerable room to fall and touch the bottom (Higher Lows trend-line) of the Channel Up but on the Sep 26 - Oct 10 1W candles, the 1W MA200 (orange trend-line) acted as Support and pushed the price back above the 1W MA50 (blue trend-line).
It is important to mention that while the candle action was on Lower Lows, the 1W RSI was on Higher Lows, i.e. on a Bullish Divergence. The last time we had all this conditions fulfilled together, was during the August 2015 - February 2016 correction. As you see, the RSI was on Higher Lows while the price Double Bottomed, found Support on the 1W MA200 and rebounded back above the 1W MA50. The 1W MA50 then turned into a Support and never broke and that gave way to the very strong 2016/17 rally.
You can see that its bars pattern fractal (black) fits almost perfectly on the late 2021/2022 price action. As a result, we could expect a gradual recovery into a strong rally in Q3 2023, especially if the 1W MA50 holds as a Support. If not, the 2022 Channel Down (red) can give more Lower Lows until Dow hits the bottom of its 14 year old Channel Up.
-------------------------------------------------------------------------------
** Please LIKE 👍, SUBSCRIBE ✅, SHARE 🙌 and COMMENT ✍ if you enjoy this idea! Also share your ideas and charts in the comments section below! This is best way to keep it relevant, support me, keep the content here free and allow the idea to reach as many people as possible. **
-------------------------------------------------------------------------------
You may also TELL ME 🙋♀️🙋♂️ in the comments section which symbol you want me to analyze next and on which time-frame. The one with the most posts will be published tomorrow! 👏🎁
-------------------------------------------------------------------------------
👇 👇 👇 👇 👇 👇
💸💸💸💸💸💸
👇 👇 👇 👇 👇 👇

dow 4 hour : are you ready for sell ?wait pinbar come on 1hour or 4hour or daily candel then sell with sl on pinbar high
good luck

US30 (High Probability SELL Setup Soon)Here we can see clearly the next move for US30 today, with High Impact Fundamental News is due to be out today 2:00 pm (+00:00,BST), we can see High Probability of a Down move today,
Keep a close eye on US30
Happy pip hunting traders.

Dow Jones 30 Index: Trending higherCurrent price seems to continue to push above the mid-September highs with further short term (5-25 days) upside potential spotted near 33,785 ( 61.8% retracement from the 52 week low) long positions could be technically supported provided price hold above the 32,135 support, otherwise a break below support opens up the prospects for a test of 31,275 (38.2% retracement from the 4 week high)
Upcoming key economic events:
Wednesday November 02 2022 - United States Fed (FED) interest rate decision
Thursday November 03 2022 - Bank of England (BoE) and Norges Bank (Norway) interest rate decisions
Friday November 04 2022- United States monthly non-farm payrolls (NFP)
Not investment advice. Past performance is not indicative of future results.

US30 (High Probability SELL Setup Soon)Here we can see clearly the next move for US30,
* Prices have continued the bullish move higher & resulted in 3 consecutive positive days.
* This has resulted in signals for sentiment being at overbought extremes & we look for a move to the downside.
* A lower correction is expected.
* A break of 31690 bis needed to confirm follow through negative momentum.
* We got our EP (blue line) & our TP's (golden lines).
* Keep a close eye on US30 today,
* Happy pip hunting traders
big short is coming and nobody knowsI am very much concern about the credit suisse's debt problem.
I believed that market has bottoomed but it seems like another one more crash is waiting for us.
This bearish trend is indicating that lower volume.
Not many investors can created remarkable volume.
So stock isn't cheap yet.
