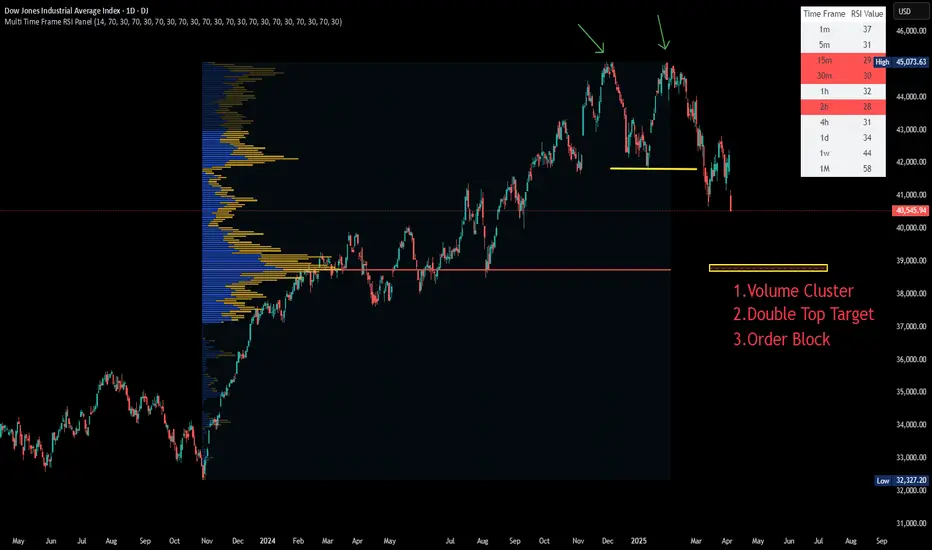
How to Identify Double Top Formation - A Long-Haul Bear?How to identify double top formation?
Is the US market still forming this double top formation, or has the pattern already completed, signaling a deeper correction to come?
In this discussion, we will focus on the latter question: whether this bear is going to be a long-haul bear.
3 parts of today tutorial:
1. How to Identify Double Top Formation is completed technically?
2. How to cross reference to its related markets?
3. How do the fundamental developments confirm these technical studies?
E-mini Dow Jones Index Futures & Options
Ticker: YM
Minimum fluctuation:
1.00 index point = $5.00
Micro E-mini Dow Jones Index Futures
Ticker: MYM
Minimum fluctuation:
1.0 index points = $0.50
Disclaimer:
• What presented here is not a recommendation, please consult your licensed broker.
• Our mission is to create lateral thinking skills for every investor and trader, knowing when to take a calculated risk with market uncertainty and a bolder risk when opportunity arises.
CME Real-time Market Data help identify trading set-ups in real-time and express my market views. If you have futures in your trading portfolio, you can check out on CME Group data plans available that suit your trading needs www.tradingview.com
Trading the Micro: www.cmegroup.com
Dowjones

Dow Jones | How far will it fall ?!All the strong supports have been broken and the stock market is bleeding! You can see one of the important supports ahead on the chart! 3 zones are stacked on top of each other! We are waiting for a reaction to this area.
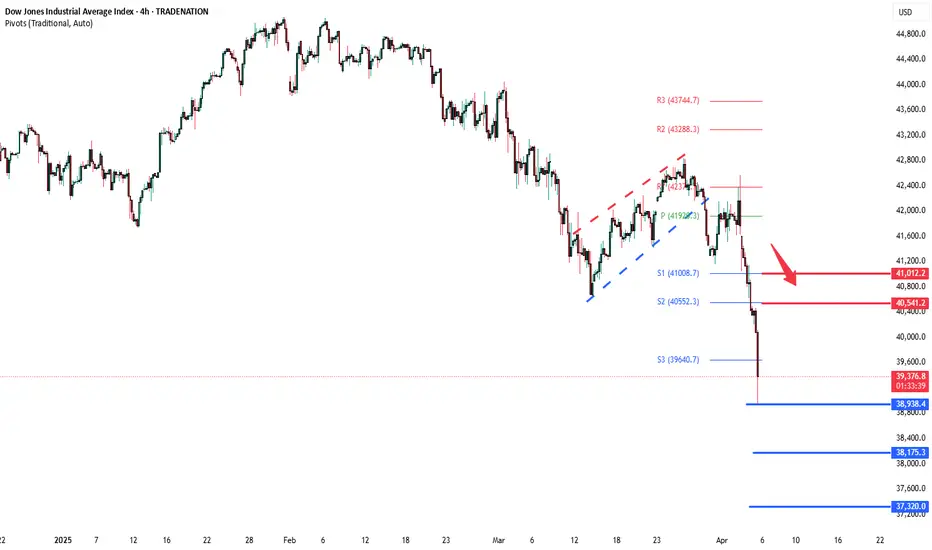
Dow Jones INTRADAY key trading levels ahead of US employmentKey Support and Resistance Levels
Resistance Level 1: 40540
Resistance Level 2: 41000
Resistance Level 3: 42000
Support Level 1: 38940
Support Level 2: 38175
Support Level 3: 37320
This communication is for informational purposes only and should not be viewed as any form of recommendation as to a particular course of action or as investment advice. It is not intended as an offer or solicitation for the purchase or sale of any financial instrument or as an official confirmation of any transaction. Opinions, estimates and assumptions expressed herein are made as of the date of this communication and are subject to change without notice. This communication has been prepared based upon information, including market prices, data and other information, believed to be reliable; however, Trade Nation does not warrant its completeness or accuracy. All market prices and market data contained in or attached to this communication are indicative and subject to change without notice.
No Signs of the Bull ArmyDow Jones Update : The correction appears likely to continue, testing the 40,045–40,467 range. Subsequently, the index is expected to rebound toward the 40,714–40,945.
Additionally, it is worth noting the gap in the 41,173–41,629 range—perhaps the market may find its way there.

DOW JONES INDEX (US30): Detailed Support & Resistance Analysis
Here is my latest structure analysis for US30 Index.
Resistance 1: 40650 - 40850 area
Resistance 2: 41150 - 41300 area
Resistance 3: 42550 - 42850 area
Support 1: 40000 - 40250 area
Support 2: 39470 - 39650 area
Support 3: 38400 - 38650 area
Consider these structures for pullback/breakout trading.
❤️Please, support my work with like, thank you!❤️
I am part of Trade Nation's Influencer program and receive a monthly fee for using their TradingView charts in my analysis.

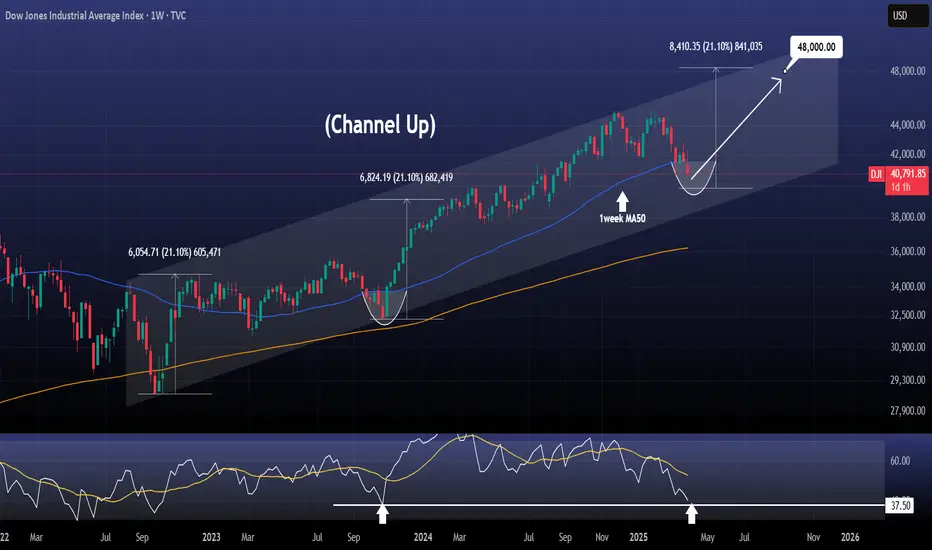
DOW JONES You will regret not taking this buyDow Jones / US30 remains under heavy selling pressure as it has been yet again rejected under the 1week MA50, failing to hold the closings over it of the past 3 candles.
This is the strongest correction of the index since the September 26th 2022 bottom and the start of the Channel Up.
Despite the negatives, the 1week RSI is almost on the 37.50 level, which is where the last higher low of the Channel Up was formed on October 23rd 2023, again under the 1week MA50.
Obviously even though the downside may continue for a few more days, the extent is limited technically, especially since the worst of the tariffs have been priced and only new and more aggressive ones can inflict more non-technical fear on the market.
This is a unique long term buy opportunity, the likes of which saw 2 rallies before of +21.10%.
Even in the event of one more dip, a 48000 target towards the end of the year is very realistic.
Follow us, like the idea and leave a comment below!!
Dow Jones INTRADAY bearish below 42375Key Support and Resistance Levels
Resistance Level 1: 42375
Resistance Level 2: 42846
Resistance Level 3: 43288
Support Level 1: 40560
Support Level 2: 40000
Support Level 3: 39637
This communication is for informational purposes only and should not be viewed as any form of recommendation as to a particular course of action or as investment advice. It is not intended as an offer or solicitation for the purchase or sale of any financial instrument or as an official confirmation of any transaction. Opinions, estimates and assumptions expressed herein are made as of the date of this communication and are subject to change without notice. This communication has been prepared based upon information, including market prices, data and other information, believed to be reliable; however, Trade Nation does not warrant its completeness or accuracy. All market prices and market data contained in or attached to this communication are indicative and subject to change without notice.

DOW JONES One break away from a rally back to 45000.Dow Jones (DJIA) got stopped on the 4H MA50 (blue trend-line) as the market paused ahead of today's tariffs implementation. This is the 2nd technical rejection since the March 13 bottom, the first being n the 4H MA200 (orange trend-line) last Wednesday.
This bottom is technically the start of the new Bullish Leg of the 1-year Bullish Megaphone pattern, and is very similar, both in 1D RSI and price terms, to the first one (April 19 - May 20 2024). As you can see, we are currently within the sane 0.5 - 0.786 Fib range, where the price consolidated before the eventual 4H MA200 bullish break-out.
If it continues to replicate the 2024 Bullish Leg, then be ready for a straight Resistance test once the 4H MA200 breaks. Our Target is 45000.
-------------------------------------------------------------------------------
** Please LIKE 👍, FOLLOW ✅, SHARE 🙌 and COMMENT ✍ if you enjoy this idea! Also share your ideas and charts in the comments section below! This is best way to keep it relevant, support us, keep the content here free and allow the idea to reach as many people as possible. **
-------------------------------------------------------------------------------
💸💸💸💸💸💸
👇 👇 👇 👇 👇 👇

Dow Jones US30: Spotting a Potential Pullback Opportunity!📉 The Dow Jones US 30 is currently in a dominant bearish trend on the higher timeframes, but 📈 the 1-hour chart reveals a shift in structure with bullish momentum emerging. This could signal a potential short-term retracement back into the previous range, aligning with the 50% Fibonacci retracement zone. 🔄 There’s also a bearish imbalance overhead that may attract price action for rebalancing. While this setup offers a possible buying opportunity, ⚠️ it carries significant risk given the prevailing bearish sentiment. Stay sharp and manage your risk! 🛡️
Disclaimer
⚠️ This is not financial advice. Trading involves substantial risk, and you should only trade with capital you can afford to lose. Always conduct your own analysis or consult a professional before making decisions. 💡

DOW JONES: 4 week bottom on the 1W MA50. Best time to buy.Dow Jones turned neutral again on its 1D technical outlook (RSI = 46.611, MACD = -297.980, ADX = 37.851) as it is recovering today and more importantly keeps its price action above the 1W MA50. This is the 4th straight week that it trades and holds the 1W MA50, which is shaping up to be the natural long term support. That is keeping the 1W RSI neutral (47.224), which technically suggets that it is the most low risk level to buy. The 1W RSI made a double bottom due to this consolidation and the 1W MACD printed the first light red bar, all of which are similar to the October 23rd 2023 bottom.
Both have been bottoms after bearish waves of the 1.5 year Channel Up and as a matter of fact similar in decline rate (-9.50%). The highest probability level for a rebound and start of the new bullish wave is this, and based on the previous, it should aim for the 2.0 Fibonacci extension (TP = 49,000).
## If you like our free content follow our profile to get more daily ideas. ##
## Comments and likes are greatly appreciated. ##

Dow Jones INTRADAY capped by 42375Resistance Level 1: 42375
Resistance Level 2: 42846
Resistance Level 3: 43288
Support Level 1: 41279
Support Level 2: 41000
Support Level 3: 40562
This communication is for informational purposes only and should not be viewed as any form of recommendation as to a particular course of action or as investment advice. It is not intended as an offer or solicitation for the purchase or sale of any financial instrument or as an official confirmation of any transaction. Opinions, estimates and assumptions expressed herein are made as of the date of this communication and are subject to change without notice. This communication has been prepared based upon information, including market prices, data and other information, believed to be reliable; however, Trade Nation does not warrant its completeness or accuracy. All market prices and market data contained in or attached to this communication are indicative and subject to change without notice.

US30 Dow Jones Trade Idea📉 The US30 (Dow Jones) is currently overextended! In this video, we analyze the price action 🔍 and go over my trading plan for a potential short 📊—if the setup plays out as discussed. 🚨 Not financial advice! 🚫e.

US30 bullish LongWall Street goes full bull with tariffs and payrolls looming
I buy the correction
Price closed at low on Friday,for me:Time to buy the correction
Also non farm payrolls looming coming this Friday.
I dont use price action,because it is worthless to use past gone data,on future movements.
Instead I use my favourite commercial analysis
Big commercials buying US30, hedgefunds taking profit and selling it.It means its time to BUY!!!

Weekly Market Forecast: SELL THE INDICES!In this video, we will analyze the S&P 500, NASDAQ, AND DOW JONES Futures for the week of March 31st - April 4th.
The equity markets took a bearish turn last week. This is likely to continue for the upcoming week.
Monday is the end of March. Tuesday brings a new week and new opportunities. April 2nd brings... potentially market flipping volatility. The day the Trump tariffs are implemented.
Be careful. Let the market give you direction, and then get involved.
Enjoy!
May profits be upon you.
Leave any questions or comments in the comment section.
I appreciate any feedback from my viewers!
Like and/or subscribe if you want more accurate analysis.
Thank you so much!
Disclaimer:
I do not provide personal investment advice and I am not a qualified licensed investment advisor.
All information found here, including any ideas, opinions, views, predictions, forecasts, commentaries, suggestions, expressed or implied herein, are for informational, entertainment or educational purposes only and should not be construed as personal investment advice. While the information provided is believed to be accurate, it may include errors or inaccuracies.
I will not and cannot be held liable for any actions you take as a result of anything you read here.
Conduct your own due diligence, or consult a licensed financial advisor or broker before making any and all investment decisions. Any investments, trades, speculations, or decisions made on the basis of any information found on this channel, expressed or implied herein, are committed at your own risk, financial or otherwise.

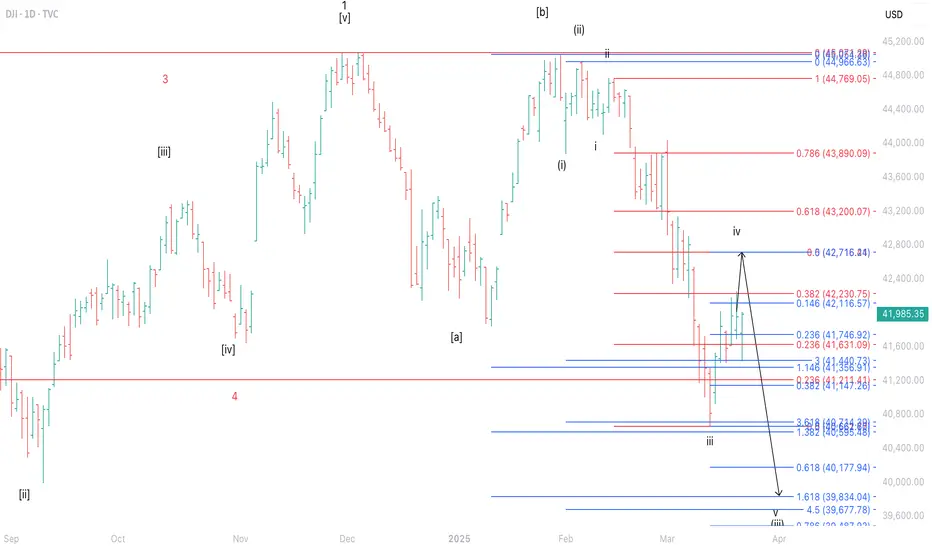
“DJIA Rally Continues, but Caution Is Advised for the Next Move”The current strengthening of the DJIA is estimated to be part of wave iv of wave (iii). Pay close attention to the potential short-term upside, as the index may retest the 42,230–42,716 area.
The possibility of the upward correction ending and the decline Considering the zone marked on the chart and considering that the price has seen a lower low, it seems that the upward correction in the price will end soon and we should wait for a new downward movement. Targets and stop loss of my position are marked on the chart.

Gold vs DowThis could be the breakout we tell our kids about someday.
Room to run IF this breaks above that yellow diagonal line (basically anything sustained above 0.08).

Dow heading below $40k?Based on two important measured moves -- the double top AND the bear flag -- they both point to below $39k. If so, then I would not be surprised to see the 382 Fibonacci level around 36K-37k get tagged.

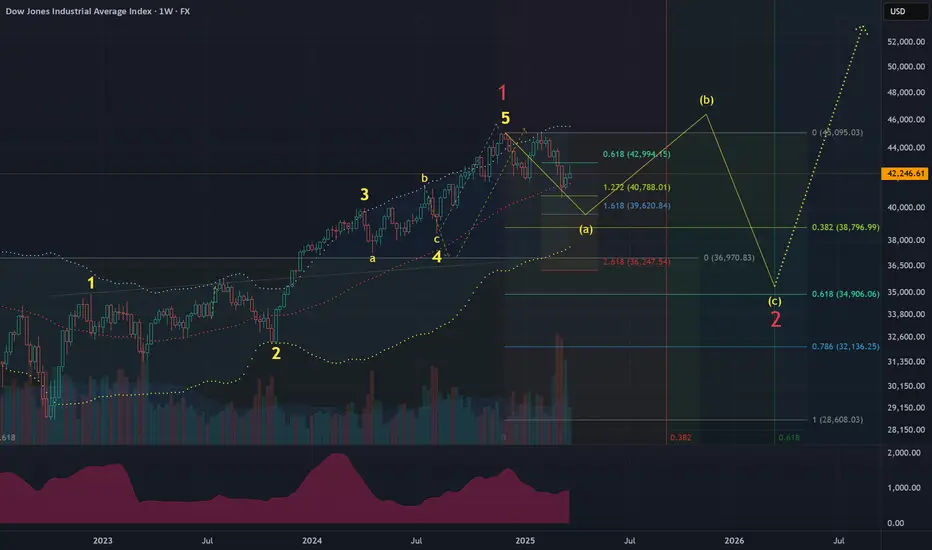
DJI US stock market forecast 2025-2026Assumption:
oct-22 — nov-24 (1-2-3-4-5) wave is over.
correction (a)-(b)-(c) is expected.
likely structure is a 3 wave regular flat.
Time:
the correction is expected to last until at least sep-25.
Price:
it's too early to predict final price for wave (c).
anticipated range is 35000-39000.
wave (a) shall reach 39600.
Long term waves:
Major uptrend lasts 25 years.
Major correcting downtrend lasts 9 years.
Next major downtrend is expected to start in 2033-2034.
DOW JONES: Are you ready for what's coming?Dow Jones is neutral on its 1D technical outlook (RSI = 48.157, MACD = -244.290, ADX = 38.724) as it is attempting to recover the 2 month correction. It appears that the bottom has already been made as not only did the price rebound on the LL trendline but it did so on an oversold 1D RSI. This draws comparisons to the last big such correction of Aug-Oct 2023, which also declined by more than -9.40%. They key there was the formation of a 4H Golden Cross.
Right now the price is stuck inside the 4H MA50 - 4H MA200 range, so if it crosses now over the 4H MA200, it will most likely confirm the start of the new bullish wave as it will form a 4H Golden Cross. Technically it can achieve a similar price rally as then, so our thesis remains bullish aiming at the 2.0 Fibonacci extension (TP = 50,000).
## If you like our free content follow our profile to get more daily ideas. ##
## Comments and likes are greatly appreciated. ##

DowJones INTRADAY muted reaction to US Economic DataMarket Impact Dow Jones: The better-than-expected GDP and healthy labor market data suggest economic momentum remains intact, supporting corporate earnings and risk appetite. However, persistent strength may delay Fed rate cuts, potentially leading to market volatility.
Key Support and Resistance Levels
Resistance Level 1: 42850
Resistance Level 2: 43162
Resistance Level 3: 43433
Support Level 1: 41830
Support Level 2: 41400
Support Level 3: 40800
This communication is for informational purposes only and should not be viewed as any form of recommendation as to a particular course of action or as investment advice. It is not intended as an offer or solicitation for the purchase or sale of any financial instrument or as an official confirmation of any transaction. Opinions, estimates and assumptions expressed herein are made as of the date of this communication and are subject to change without notice. This communication has been prepared based upon information, including market prices, data and other information, believed to be reliable; however, Trade Nation does not warrant its completeness or accuracy. All market prices and market data contained in or attached to this communication are indicative and subject to change without notice.

BITCOIN - The Bearish Scenario - Sign's of a Possible Top...In this video, I explore the possibility that Bitcoin may have already hit a temporary peak.
My perspective comes from initially building a bullish case—only to uncover subtle flaws that I chose to set aside.
But as I meticulously documented my observations, those cracks in the bullish argument became impossible to ignore. When I switched to a bearish wave count, some thing began to align, shedding light on areas of the chart that previously seemed uncertain.
These market waves are intricate, requiring patience and a fresh perspective to decipher where we truly stand in the broader pattern.
Only after stepping back and allowing time for meaningful price action does the picture start to come into focus.
I also touch on Ethereum's pattern and the Dow Jones.

DOW JONES Last chance to buy before it breaks the 1D MA50.Dow Jones (DJIA) has been trading within a 1.5 year Channel Up pattern since the July 2023 High. The market found itself under heavy pressure recently as the Channel unfolded its Bearish Leg which found Support right below the 1D MA200 (orange trend-line).
As the 1D RSI got oversold (<30.00) and rebounded, this is perhaps the last opportunity to buy low, before it breaks above its 1D MA50 (blue trend-line) on what is technically the new Bullish Leg.
The previous Bullish Leg (November 2023 - March 2024) hit the 2.0 Fibonacci extension on a +23.94% rise, before it broke below its 1D MA50 again. As a result, it is possible for Dow not to break again below its 1D MA50 once broken, before it reaches the 2.0 Fib which sits at 50000. Our Target is a little lower than that at 49000.
-------------------------------------------------------------------------------
** Please LIKE 👍, FOLLOW ✅, SHARE 🙌 and COMMENT ✍ if you enjoy this idea! Also share your ideas and charts in the comments section below! This is best way to keep it relevant, support us, keep the content here free and allow the idea to reach as many people as possible. **
-------------------------------------------------------------------------------
Disclosure: I am part of Trade Nation's Influencer program and receive a monthly fee for using their TradingView charts in my analysis.
💸💸💸💸💸💸
👇 👇 👇 👇 👇 👇
