Dow INTRADAY coiling energy buildup The Dow (US30) index price action sentiment appears bullish, supported by the longer-term prevailing uptrend. However, since reaching an all-time high on 04th December 2024 the Dow index price action is consolidating in a sideways trading range.
The key trading level is at 44460, the current swing low. A corrective pullback from the current levels and a bullish bounce back from the 44460 level could target the upside resistance at 44835 followed by the 45060 and 45140 levels over the longer timeframe.
Alternatively, a confirmed loss of 44460 support and a daily close below that level would negate the bullish outlook opening the way for a further retracement and a retest of 44265 support level followed by 44160 and 43980.
This communication is for informational purposes only and should not be viewed as any form of recommendation as to a particular course of action or as investment advice. It is not intended as an offer or solicitation for the purchase or sale of any financial instrument or as an official confirmation of any transaction. Opinions, estimates and assumptions expressed herein are made as of the date of this communication and are subject to change without notice. This communication has been prepared based upon information, including market prices, data and other information, believed to be reliable; however, Trade Nation does not warrant its completeness or accuracy. All market prices and market data contained in or attached to this communication are indicative and subject to change without notice.
Dowjones

US Presidents' Day holiday, US markets closedMonday, February 17
Data: Japan December capacity utilisation, Tertiary industry index, Italy December trade balance, Eurozone December trade balance, Canada January housing starts, December international securities transactions
Central banks: Fed's Harker, Bowman and Waller speak, ECB's Nagel speaks
Earnings: BHP Group
Other: US Presidents' Day holiday, markets closed
This communication is for informational purposes only and should not be viewed as any form of recommendation as to a particular course of action or as investment advice. It is not intended as an offer or solicitation for the purchase or sale of any financial instrument or as an official confirmation of any transaction. Opinions, estimates and assumptions expressed herein are made as of the date of this communication and are subject to change without notice. This communication has been prepared based upon information, including market prices, data and other information, believed to be reliable; however, Trade Nation does not warrant its completeness or accuracy. All market prices and market data contained in or attached to this communication are indicative and subject to change without notice.

150% minimum gain on dow jones30 150 percent gain until 2027 is the long perspective for dow jones but you have to buy every down and dip for this long run

DOW JONES INDEX (US30): Intraday Bullish Continuation
Dow Jones Index violated a resistance line of a narrow
consolidation range on a 4H time frame.
Probabilities are high that the market will continue growing.
Next resistance - 44820
❤️Please, support my work with like, thank you!❤️

US30 Bullish Breakout!
HI,Traders !
US30 broke the key
Horizontal level of 44600.0
And the breakout is confirmed
So after a local correction
We will be expecting a further
Bullish move up!
Comment and subscribe to help us grow !

DOW JONES is completing a Bull Flag to jump to 46700.Dow Jones / US30 is posting a Bull Flag pattern on the 4hour timeframe, currently between the 4hour MA50 and MA200.
The last time we came across this pattern was with the early September Bull Flag.
Both patterns started after a +8.20% rise on the index.
If the new one repeats September's, then we should see an immediate rally to the 1.5 Fibonacci.
Buy and target 46700.
Follow us, like the idea and leave a comment below!!

Dow (US30) coiling price action after increase in US PPI dataThe Dow (US30) index price action sentiment appears bullish, supported by the longer-term prevailing uptrend. However, since reaching an all-time high on 04th December 2024 the Dow index price action is consolidating in a sideways trading range. Today, Thursday 13th February 2025 the US (PPI) Producer Price Index data was published showing the increase to 3.5% on a yearly basis in January. The annual core PPI rose to 3.6% in the same period, surpassing market forecasts of 3.3%. On a monthly basis, the PPI and the core PPI rose 0.4% and 0.3%, respectively.
The key trading level is at 44206, the current swing low. A corrective pullback from the current levels and a bullish bounce back from the 44206 level could target the upside resistance at 44980 followed by the 45080 and 45200 levels over the longer timeframe.
Alternatively, a confirmed loss of 44206 support and a daily close below that level would negate the bullish outlook opening the way for a further retracement and a retest of 44000 support level followed by 43740.
This communication is for informational purposes only and should not be viewed as any form of recommendation as to a particular course of action or as investment advice. It is not intended as an offer or solicitation for the purchase or sale of any financial instrument or as an official confirmation of any transaction. Opinions, estimates and assumptions expressed herein are made as of the date of this communication and are subject to change without notice. This communication has been prepared based upon information, including market prices, data and other information, believed to be reliable; however, Trade Nation does not warrant its completeness or accuracy. All market prices and market data contained in or attached to this communication are indicative and subject to change without notice.

Dow awaits US inflation reportThe Dow (US30) index price action sentiment appears bullish, supported by the longer-term prevailing uptrend. However, since reaching an all-time high on 04th December 2024 the Dow index price action is consolidating in a sideways trading range.
The key trading level is at 44206, which is the current swing low. A corrective pullback from the current levels and a bullish bounce back from the 44206 level could target the upside resistance at 44980 followed by the 44080 and 44200 levels over the longer timeframe.
Alternatively, a confirmed loss of 44206 support and a daily close below that level would negate the bullish outlook opening the way for a further retracement and a retest of 44000 support level followed by 43740.
This communication is for informational purposes only and should not be viewed as any form of recommendation as to a particular course of action or as investment advice. It is not intended as an offer or solicitation for the purchase or sale of any financial instrument or as an official confirmation of any transaction. Opinions, estimates and assumptions expressed herein are made as of the date of this communication and are subject to change without notice. This communication has been prepared based upon information, including market prices, data and other information, believed to be reliable; however, Trade Nation does not warrant its completeness or accuracy. All market prices and market data contained in or attached to this communication are indicative and subject to change without notice.

DOW JONES One last drop below the 1D MA50 is possibleDow Jones (DJIA) has found itself in an uncomfortable spot as it's been trading sideways within the 1D MA50 (blue trend-line) and Resistance 1 of the December 2024 High, for the past two weeks.
The 1D RSI has already started trending downwards on a Bearish Divergence while the 1D MACD just completed a Bearish Cross. The times we've seen all those conditions fulfilled within the 2-year Channel Up, are in mid-May 2024 and early May 2023.
On both occasions, the price got rejected on Resistance 1 and pulled back below the 1D MA50 to form a Higher Low. After the 1D MACD formed a Bullish Cross, the price confirmed a technical reversal and targeted the 1.5 Fibonacci extension before the next pull-back.
As a result, you might want to keep a buy order waiting for a sub-MA50 drop and buy once a MACD Bullish Cross is formed to target 46500 (Fib 1.5 ext).
-------------------------------------------------------------------------------
** Please LIKE 👍, FOLLOW ✅, SHARE 🙌 and COMMENT ✍ if you enjoy this idea! Also share your ideas and charts in the comments section below! This is best way to keep it relevant, support us, keep the content here free and allow the idea to reach as many people as possible. **
-------------------------------------------------------------------------------
💸💸💸💸💸💸
👇 👇 👇 👇 👇 👇

US30 Bullish Breakout!
HI,Traders !
US30 was trading in a
Narrowing wedge pattern
But now we are seeing a
Bullish breakout so we
Will be expecting a
Further bullish move up!
Comment and subscribe to help us grow !

BABA, Short, 4h✅ BABA is overbought and has rejected the key resistance at 115.45. A bearish move is expected as the price shows signs of weakness.
SHORT 🔥
✅ Like and subscribe to never miss a new analysis! ✅

DOW JONES: Necessary correction to lated target 46,600.Dow Jones is neutral on its 1D technical outlook (RSI = 53.301, MACD = 170.540, ADX = 30.319) as it is trading sideways on top of the 1D MA50 for the past 2 weeks. The long term pattern is a Channel Up that every time it rebounded on a HL bottom and hit the R1, it always pulled back again to test the 1D MA50. Consequently, this is a necessary technical correction that will allow the index to attract enough buying momentum again to go after a new HH. Aim for a minimum +8.41% increase (TP = 46,600).
## If you like our free content follow our profile to get more daily ideas. ##
## Comments and likes are greatly appreciated. ##

US30 Bearish Bias!
HI,Traders !
US30 made a bearish
Breakout of the key
Horizontal level of 44620.76
Which is now a resistance
And we will be expecting
A further move down After
retesting broken level !
Comment and subscribe to help us grow !

Weekly Market Forecast: S&P, NAS & DOW Are Still Bullish!This forecast is for the week of Feb 10-14th.
The S&P500, the NASDAQ, and the DOW JONES are still bullish overall, despite last weeks NFP news that saw the markets move lower. Until there is a bearish break in market structure, it is buys all the way. Let the markets reach the buy zones and wait for the bullish market structure shift. That is the time to take valid buy setups.
Enjoy!
May profits be upon you.
Leave any questions or comments in the comment section.
I appreciate any feedback from my viewers!
Like and/or subscribe if you want more accurate analysis.
Thank you so much!
Disclaimer:
I do not provide personal investment advice and I am not a qualified licensed investment advisor.
All information found here, including any ideas, opinions, views, predictions, forecasts, commentaries, suggestions, expressed or implied herein, are for informational, entertainment or educational purposes only and should not be construed as personal investment advice. While the information provided is believed to be accurate, it may include errors or inaccuracies.
I will not and cannot be held liable for any actions you take as a result of anything you read here.
Conduct your own due diligence, or consult a licensed financial advisor or broker before making any and all investment decisions. Any investments, trades, speculations, or decisions made on the basis of any information found on this channel, expressed or implied herein, are committed at your own risk, financial or otherwise.

Dow Jones Potential UpsidesHey Traders, in today's trading session we are monitoring US30 for a buying opportunity around 44500 zone, US30 is trading in an uptrend and currently is in a correction phase in which it is approaching the trend at 44500 support and resistance area.
Trade safe, Joe.

It's over for DOW JONES?#dowjones #DJI index has been forming a bearish double top and the first hard declination from this levels will probably confirm the trend reversal of DJ:DJI .Take care.

US30 H4 I Bearish Drop Based on the H4 chart, the price is testing our sell entry level at 44,728.54, a pullback resistance. This level is expected to act as a potential reversal point in the bearish setup.
A successful rejection at this resistance could drive prices lower toward our take profit at 44,029.64, where buyers may step in near a previous support level.
The stop loss is placed at 45,433.97, just above the 127.2% Fibonacci extension, allowing room for price fluctuations while ensuring the bearish outlook remains valid.
High Risk Investment Warning
Trading Forex/CFDs on margin carries a high level of risk and may not be suitable for all investors. Leverage can work against you.
Stratos Markets Limited (fxcm.com/uk):
CFDs are complex instruments and come with a high risk of losing money rapidly due to leverage. 63% of retail investor accounts lose money when trading CFDs with this provider. You should consider whether you understand how CFDs work and whether you can afford to take the high risk of losing your money.
Stratos Europe Ltd (fxcm.com/eu):
CFDs are complex instruments and come with a high risk of losing money rapidly due to leverage. 63% of retail investor accounts lose money when trading CFDs with this provider. You should consider whether you understand how CFDs work and whether you can afford to take the high risk of losing your money.
Stratos Trading Pty. Limited (fxcm.com/au):
Trading FX/CFDs carries significant risks. FXCM AU (AFSL 309763), please read the Financial Services Guide, Product Disclosure Statement, Target Market Determination and Terms of Business at fxcm.com/au
Stratos Global LLC (fxcm.com/markets):
Losses can exceed deposits.
Please be advised that the information presented on TradingView is provided to FXCM (‘Company’, ‘we’) by a third-party provider (‘TFA Global Pte Ltd’). Please be reminded that you are solely responsible for the trading decisions on your account. There is a very high degree of risk involved in trading. Any information and/or content is intended entirely for research, educational and informational purposes only and does not constitute investment or consultation advice or investment strategy. The information is not tailored to the investment needs of any specific person and therefore does not involve a consideration of any of the investment objectives, financial situation or needs of any viewer that may receive it. Kindly also note that past performance is not a reliable indicator of future results. Actual results may differ materially from those anticipated in forward-looking or past performance statements. We assume no liability as to the accuracy or completeness of any of the information and/or content provided herein and the Company cannot be held responsible for any omission, mistake nor for any loss or damage including without limitation to any loss of profit which may arise from reliance on any information supplied by TFA Global Pte Ltd.
The speaker(s) is neither an employee, agent nor representative of FXCM and is therefore acting independently. The opinions given are their own, constitute general market commentary, and do not constitute the opinion or advice of FXCM or any form of personal or investment advice. FXCM neither endorses nor guarantees offerings of third-party speakers, nor is FXCM responsible for the content, veracity or opinions of third-party speakers, presenters or participants.

The Friday Forecast; Best Setups Frr Feb 7This market outlook will cover 15 markets:
ES \ S&P 500
NQ | NASDAQ 100
YM | Dow Jones 30
GC |Gold
SiI | Silver
PL | Platinum
HG | Copper
USD Index
EURUSD
GBPUSD
AUDUSD
NZDUSD
CAD, USDCAD
CHF, USDCHF
JPY, USDJPY
Non Farm Payroll news tomorrow! This is likely to inject a lot of volatility into the markets.
I recommend to wait until after the news is announced before executing on any trades. You never know where the market will go!
Enjoy!
May profits be upon you.
Leave any questions or comments in the comment section.
I appreciate any feedback from my viewers!
Like and/or subscribe if you want more accurate analysis.
Thank you so much!
Disclaimer:
I do not provide personal investment advice and I am not a qualified licensed investment advisor.
All information found here, including any ideas, opinions, views, predictions, forecasts, commentaries, suggestions, expressed or implied herein, are for informational, entertainment or educational purposes only and should not be construed as personal investment advice. While the information provided is believed to be accurate, it may include errors or inaccuracies.
I will not and cannot be held liable for any actions you take as a result of anything you read here.
Conduct your own due diligence, or consult a licensed financial advisor or broker before making any and all investment decisions. Any investments, trades, speculations, or decisions made on the basis of any information found on this channel, expressed or implied herein, are committed at your own risk, financial or otherwise.

NFP Feb 25 - US30 NFP Trading Plan Feb 2025.
Weaker NFP data with higher UNEMPLOYMENT CLAIMS (Bullish)
Higher NFP data with Lower UNEMPLOYMENT CLAIMS (Bearish)
Weaker NFP data with Neutral UNEMPLOYMENT CLAIMS (Choppy)
NFP - Forecast 169K vs Previous 256K
Unemployment Claims - Forecast 4.1% vs Previous 4.1%
Here's the tricky Part. If data comes out as expected (NFP 169K - UEC 4.1%) thats Bullish, but a choppy market up & down until market finds a valid support/trend.
Plan Of Action.
Wait 5 - 15 min after data release.
Identify the S&R zones. Wait for Break or Retest.
Wait for confirmation (Candle close/Volume Break/Retest).
Execute with Proper Risk Management.
STICK TO PLAN OF ACTION!!!
Support & Resistence
Resistence - 44725 - 44750
Support - 44525 -44500
Technicals
Monitor DXY for a weaker Dollar. Currently on the 4hr DXY chart we got a H&S Pattern with MA20 downside cross MA50 and RSI in sell area below 50.
US30 we inverted H&S Pattern with MA20 trading close to MA50 for upside cross and RSI in Buy area above 50.

US30hello everyone, the price reversed from previous support level, the price is still trading in straight pattern, today after ism news price stayed strong.. price may continue bullish and reach or break the main resistance level and make all time high price

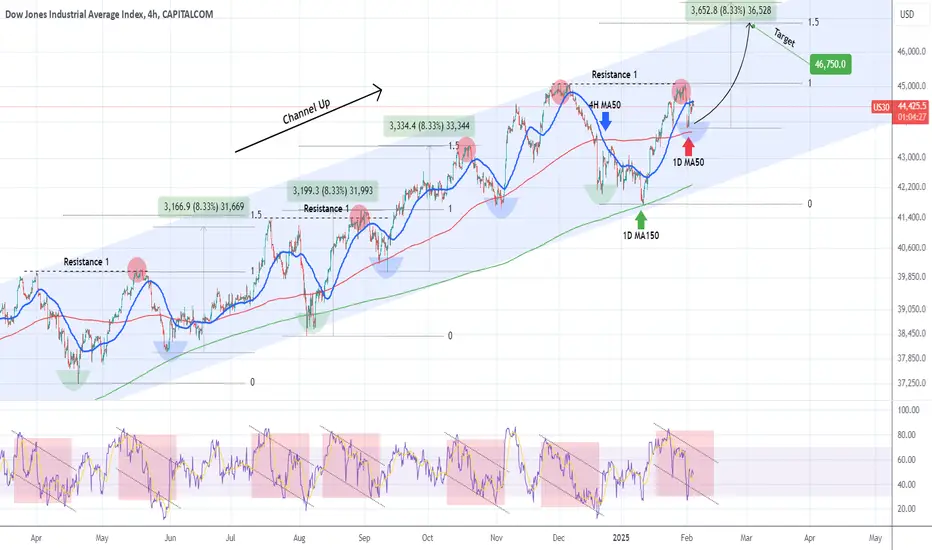
DOW JONES Can the 1D MA50 save the day once more?Dow Jones (DJIA) has been trading within a year long Channel Up and this week's pull-back has so far found Support just above the 1D MA50 (red trend-line). As this chart shows, every 1D MA50 contact that was made after a Channel Up bottom (Higher Low), was a buy opportunity as the blue arc patterns highlight.
The green arcs are the Channel bottoms and technically the strongest buy opportunities and in the past 10 months we've only had 3 of those. This is the 4th blue arc however, the medium-term buy opportunity.
Regardless of colour, the 4H RSI pattern on each of those buy opportunities, has been the same. And the resulting rally has either hit the 1.5 Fibonacci extension or made a +8.33% rise.
This time the 1.5 Fib is a bit closer to the price, so that will be our medium-term Target at 46750.
-------------------------------------------------------------------------------
** Please LIKE 👍, FOLLOW ✅, SHARE 🙌 and COMMENT ✍ if you enjoy this idea! Also share your ideas and charts in the comments section below! This is best way to keep it relevant, support us, keep the content here free and allow the idea to reach as many people as possible. **
-------------------------------------------------------------------------------
💸💸💸💸💸💸
👇 👇 👇 👇 👇 👇
US30 H1 I Bearish Drop Based on the H1 chart, the price is approaching our sell entry level at 44,589.66, which aligns with a strong resistance level and the 61.8% Fibonacci retracement. This level is expected to act as a potential reversal point in the bearish setup.
Our take profit is set at 44,078.74, near a previous support level, where price may find buying interest.
The stop loss is placed at 44,913.22, above the previous swing high and above the 78.6% Fibonacci retracement, providing room for price fluctuations while ensuring the bearish setup remains valid.
High Risk Investment Warning
Trading Forex/CFDs on margin carries a high level of risk and may not be suitable for all investors. Leverage can work against you.
Stratos Markets Limited (fxcm.com/uk):
CFDs are complex instruments and come with a high risk of losing money rapidly due to leverage. 63% of retail investor accounts lose money when trading CFDs with this provider. You should consider whether you understand how CFDs work and whether you can afford to take the high risk of losing your money.
Stratos Europe Ltd (fxcm.com/eu):
CFDs are complex instruments and come with a high risk of losing money rapidly due to leverage. 63% of retail investor accounts lose money when trading CFDs with this provider. You should consider whether you understand how CFDs work and whether you can afford to take the high risk of losing your money.
Stratos Trading Pty. Limited (fxcm.com/au):
Trading FX/CFDs carries significant risks. FXCM AU (AFSL 309763), please read the Financial Services Guide, Product Disclosure Statement, Target Market Determination and Terms of Business at fxcm.com/au
Stratos Global LLC (fxcm.com/markets):
Losses can exceed deposits.
Please be advised that the information presented on TradingView is provided to FXCM (‘Company’, ‘we’) by a third-party provider (‘TFA Global Pte Ltd’). Please be reminded that you are solely responsible for the trading decisions on your account. There is a very high degree of risk involved in trading. Any information and/or content is intended entirely for research, educational and informational purposes only and does not constitute investment or consultation advice or investment strategy. The information is not tailored to the investment needs of any specific person and therefore does not involve a consideration of any of the investment objectives, financial situation or needs of any viewer that may receive it. Kindly also note that past performance is not a reliable indicator of future results. Actual results may differ materially from those anticipated in forward-looking or past performance statements. We assume no liability as to the accuracy or completeness of any of the information and/or content provided herein and the Company cannot be held responsible for any omission, mistake nor for any loss or damage including without limitation to any loss of profit which may arise from reliance on any information supplied by TFA Global Pte Ltd.
The speaker(s) is neither an employee, agent nor representative of FXCM and is therefore acting independently. The opinions given are their own, constitute general market commentary, and do not constitute the opinion or advice of FXCM or any form of personal or investment advice. FXCM neither endorses nor guarantees offerings of third-party speakers, nor is FXCM responsible for the content, veracity or opinions of third-party speakers, presenters or participants.

DOW JONES: Buy signal above the 4month RectangleDow Jones just turned bullish on its 1D technical outlook (RSI = 56.676, MACD = 255.440, ADX = 30.051) as it hit the 4H MA50 after an instant rebound on the 4H MA100 inside the same session. This is a strong bullish reversal but the buy signal will be validated if the price crosses over the 4month Rectangle pattern. The rally from its January 13th bottom has been with a significant correction until Friday's and today so far and according to the November rally which was two-fold, if this is the start of the 2nd bullish stage, it should be -1.70% weaker than the first. This implies that from today's low we should rise by +6.30%. This gives us a TP = 46,550 but in order to overcome the bearish pressure of the Rectangle, we will buy only if then price crosses over it.
See how our prior idea has worked out:
## If you like our free content follow our profile to get more daily ideas. ##
## Comments and likes are greatly appreciated. ##
