Tariffs, tariffs and more tariffs... What's next for the Dow?It seems like we are stepping into Tariff Wars 2.0, with the announcement of the tariffs on Canada, Mexico and China. But is the outlook really that bad? Let's take a look at the MARKETSCOM:US30 scenario.
TVC:DJI
74.2% of retail investor accounts lose money when trading CFDs with this provider. You should consider whether you understand how CFDs work and whether you can afford to take the high risk of losing your money. Past performance is not necessarily indicative of future results. The value of investments may fall as well as rise and the investor may not get back the amount initially invested. This content is not intended for nor applicable to residents of the UK. Cryptocurrency CFDs and spread bets are restricted in the UK for all retail clients.
Dowjones

DowJones Trade ideaAfter a selloff last Friday and today a huge gap at the open, my bias will be based on the price action. Since the price is inside the consolidation phase, I will be waiting for a break on either side to plan a trade, as marked up in the chart.

DOW JONES INDEX (US30): Bullish Outlook Explained
It feels like US30 index is preparing to recover
after Friday's and today's selloff.
As a confirmation, I see a nice bullish imbalance
after a test of a daily support and a tiny ascending triangle
pattern on an hourly.
Goals: 44196 / 44470
❤️Please, support my work with like, thank you!❤️

Weekly Market Forecast Feb 2-7thThis is an outlook for the week of Feb 2-7th.
In this video, we will analyze the following FX markets:
ES \ S&P 500
NQ | NASDAQ 100
YM | Dow Jones 30
GC |Gold
SiI | Silver
PL | Platinum
HG | Copper
The indices were not easy to trade last week, as there were plenty of fundamentals at play. However, they are relatively still strong, and I am looking for further gains next week.
NFP week, imo, is best traded Mon-Wed. Thurs will likely see consolidation until the NFP news announcement Friday morning. I will look to fade the news release on Friday for NY Session.
Enjoy!
May profits be upon you.
Leave any questions or comments in the comment section.
I appreciate any feedback from my viewers!
Like and/or subscribe if you want more accurate analysis.
Thank you so much!
Disclaimer:
I do not provide personal investment advice and I am not a qualified licensed investment advisor.
All information found here, including any ideas, opinions, views, predictions, forecasts, commentaries, suggestions, expressed or implied herein, are for informational, entertainment or educational purposes only and should not be construed as personal investment advice. While the information provided is believed to be accurate, it may include errors or inaccuracies.
I will not and cannot be held liable for any actions you take as a result of anything you read here.
Conduct your own due diligence, or consult a licensed financial advisor or broker before making any and all investment decisions. Any investments, trades, speculations, or decisions made on the basis of any information found on this channel, expressed or implied herein, are committed at your own risk, financial or otherwise.

Dow Jones Trading IdeaBased on Simple Technical Analysis ( Trendline + Support & Resistance )
Risk Disclaimer:
Please be advised that I am not telling anyone how to spend or invest their money. Take all of my analysis as my own opinion, as entertainment, and at your own risk. I assume no responsibility or liability for any errors or omissions in the content of this page, and they are for educational purposes only. Any action you take on the information in this analysis is strictly at your own risk. There is a very high degree of risk involved in trading. Past results are not indicative of future returns. Good luck :-)

US30 Analysis: Is This Resistance the Turning Point?👀 👉 In this video, we conduct an in-depth analysis of US30, dissecting its prevailing uptrend and the recent retracements from resistance. We’ll examine key support and resistance zones, market structure, and price action behavior to identify potential trade scenarios. With price nearing a significant resistance level, we assess possible countertrend opportunities—provided price action aligns with our technical outlook. Watch now for a comprehensive breakdown. This analysis is for educational purposes only and should not be considered financial advice.

Dow Jones - Trading 2025 Is Pretty Clear!Dow Jones ( TVC:DJI ) will create another green year:
Click chart above to see the detailed analysis👆🏻
For the past 15 years, the Dow Jones has been respecting two significant rising trendlines. With each of the previous cycles being around +80% and corrections always starting with the new year, everything is pointing towards another phenomenal stock market year.
Levels to watch: $50.000
Keep your long term vision,
Philip (BasicTrading)

DJI ( US30 )The Dow Jones Industrial Average breaking above a resistance zone near 44,900 - 44,950, marked by arrows indicating previous rejection points. A successful breakout suggests bullish momentum with potential for further upside towards the marked target area.

DOW JONES starting a bullish streak to 48500.Dow Jones / US30 is trading inside a Channel Up since August 2022 and is right now on the 3rd straight green 1week candle.
Even though it is approaching the top of this 2.5 year pattern, the upcoming Bullish Cross on the 1week MACD indicates that the rally that is starting could be of a similar magnitude like November 2023 and October 2022.
Consequently, we expect this to reach at least the 2.0 Fibonacci extension on a diverging Channel Up.
Target 48500.
Previous chart:
Follow us, like the idea and leave a comment below!!

US30 - Make or Break zone!Hello TradingView Family / Fellow Traders. This is Richard, also known as theSignalyst.
📈 US30 is currently retesting its all-time high at $45,000.
🏹For US30 to enter the price discovery phase and reach new ATHs, an 4H candle close above $45,000 is required.
📉On the other hand, if the last major low marked in red is broken downward, a deep correction towards the orange support would in play.
For now, we wait! ⏱️
📚 Always follow your trading plan regarding entry, risk management, and trade management.
Good luck!
All Strategies Are Good; If Managed Properly!
~Rich
Disclosure: I am part of Trade Nation's Influencer program and receive a monthly fee for using their TradingView charts in my analysis. This helps me cover the cost of providing regular insights.

DJIA Breakout Incoming? Bulls Eye 48,000+Dow Jones Industrial Average (DJIA) Analysis – Bullish Continuation?
The DJIA remains in a strong uptrend, respecting the rising channel structure.
Recent price action shows a successful retest of key Fibonacci support, followed by a bullish bounce, signaling a potential continuation toward new highs.

Dow Jones 30 is near its all-time high. Can we create a new one?Can the Fed help the MARKETSCOM:US30 move a bit further north and establish a new all-time high? There is a possibility for that, however, we need to wait for the Fed press conference, when market volatility may increase significantly. That said, let the market settle and we can see what we can do. Check the video for more details.
TVC:DJI
RISK DISCLAIMER
74.2% of retail investor accounts lose money when trading CFDs with this provider. You should consider whether you understand how CFDs work and whether you can afford to take the high risk of losing your money. Past performance is not necessarily indicative of future results. The value of investments may fall as well as rise and the investor may not get back the amount initially invested. This content is not intended for nor applicable to residents of the UK. Cryptocurrency CFDs and spread bets are restricted in the UK for all retail clients.

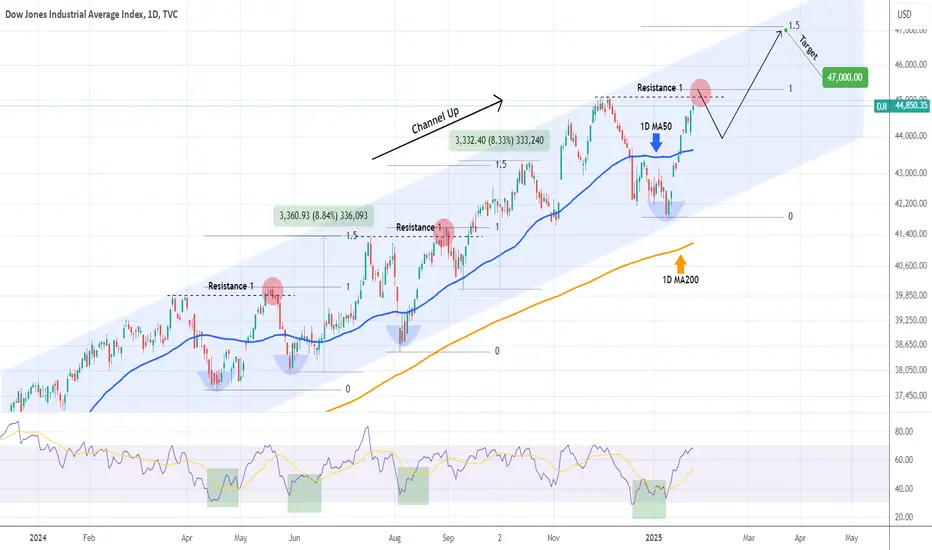
DOW JONES close to a rejection. See where to buy & target 47000.Dow Jones (DJI) gave us the most optimal buy entry on our previous call (January 09 2025, see chart below), as we bought right below the 4H MA200, which was the bottom of the 1-year Channel Up, and on minimum risk it hit our 45000 Target:
The price is currently about to break above Resistance 1. As this chart shows, every time a sub-1D MA50 (blue trend-line) rebound broke above a Resistance 1 level, it was only on a marginal note and then corrected back to the 1D MA50.
The two notable examples where August 30 2024 and May 20 2024. After the correction bottomed and the bullish trend was resumed, the rebound that followed reached the 1.5 Fibonacci extension, making a roughly +8.50% rise from the Low.
This indicates that the next Higher High of the Channel Up should be a little over 47000 and that will be our Target after we catch that 1D MA50 pull-back entry.
-------------------------------------------------------------------------------
** Please LIKE 👍, FOLLOW ✅, SHARE 🙌 and COMMENT ✍ if you enjoy this idea! Also share your ideas and charts in the comments section below! This is best way to keep it relevant, support us, keep the content here free and allow the idea to reach as many people as possible. **
-------------------------------------------------------------------------------
💸💸💸💸💸💸
👇 👇 👇 👇 👇 👇
DJI - 1590 Points and Running!This is a long trade setup on the Dow Jones Industrial Average (DJI) on the 15-minute timeframe. The trade was initiated on January 14th, 2025, and has shown a significant upward move since then. As of today, the position is currently sitting at a substantial profit of 1590 points.
Trade Confirmation Rules:
The Risological Dotted Trend Line turned green, indicating a bullish trend or a change in trend direction.
The Risological Options Trading Indicator turned green with a bullish crossover, suggesting favorable conditions for long options positions.

DOW JONES: Channel Up rebounding on the MA50 (4h).Dow Jones is trading inside a Channel Up which hit today its MA50 (4h).
That was right at the bottom of the Channel Up, which is a strong buy signal.
Trading Plan:
1. Buy on the current market price.
Targets:
1. 45400 (+3.86% rise like the previous Leg).
Tips:
1. The RSI (4h) is also rebounding in a similar manner as the January 13th low.
Please like, follow and comment!!
Notes:
Past trading plan:

DOW JONES: Absorbing tech sector's losses.Dow Jones remains heavily bullish on its 1D technical outlook (RSI = 63.633, MACD = 251.980, ADX = 35.788) and in contrast with Nasdaq's heavy losses, which is rattled by DeepSeek, it is rising. It seems that industrial stocks are absorbing quite a significant portion of tech's losses. Dow's long term Channel Up pattern remains intact and last week's crossing over the 1D MA50 and the bearish wave, confirmed that we are at the start of the new bullish wave. Based on the HL of the 1D RSI that was completed on the January 10th bottom, we draw strong comparisons with the October 27th 2023 bottom. If the index holds the 1D MA50, we expect the next high to be at 48,000 and after a pullback, complete the wave by May on a +20.75% rise (TP = 50,500), same as the increase of the 2024 bullish wave.
See how our prior idea has worked out:
## If you like our free content follow our profile to get more daily ideas. ##
## Comments and likes are greatly appreciated. ##

Sankara’s Brain: Why does Hegemony and Supremacy work? US30/DowTrumpian economics ushers the Neo Titanic era of late-stage capitalism. But are you really ready?
Blessings people. Are you well?
I'm just easing back into the site myself.
I've given you the most basic chart for your head tops!! You're welcome. It just illustrates my main direction today.
I entered the premarket with the hands-off (alerts only) approach and a wide stop.
Targeting 250 points of the US 3 to close out and historic week
I may also use a scalping strategy between the LSE and NYE opens
The pips are falling out of the sky. The bulls 🦬 can smell the blood. Even us bears 🐻can't resist the fresh meat in the woods this evening.
As the Fed looks to justify every reason slash rates and discount public spending it's truly a feast indeed.
As always on the menu is the working class, as the new deconstructionists claim their deck chairs on the reality TV show on Trump Neo-Titanic.
In short lads, just like the first time around - it's a good year to get rich. (Again)
Stay safe and profitable. ✊🏿
🔚
——————————
Important❗️:
Whether you agreed or disagreed with this content, hopefully, you found it useful. Please remember to like, comment and follow.
Let’s support each other to improve, learn and grow.
——————————
Disclaimer⛔️:
Please do NOT use my ideas as the basis for any financial investment.
This content is time, price and market sensitive and intended for educational purposes only.
-——————————
Bio 🅱️:
Charles Sankara
Day Trader

NASDAQ INDEX (US100): To The All Time High
A strong bullish breakout of a key daily horizontal resistance cluster
indicates that US100 index will soon reach the All-Time High.
Be ready for more growth at least to 22085.
❤️Please, support my work with like, thank you!❤️

EUR/USD : Possible Fall Ahead? (READ THE CAPTION)By analyzing the #EURUSD chart on the 3-day timeframe, we can see that the price finally hit the 1.044 target, delivering a 250-pip return. Currently, EUR/USD is trading around the 1.041 level. If a strong rejection occurs at this zone, we can anticipate a potential drop toward 1.035 as the first target and 1.025 as the second target. This analysis will be updated accordingly!
The Main Analysis :
Please support me with your likes and comments to motivate me to share more analysis with you and share your opinion about the possible trend of this chart with me !
Best Regards , Arman Shaban

Heading into 78.6% Fibonacci resistance?Dow Jones (US30) is rising towards the pivot which has been identified as a pullback resistance and could reverse to the 1st support which is an overlap support.
Pivot: 44,343.65
1st Support: 43,729.99
1st Resistance: 44,765.65
Risk Warning:
Trading Forex and CFDs carries a high level of risk to your capital and you should only trade with money you can afford to lose. Trading Forex and CFDs may not be suitable for all investors, so please ensure that you fully understand the risks involved and seek independent advice if necessary.
Disclaimer:
The above opinions given constitute general market commentary, and do not constitute the opinion or advice of IC Markets or any form of personal or investment advice.
Any opinions, news, research, analyses, prices, other information, or links to third-party sites contained on this website are provided on an "as-is" basis, are intended only to be informative, is not an advice nor a recommendation, nor research, or a record of our trading prices, or an offer of, or solicitation for a transaction in any financial instrument and thus should not be treated as such. The information provided does not involve any specific investment objectives, financial situation and needs of any specific person who may receive it. Please be aware, that past performance is not a reliable indicator of future performance and/or results. Past Performance or Forward-looking scenarios based upon the reasonable beliefs of the third-party provider are not a guarantee of future performance. Actual results may differ materially from those anticipated in forward-looking or past performance statements. IC Markets makes no representation or warranty and assumes no liability as to the accuracy or completeness of the information provided, nor any loss arising from any investment based on a recommendation, forecast or any information supplied by any third-party.

DOW has a full Bull year ahead based on PRESIDENT'S CHEATSHEETDow Jones (DJI) has started the year on a positive note and that is anything but a coincidence. On this 1W chart you can see Dow's price action since the early 2009 bottom of the U.S. Housing Crisis.
That happened to be Obama's 1st year of Presidency. As you can see, 2009 was an incredibly bullish year with the index rising more than +60% from the year's bottom.
Four years later in 2013, which was the 1st year of Obama's 2nd term in office, Dow had again a strong year, rising by +25% (naturally the previous term was more aggressive as the market had tremendous upside potential to recover from one of the worst economic crises in history).
Moving forward again 4 years (2017), we can see yet another bullish (+35%) 1st year of Presidency, this time Trump's first term.
Biden also had his fair share of bullish 1st year of Presidency in 2021 (+23%).
The pattern is evident and shows the euphoria the market has when the U.S. President assumes his duties on his 1st year. It also shows that (excluding as mentioned 2009, which was natural to see a stronger recovery) on average it is fair to expect a price increase during the 1st year of around +25% to +30%.
In fact, the price action that led to the current 1st year of Presidency that has just started (Trump's 2nd term), is very similar to the one that preceded Obama's 2nd term (2013). Both formed a Channel Up after the 1W MA200 (orange trend-line) was tested and held. That pattern pushed the price higher until the 1st year of Presidency, that found the index on the 1W MA50 (blue trend-line). Even the 1W MACD sequences that preceded this, are similar between the two fractals.
As a result, investors have a strong reason to be bullish in 2025 and if pattern achieves the bear minimum of 2021 (+23%), we can expect to see 51000 by the end of the year.
-------------------------------------------------------------------------------
** Please LIKE 👍, FOLLOW ✅, SHARE 🙌 and COMMENT ✍ if you enjoy this idea! Also share your ideas and charts in the comments section below! This is best way to keep it relevant, support us, keep the content here free and allow the idea to reach as many people as possible. **
-------------------------------------------------------------------------------
💸💸💸💸💸💸
👇 👇 👇 👇 👇 👇

DOW JONES INDEX (US30): Back to Bullish Trend
US30 Index completed a bullish accumulation in a wide
horizontal sideways range on a daily.
Its resistance was broken on Friday and we see a positive
bullish reaction to that after its retest.
There is a high probability that the market will continue rising.
Next resistance - 44360
❤️Please, support my work with like, thank you!❤️

Market Forecast UPDATES! Jan 20 MondayIn this video, we will update the forecasts for the following markets:
ES \ S&P 500
NQ | NASDAQ 100
YM | Dow Jones 30
GC |Gold
SiI | Silver
PL | Platinum
HG | Copper
Enjoy!
May profits be upon you.
Leave any questions or comments in the comment section.
I appreciate any feedback from my viewers!
Like and/or subscribe if you want more accurate analysis.
Thank you so much!
Disclaimer:
I do not provide personal investment advice and I am not a qualified licensed investment advisor.
All information found here, including any ideas, opinions, views, predictions, forecasts, commentaries, suggestions, expressed or implied herein, are for informational, entertainment or educational purposes only and should not be construed as personal investment advice. While the information provided is believed to be accurate, it may include errors or inaccuracies.
I will not and cannot be held liable for any actions you take as a result of anything you read here.
Conduct your own due diligence, or consult a licensed financial advisor or broker before making any and all investment decisions. Any investments, trades, speculations, or decisions made on the basis of any information found on this channel, expressed or implied herein, are committed at your own risk, financial or otherwise.
