DJIDJI - Dow Jones Index
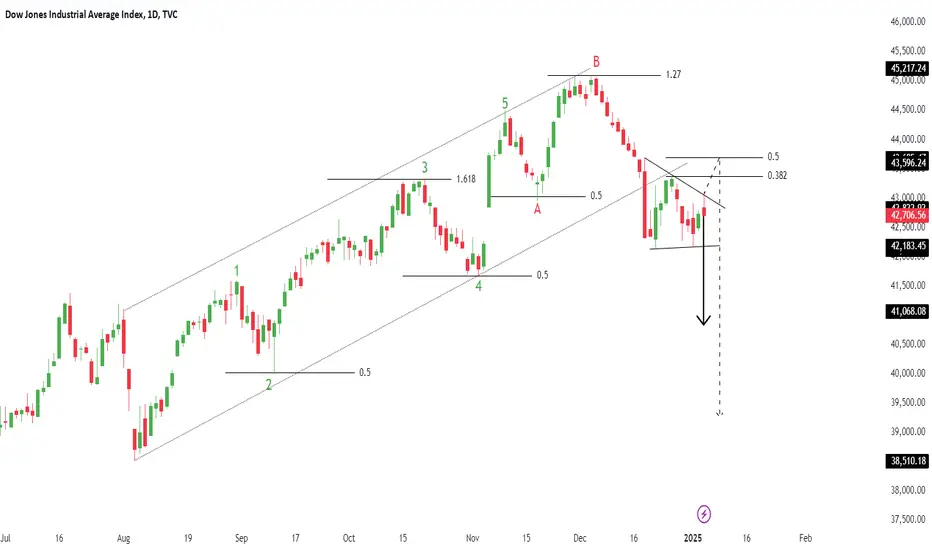
Break of Structure
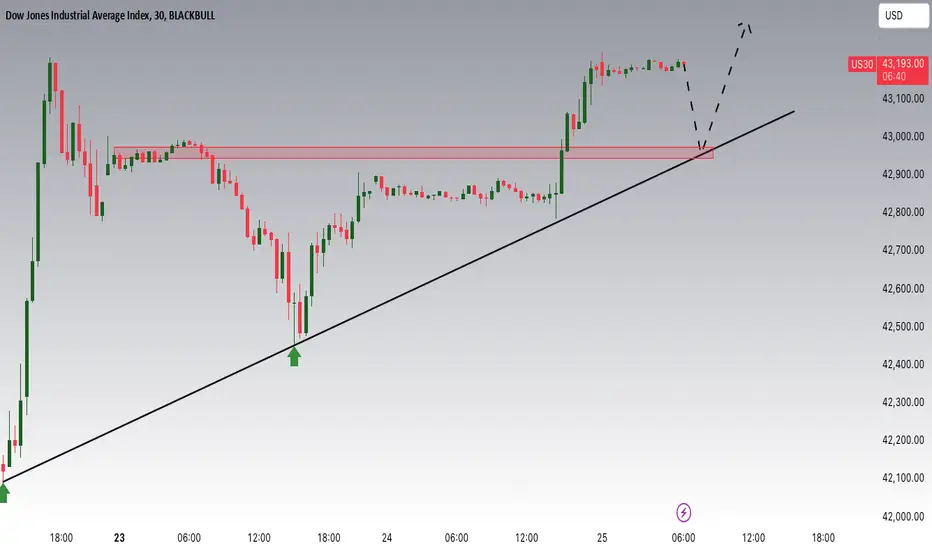
Symmetrical Triangle as an Corrective Pattern in Short Time Frame
Demand Zone
Fibonacci Level - 38.20% / 50.00%
Completed " 12345 " Impulsive Waves and " AB " Corrective Waves
Dowjones
Dow Jones 30-Min Short: Bearish Momentum Building Toward 42kThe Dow Jones has triggered my short position following a significant volume spike, currently trading below the key EMA levels. The technical setup suggests a bearish continuation toward the 42k price zone. This aligns with a short-term correction in equities after December marked the Dow’s worst monthly performance in over two years.
Fundamentals:
• Major indexes continue to struggle, with the Dow and S&P 500 facing extended losing streaks.
• Market sentiment remains cautious as investors digest recent corporate earnings, geopolitical risks, and upcoming key economic data such as ISM Manufacturing PMI.
• Despite a strong year-end rally, December losses reflect broader market uncertainty, further pressuring the Dow.
Technicals:
• Price remains below both the 50 and 200 EMAs, signaling bearish momentum.
• Volume analysis highlights increased selling pressure, confirming bearish sentiment.
• Immediate support at 42,000 aligns with key demand zones and historical price reactions.
With these conditions in play, I’ll manage risk carefully, monitor for any major shifts, and adjust my position accordingly. Pay yourself and trade responsibly!
Note: Please remember to adjust this trade idea according to your individual trading conditions, including position size, broker-specific price variations, and any relevant external factors. Every trader’s situation is unique, so it’s crucial to tailor your approach to your own risk tolerance and market environment.

Dow Jones Industrial (DJI): SHORT TRADETrade Overview:
The Dow Jones Industrial (DJI) chart presents a strong short trade setup on the 1-hour timeframe. Using the Risological Swing Trading Indicator , this trade successfully achieved TP1 (43,779.69) through TP3 (42,180.27), with TP4 (41,686.05) remaining highly probable based on prevailing market trends.
Key Levels:
Entry Price: 44,273.91
Stop Loss (SL): 44,673.77
Take Profits:
TP1: 43,779.69
TP2: 42,979.98
TP3: 42,180.27
TP4: 41,686.05
Market Sentiment:
The trade reflects bearish momentum, supported by broader market conditions indicating reduced risk appetite. The Dow Jones continues to exhibit a descending trendline and weaker market confidence.
The Risological Indicator identified precise entry, stop loss, and take-profit levels, enabling a disciplined and profitable trade execution. With three targets already achieved, the setup remains poised to capture further downside momentum.

Elliot Wave Analysis -DOW JONES IND. AVG. (1932-2026)We have done a Loooooooong Term Elliot Wave Analysis starting from 1932 and maybe ending in 2026(or perhaps 2027).
If you see the chart in Normal scale, its parabolically going right up, and these type of moves are really bad for the market. So I have just tried to analyze the waves and hope it might help you to exit the markets at the right time.
Sayo Nara.................

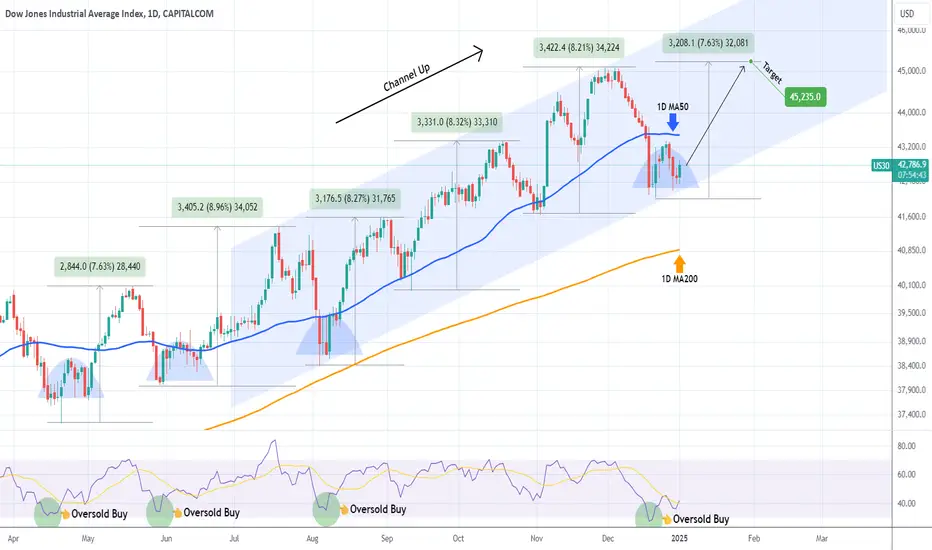
DOW JONES: Rare Channel Up bottom buy opportunityDow Jones remains bearish on its 1D technical outlook (RSI = 40.772, MACD = -242.050, ADX = 47.872) as despite trading on the 1D MA100, it has failed yet to recover the 1D MA50. Technically though, the price action is sitting exactly at the bottom of the long term Channel Up and the 1D RSI has formed a bottom fractal identical to those of June and April 2024. The minimum target on those has been +7.65% but since we have the R1 level to consider as Resistance, that will be our target (TP = 45,000).
## If you like our free content follow our profile to get more daily ideas. ##
## Comments and likes are greatly appreciated. ##

Phathom Pharmaceuticals ($PHAT ): High-Growth Potential I spend time researching and finding the best entries and setups, so make sure to boost and follow for more.
Phathom Pharmaceuticals ( NASDAQ:PHAT ): High-Growth Potential in Biopharmaceuticals
Trade Setup:
- Entry Price: $7.53 (Activated)
- Stop-Loss: $5.67
- Take-Profit Targets:
- TP1: $22.00
- TP2: $41.80
Company Overview:
Phathom Pharmaceuticals ( NASDAQ:PHAT ) is a biopharmaceutical company focused on developing and commercializing novel treatments for gastrointestinal diseases. With a pipeline of promising drugs, NASDAQ:PHAT is gaining attention as a high-potential player in its sector.
Recent FDA approvals and upcoming clinical trial data releases have positioned the company for significant upside. These developments could catalyze rapid stock price appreciation in the coming months.
Earnings Reports:
- In its most recent quarter, NASDAQ:PHAT reported revenues of $12.3 million, driven by early sales from its newly approved drug for acid-related conditions.
- Operating losses narrowed compared to previous quarters, reflecting disciplined cost management.
Valuation Metrics:
- Market Cap: $500 million, indicating a small-cap stock with room for growth.
- Price-to-Sales (P/S) Ratio: 4.1, suggesting moderate undervaluation compared to industry averages.
Market News:
- Phathom recently announced successful Phase III trial results for another key drug in its pipeline, expected to drive future revenue growth.
- The company is expanding its distribution partnerships, aiming to broaden its market reach.
Technical Analysis (Daily Timeframe):
- Current Price: $7.53
- Moving Averages:
- 50-Day SMA: $6.80
- 200-Day SMA: $7.00
- Relative Strength Index (RSI): Currently at 55, signalling neutral momentum with room for further upside.
- Support and Resistance Levels:
- Immediate Support: $7.00
- Resistance: $9.00
The stock has activated the entry at $7.53, with strong support at $7.00. A breakout above $9.00 could set the stage for rapid movement toward TP1 at $22.00 and TP2 at $41.80.
Risk Management:
The stop-loss at $5.67 limits downside risk to approximately 25%, while the first take-profit target at $22.00 offers a **192% gain**, and TP2 provides a massive **455% return**, making this an attractive trade for long-term investors.
Key Takeaways:
- NASDAQ:PHAT is a high-risk, high-reward opportunity in the biotech sector, driven by a strong pipeline and recent FDA approvals.
- The trade setup offers an excellent risk-to-reward ratio, aligning with the stock’s growth potential.
- Ideal for investors seeking exposure to a rapidly developing biopharmaceutical company.
When the Market’s Call, We Stand Tall. Bull or Bear, We’ll Brave It All!

DOW JONES Bullish accumulation below the 1D MA50.Dow Jones (DJI) has been trading within a Channel Up since the July 18 High. Right now the price is consolidating between its bottom (Higher Lows trend-line) and the 1D MA50 (blue trend-line). At the same time, the 1D RSI breached the oversold barrier (30.00) and rebounded.
This trading sequence has presented the most efficient buy opportunity since April 19 2024 and the even though all Bullish Legs that followed have been a little over +8.00%, the weakest one has been +7.63%. As a result, our current Bullish Leg Target of 45235 is formulated out of that minimum.
-------------------------------------------------------------------------------
** Please LIKE 👍, FOLLOW ✅, SHARE 🙌 and COMMENT ✍ if you enjoy this idea! Also share your ideas and charts in the comments section below! This is best way to keep it relevant, support us, keep the content here free and allow the idea to reach as many people as possible. **
-------------------------------------------------------------------------------
💸💸💸💸💸💸
👇 👇 👇 👇 👇 👇
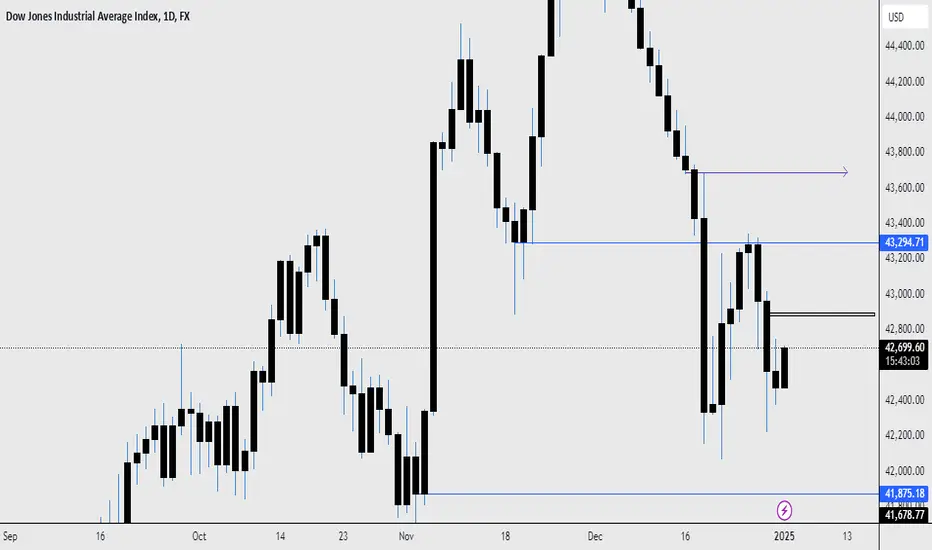
US30 LongThis analysis focuses on the interplay of weekly and intraday confluences, which collectively point towards a potential bullish scenario. A detailed breakdown of the price movements and key levels is provided to support the thesis.
1. Weekly Confluences
Unmet Target: The price has yet to reach its anticipated target of 45,300, indicating unfulfilled market objectives.
Order Collection Observation: A significant retracement suggests an attempt to collect orders within a specific price region.
The first notable level was 43,500, corresponding to a prior body closure. Price broke through this level and moved downward.
The second key region, 42,100, showed a rejection pattern characterized by a three-pin formation.
Pattern Analysis: An "M" pattern is apparent, signaling that the price may retest its neckline at 43,500.
2. Four-Hour Timeframe Insights
Rejection and Momentum: The price rejected the 42,100 weekly level with strong bullish momentum, forming a bullish setup with a target of 42,600.
Order Collection Confirmation : Despite the bullish target not being achieved, the retracement implies another round of order collection, this time within the 42,328 daily level.
Conclusion and Thesis:
The evidence points to a bullish outlook. While the price is gathering momentum and confirming its intentions, I will wait for clear intraday confirmations before entering the market. Patience at this stage will ensure alignment with the larger trend and reduce exposure to potential false moves.
What Is the DJIA, and How Can You Trade It?What Is the DJIA, and How Can You Trade It?
The Dow Jones Industrial Average (DJIA) is one of the world’s most recognised stock indices, often seen as a barometer for the US economy. Tracking 30 influential companies, the DJIA offers insights into market trends and economic shifts. This article explores what the DJIA represents, how it’s constructed, and how to trade it.
Dow Jones Definition
The Dow Jones Industrial Average, usually abbreviated to DJIA or DJI, is one of the most well-known stock indices globally, often called simply "the Dow." This index tracks 30 of the publicly traded companies in the US, including major names like Apple, Boeing, and Goldman Sachs. Designed to represent a cross-section of the American economy (although it does not include utilities or transportation companies), the DJIA provides a snapshot of market sentiment and economic health through the performance of these companies.
The DJIA was founded in 1896 by Charles Dow and Edward Jones, initially with 12 major industrial companies. Over time, Dow Jones Industrial Average companies evolved to include corporations across diverse sectors, though it's worth noting that these are all large-cap companies, meaning they have substantial market values.
Importantly, the Dow is price-weighted, meaning in DJIA, a stock’s price directly affects the index value — stocks with higher prices hold more influence over the index's movements than those with lower prices. So, a stock priced at $300 will impact the DJIA more than one priced at $100, even if the latter company is larger in overall market value. For example, high-priced DJIA stocks like Goldman Sachs or UnitedHealth often drive the index’s movements more than lower-priced yet substantial companies like Cisco. As a result, the index is unique compared to indices weighted by market capitalisation, like the S&P 500.
The Dow’s movements can reflect broader market trends, but it provides less of a complete representation of the economy or stock market than the S&P 500 or Russell 2000 since it includes only 30 companies. Nonetheless, traders often look to the Dow Jones index as an indicator of market strength or weakness. When these 30 companies perform well, it often signals broader economic optimism; when they struggle, it can be a sign of potential downturns.
Components and Weighting of the DJIA
The Dow Jones Industrial Average consists of 30 large-cap US companies across sectors like technology, finance, healthcare, and industrials. Changes to the DJIA’s stocks are rare but do happen when companies no longer reflect the US economic landscape. For instance, a business facing long-term decline may be replaced by a rising industry leader to keep the index relevant. These decisions are made by a committee that aims to ensure the DJIA remains a meaningful snapshot of the economy despite its relatively small roster of companies.
What Stocks Are in the Dow Jones?
As of November 2024, there are several notable and well-recognised companies in the Dow, including:
- Apple Inc.
- Microsoft Corporation
- Amazon.com Inc.
- The Coca-Cola Company
- Goldman Sachs Group Inc.
- Johnson & Johnson
- McDonald's Corporation
- Boeing Company
- Visa Inc.
- Procter & Gamble Co.
Factors Affecting the DJIA’s Movements
The DJIA can swing up or down due to various factors, reflecting shifts in the economy, company-specific developments, and broader market sentiment. The primary elements driving the index include:
- Economic Indicators: Key data releases, like GDP growth, employment reports, and inflation rates, directly impact the DJIA. Strong economic indicators tend to lift the index as they suggest a healthy business environment, while weaker data can pull it down, signalling potential challenges for major companies.
- Interest Rates: Interest rate changes, particularly from the Federal Reserve, play a significant role. When rates rise, borrowing becomes more expensive, which can reduce corporate profits and weigh on the Dow Jones Industrial Average’s stocks. Conversely, lower rates often encourage investment and consumer spending, which can boost the index.
- Corporate Earnings Reports: Quarterly earnings announcements from the 30 DJIA companies are critical. Positive earnings results can lift the Dow, especially if they beat market expectations and are from one of its pricier components. Conversely, disappointing earnings can drag down the index, especially if they reflect broader industry or sector weaknesses.
- Global Events: Major global developments, like geopolitical tensions, trade agreements, or health crises, can quickly shift market sentiment. For instance, the onset of the COVID-19 pandemic caused sharp declines in the DJIA as economic concerns spiked.
- Sectoral Influence: The DJIA’s performance can be significantly impacted by trends within particular sectors, especially those with higher-priced stocks. For instance, if several tech companies in the index perform well, they can drive up the DJIA, given their substantial influence.
- Market Sentiment: General market optimism or fear often moves the DJIA, influenced by factors like investor confidence, media coverage, and broader economic outlooks. Indicators such as the VIX (volatility index) can help gauge this sentiment and reflect periods of heightened volatility.
Trading the DJIA with CFDs
While traders have various ways to access the Dow Jones Industrial Average—from ETFs to futures—many prefer trading DJIA Contracts for Difference (CFDs) for their flexibility and accessibility. CFDs allow traders to speculate on the DJIA’s price movements without owning the actual assets in the index.
One of the benefits of CFDs is that they enable both long and short positions, so traders can potentially take advantage of rising or falling markets. CFDs also allow for leveraged trading, meaning traders can control a larger position with a smaller upfront investment. However, leverage amplifies both potential returns and risks, making risk management essential when trading CFDs.
For those interested in DJIA CFDs, FXOpen provides access to these contracts in our TickTrader platform under the Dow ticker WS30m, giving traders an easy-to-use, responsive way to monitor and trade the index.
How Traders Analyse the DJIA
Traders use several analysis methods to interpret the DJIA’s movements, aiming to understand trends, gauge sentiment, and identify potential trading opportunities. Some of the most common approaches include:
Fundamental Analysis
Fundamental analysis involves examining economic data and financial statements of DJIA companies. Traders look at metrics like revenue growth, earnings, and profit margins to gauge the health of the companies within the index. Broader economic indicators, such as unemployment rates or consumer confidence, are also essential in understanding how macroeconomic conditions may impact the Dow.
Technical Analysis
Many traders rely on technical analysis to spot trends and key price levels. Common tools include moving averages, which smooth out price data to identify direction over time, and support and resistance levels, which highlight areas where the DJIA price has historically paused or reversed. Trendlines help traders visualise the overall direction, and indicators like the Relative Strength Index (RSI) show whether the index might be overbought or oversold.
Market Sentiment and Positioning Analysis
Gauging the mood of the market is crucial, especially with an index as prominent as the DJIA. Sentiment analysis involves looking at factors like trading volume and indicators such as the VIX (volatility index), which measures market expectations for near-term volatility.
It’s also possible to interpret the positioning of traders in DJIA futures (expressed with the DJI ticker YM) via the CFTC Commitment of Traders report for insights into how various market participants are taking positions in the Dow. For instance, if the number of contracts held by non-commercials and speculators is positive, these participants are seen as bullish.
Correlation Analysis
Traders sometimes analyse correlations between the DJIA and other indices or assets. For example, the DJIA often moves alongside the S&P 500, but these correlations can shift based on economic or sector-specific developments. Through understanding these relationships, traders can anticipate how broader market trends might impact the Dow.
Risks Associated with Trading the DJIA
Trading the DJIA can be rewarding, but it comes with notable risks. One key risk is market volatility. Events like economic data releases, policy changes, or unexpected global events can cause sharp swings in the Dow’s value, creating opportunities but also increasing the chance of sudden losses.
Another risk comes from leverage, especially with derivatives like CFDs. While leverage allows traders to control larger positions with less capital, it amplifies both returns and losses. Even a small adverse movement in the DJIA can lead to significant losses if leveraged positions aren’t managed carefully.
Economic sensitivity is another factor. As the DJIA reflects the performance of large US companies, it’s highly sensitive to shifts in economic indicators like inflation and interest rates. A surprise rate hike or economic slowdown can affect the entire index, impacting all traders with positions in the DJIA.
Finally, liquidity risks can arise, particularly in after-hours trading when market depth is thinner. This can lead to wider spreads and increased costs for those looking to enter or exit trades outside standard market hours.
The Bottom Line
The Dow Jones Industrial Average offers valuable insights and trading opportunities for those interested in the broader US economy. With a clear understanding of its components, influencing factors, and trading approaches, traders can navigate the DJIA trading confidently. Ready to get started with our low-cost, high-speed trading environment? Open an FXOpen account and explore DJIA CFDs on a platform built for traders at every level.
FAQ
What Is the Dow Jones Industrial Average?
The Dow Jones meaning refers to a stock market index that tracks 30 large publicly traded companies in the United States. Known simply as "the Dow" and abbreviated to DJIA, it provides a quick view of the economic performance of some of the largest and most influential companies across various sectors.
What Does the Dow Jones Measure?
The DJIA measures the performance of 30 significant US companies, reflecting broader economic trends and investor sentiment. As a price-weighted index, stocks with higher share prices exert more influence on the Dow’s total value.
How Many Stocks Are in the Dow Jones?
There are 30 stocks in the DJIA, representing companies from diverse industries like technology, finance, and healthcare.
What Is the Highest the Dow Jones Has Been?
As of 7 November 2024, the highest Dow Jones ever was $43,823.10, marking a record peak for the index.
Is the DJI Publicly Traded?
The DJIA itself isn’t publicly traded, but traders can invest in its performance through ETFs, futures, and CFDs that track its value.
This article represents the opinion of the Companies operating under the FXOpen brand only. It is not to be construed as an offer, solicitation, or recommendation with respect to products and services provided by the Companies operating under the FXOpen brand, nor is it to be considered financial advice

BEarish drop?Dow Jones (US30) is reacting off the pivot and could drop to the pullback support.
Pivot: 43,358.90
1st Support: 41,883.16
1st Resistance: 44,074.83
Risk Warning:
Trading Forex and CFDs carries a high level of risk to your capital and you should only trade with money you can afford to lose. Trading Forex and CFDs may not be suitable for all investors, so please ensure that you fully understand the risks involved and seek independent advice if necessary.
Disclaimer:
The above opinions given constitute general market commentary, and do not constitute the opinion or advice of IC Markets or any form of personal or investment advice.
Any opinions, news, research, analyses, prices, other information, or links to third-party sites contained on this website are provided on an "as-is" basis, are intended only to be informative, is not an advice nor a recommendation, nor research, or a record of our trading prices, or an offer of, or solicitation for a transaction in any financial instrument and thus should not be treated as such. The information provided does not involve any specific investment objectives, financial situation and needs of any specific person who may receive it. Please be aware, that past performance is not a reliable indicator of future performance and/or results. Past Performance or Forward-looking scenarios based upon the reasonable beliefs of the third-party provider are not a guarantee of future performance. Actual results may differ materially from those anticipated in forward-looking or past performance statements. IC Markets makes no representation or warranty and assumes no liability as to the accuracy or completeness of the information provided, nor any loss arising from any investment based on a recommendation, forecast or any information supplied by any third-party.

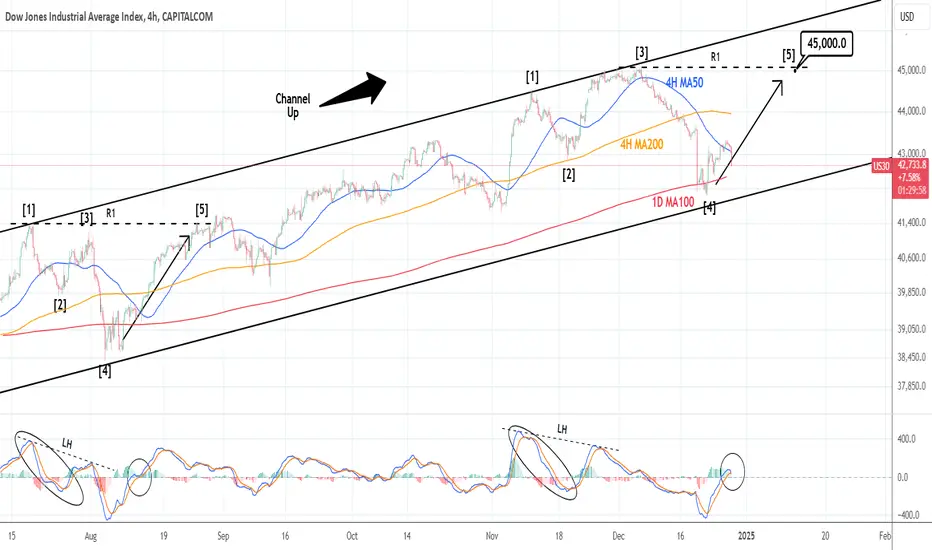
DOW JONES: Ignore the pullback, this is a new bullish wave.Dow Jones turned bearish again on its 1D technical outlook (RSI = 41.280, MACD = -138.420, ADX = 33.278) as it failed to hold the 4H MA50 as support today and crossed under it. The 1D MA100 is coming in as the next level of support, which formed the Dec 18th-19th low. According to the 4H MACD, the index formed during those 2 days a bottom similar to of August 5th. As long as the 1D MA100 holds, it is more likely to see a bounce above the 4H MA50 again like August 13th. Our goal is a wave, so we're targeting the R1 level (TP = 45,000).
## If you like our free content follow our profile to get more daily ideas. ##
## Comments and likes are greatly appreciated. ##
DOW JONES What signals the top of this Cycle?Dow Jones (DJI) has been on a highly systematic pattern ever since the 2009 bottom of the U.S. Housing Crisis and this chart on the 3W time-frame depicts very accurately the symmetrical nature of the Cycles that the index is going through in the past 15 years.
As you see, ever since the October 2011 bounce on both the 3W MA50 (blue trend-line) and 3W MA200 (orange trend-line), Dow started a hyper aggressive Bull Cycle, which after making a Top on each phase, it broke below the 3W MA50 to become a buy opportunity again but has never yet broken below the 3W MA200.
So far we have completed three such phases and we are currently on the 4th. In the three that have already been completed, the Top of the Phase was signaled by the RSI. At a certain point that it broke above the 70.00 overbought barrier, it started a Channel Down comprised of 4 legs (a through d). On the (d) leg, it gave a signal that Dow had (or is very close to) topped. That was the ultimate long-term Sell Signal. Similarly, when the index broke below its MA50 and the RSI double bottomed, it has been the ultimate signal to buy.
Right now it appears that the RSI has completed Leg (a) and is starting the rise to Leg (b) of its newly emerged Channel Down. That means that the market has around another 12 months before it Tops again.
-------------------------------------------------------------------------------
** Please LIKE 👍, FOLLOW ✅, SHARE 🙌 and COMMENT ✍ if you enjoy this idea! Also share your ideas and charts in the comments section below! This is best way to keep it relevant, support us, keep the content here free and allow the idea to reach as many people as possible. **
-------------------------------------------------------------------------------
💸💸💸💸💸💸
👇 👇 👇 👇 👇 👇

DJ30 Short 15 Min Chart SMA+ Trend line + On weekly BBDow30 short after getting clear Resistance from the SMA+ Trend line + On the weekly BB

DOW JOENS 1469 Points Secured on Risological BUY SELL IndicatorDow Jones Industrial (DJI) on a 15-minute timeframe captured significant profitable movements using the " Risological BUY SELL Indicator ". The tool effectively identified both bullish and bearish entries, allowing traders to secure impressive gains.
Highlights of Captured Trades:
584 Points captured in a downward move.
244 Points secured in a bullish retracement.
331 Points caught during a short trade.
310 Points profited in the final bullish rally.
The Risological BUY SELL Indicator demonstrated precision in marking key entry and exit points for high-confidence trading decisions.
Comment " FREE Trial " to get 7 days unlimited FREE trial of this indicator.

US30 Potential UpsidesHey Traders, in today's trading session we are monitoring US30 for a buying opportunity around 43,000 zone, USOIL is trading in an uptrend and currently is in a correction phase in which it is approaching the trend at 43,000 support and resistance area.
Trade safe, Joe.
US30 4HIt is expected that the price will move towards the middle range after hitting the upper resistance and then again move towards the lower target.
I also expect that after hitting the lower range, the price will change direction upwards; however, I will wait to see if an engulfing pattern occurs or not.

Major Indexes Face Downturn: What's Coming Next?◉ S&P 500 SP:SPX
● The long-term trendline support has been breached.
● The immediate support range is identified around the 5,650 to 5,700 levels.
◉ Nasdaq Composite NASDAQ:IXIC
● The Nasdaq Composite has rebounded from its long-term trendline support, demonstrating resilience amid economic uncertainty.
◉ NYSE Composite TVC:NYA
● The NYSE Composite has found support at its trendline and may bounce back from this important level.
◉ Dow Jones Industrial Average TVC:DJI
● After a consecutive decline over ten days, the index has surpassed its trendline support and is approaching the next support zone between 41,500 and 42,800.
Overall, all indices are anticipated to recover shortly, with expectations of robust performance from major stocks.

DOW JONES: 5 month Channel Up bottomed and 1D MA100 hit. BullishDow Jones turned bearish on its 1D technical outlook (RSI = 35.675, MACD = -65.830, ADX = 38.532) after yesterday's sharp drop due to the Fed announcing an outlook shift to 2 rate cuts in 2025 from 4 previously. Technically though that fall presents a unique long term buy opportunity as despite crossing under the 1D MA50, it managed to hit the 1D MA100 for the first time since Aug 8th while touching the bottom of the 5 month Channel Up. Today the price is showing the first signs of rebounding. The 1D RSI rebounding from below 30.000 (oversold) is also a great bullish indicator. The drop that resembles most December's is the first bearish wave of the Channel (July-August). When it recovered, the rebound hit the R1 level at first and that is our target (TP = 45,000).
## If you like our free content follow our profile to get more daily ideas. ##
## Comments and likes are greatly appreciated. ##

S&P500 INDEX (US500): Time to Recover
It looks like US500 is ready to recover after the yesterday's
crazy bearish movement.
We may see a pullback at least to 5940/
❤️Please, support my work with like, thank you!❤️

DOW JONES - BEARISH MOVEHello Traders !
The Dow Jones price failed to create a new higher high !
Currently, The Higher low is broken (change of character).
So, I expect a bearish move📉
_______________
TARGET: 43315.00🎯

[b]#US30 | Dow Jones[/b] Long opportunityThis is an in depth analysis of #US30 | Dow Jones based on data presented on the H4 timeframe, we can expect a little resistance from the selling pressure, but the ultimate push to the upside seems to be more prominent.

Dow Jones Potential UpsidesHey Traders, in today's trading session we are monitoring US30 for a buying opportunity around 43300 zone, Dow Jones is trading in an uptrend and currently is in a correction phase in which it is approaching the trend at 43300 support and resistance area.
Trade safe, Joe.

Sell Recommendation Note for Dow Jones IndexSell sINGAL
Current Price: 44,800
Stop Loss: 45,150
Target: 43,400
Disclaimer:
This note is for study purposes only. Please consult your financial advisor and evaluate risk exposure before taking any action. Investing involves risks, including the loss of principal.
