Raytehon (RTX) Head and Shoulders. Fundamental reasoning: DJT is a peace president vs Biden who allowed build of geopolitical tensions and warfare.
D.O.G.E dept. to radically overhaul the deep state and waste.
Other notable Military contractors include:.
#LMT
Northrup Grumman
Avic
Boeing
General Dynamics
BAE
Dowjones

DOW JONES High Channel Up symmetry points to 46000.Dow Jones (DJI) easily hit our 45000 Target as suggested on our November 20 idea (see chart below), and immediately turned sideways, consolidating basically for the past 6 days:
This is not the first time that we've come across this consolidation within the 4-month Channel Up as the exact same sequence was last seen during September 20 - October 08. As with today's price action, the consolidation also took place above the 1.0 Fibonacci level and once completed, it gave one final push to the 1.5 Fibonacci extension before correcting back to the 1D MA50 (blue trend-line).
As a result, we now set a new Target for the end of the year at 46000.
-------------------------------------------------------------------------------
** Please LIKE 👍, FOLLOW ✅, SHARE 🙌 and COMMENT ✍ if you enjoy this idea! Also share your ideas and charts in the comments section below! This is best way to keep it relevant, support us, keep the content here free and allow the idea to reach as many people as possible. **
-------------------------------------------------------------------------------
💸💸💸💸💸💸
👇 👇 👇 👇 👇 👇

Dow Jones_1HDow Jones index analysis Elliott wave analysis style Completion of five rising waves in Hotah time and the possibility of a downward correction Important resistance 44800 The main and important support is 43,900 Meanwhile, in the long term, any low towards 43900 can be bought for the long term.

DOW JONES targeting 165000 in the next 8 years.Dow Jones / US30 is following very distinct and easily recognizable patterns over the years and decades and this chart gives you the complete picture since the 1930s and the Great Depression.
We are currently well underway inside the Bull Cycle, which is the market's 3rd major these past 100 years.
With the support of the 1M MA50, this Bull Cycle (via a Channel Up pattern) is expected to continues rising until the point it breaks aggressively over the pattern towards the last years of the Bubble in 2029-2033.
From bottom to top, the previous two Bull Cycles rose by an incredible +2500%.
This means that long term and patient investors can still buy now and enjot another 8 years of immense growth and returns, targeting 165000.
Note that the RSI underneath the chart is on the 12M timeframe but achieves displaying the situatio more accurately than any. Clear Bear Cycle bottoms and breakouts over the MA when the Channel Up Bull Cycle started among all Cycles.
Follow us, like the idea and leave a comment below!!

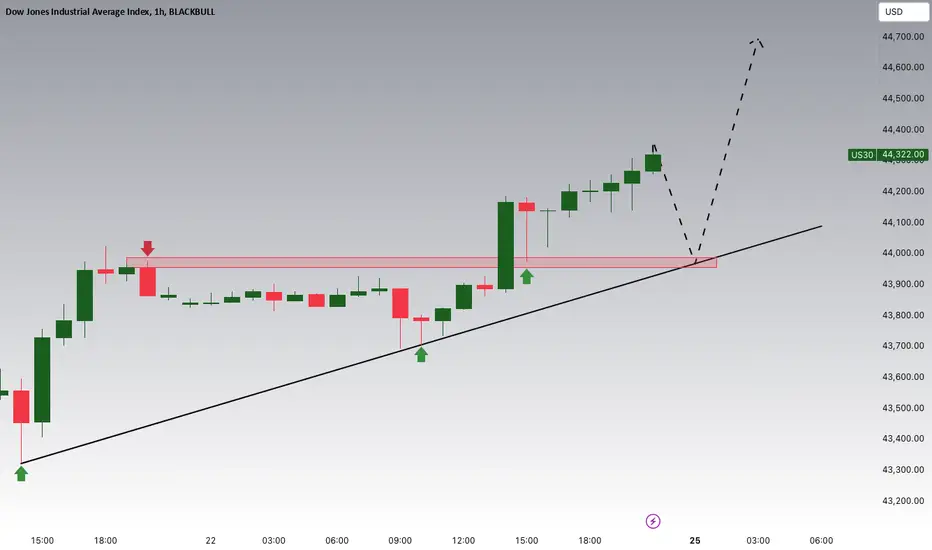
DOW JONES New High before any correction.Dow Jones / US30 is on a long term bullish pattern on a Rising Support that extends all the way from the August bottom.
The U.S. elections initiated the most recent rally that has now transitioned into a consolidation Channel Up.
Similar such patterns in the past gave one final High as long as the 4hour MA50 supported.
Buy and target 45365 (+2.50% rise)
Previous chart:
Follow us, like the idea and leave a comment below!!

DOW JONES: A few days of consolidation can push it to 46,100Dow Jones is almost overbought on its 1D technical outlook (RSI = 68.114, MACD = 449.010, ADX = 35.064) and is printing a sequence much like post September 20th. That was a consolidation Channel that paved the way to the next bullish wave on the 1.5 Fib extension. This is a 4 month Channel Up supported by the 1D MA50. As long as it does, aim for the 1.5 Fib (TP = 46,100).
See how our prior idea has worked out:
## If you like our free content follow our profile to get more daily ideas. ##
## Comments and likes are greatly appreciated. ##

DOW JONES is respecting our major August buy call beautifully.Dow Jones (DJI) is about to hit the 45000 Target on our last buy call (November 20, see chart below) and complete a +8.30% Bullish Leg rise within the Channel Up that started on the August 05 Low:
We are very pleased also to see the index making enormous progress after our big August buy (Aug 07 idea, see below) which was exactly on the last major Low of Dow:
As you can see, we successfully formulated that trade based on the extremely symmetric price action of 2016 - 2017. We've explained the notion on the previous idea, but we will refresh your memory if you read this analysis for the first time.
Dow was already trading within a Rising Wedge pattern in 2016, which towards its end broke upwards and first completed a +19.50% rally. The second Leg of the Bull rally was completed on a +30.70% rise from the pull-back Low and then the markets entered the multi-month volatile period of the U.S. - China trade wars. Key Lows of the Bull Rally were made in October 2016, April 2017 and the last in August 2017. It is important to note that after the August 2017 Low, the index had the most aggressive part of the rally, attached to the top band of the Bollinger Bands range, which is what we've called before "riding the BB wave".
Back to more recently and the Rising Wedge that started in 2022, it broke upwards in identical fashion as 2017 (first Leg +23.40%, Lows in October 2023, April 2024 and the most recent August 2024, which as you saw was our last major buy). Even the 1W RSI sequences between the two fractals are similar. What's left now is for Dow to complete a +30.70% rise from the August 2024 Low, in order to conclude the pattern from 2017.
Our long-term Target since August remains thus intact at 49000. Keep in mind that this is the essence of long-term investing/ trading and this is the strategy with the highest winning rate. Note also that if it takes the same time to conclude as the 2017 Leg did from the August 2017 Low (green Rectangle, 168 days), then the peak should be formed end of January/ early February 2025.
-------------------------------------------------------------------------------
** Please LIKE 👍, FOLLOW ✅, SHARE 🙌 and COMMENT ✍ if you enjoy this idea! Also share your ideas and charts in the comments section below! This is best way to keep it relevant, support us, keep the content here free and allow the idea to reach as many people as possible. **
-------------------------------------------------------------------------------
💸💸💸💸💸💸
👇 👇 👇 👇 👇 👇

DOW/US30 - HOW FAR DOES IT REACH THE CEILINGTeam, we have not been providing any trade signal since last week,
however, we did some scalping trade during the week,
but now we are looking the chart, and it is time to consider
We are shorting the DOW at 44860-44935, STOP LOSS at 45035
Target 1 at 44796-44806
target 2 at 44636-65
target 3 at 44336-52
Once the target 1 hits, take some partial and bring stop loss to BE.

Dow Jones Index (US30): Bullish Trend Continues
Dow Jones Index updated the all-time high yesterday.
The resistance area based on a previous high turns into support now.
We can expect a bullish trend continuation at least to 45000 - the next psychological resistance.
❤️Please, support my work with like, thank you!❤️

US30 H4 | Bullish ContinuationBased on the H4 chart analysis, we can see that the price is falling to our buy entry at 44,519.67, which is an overlap support.
Our take profit will be at 45,532.41, aligning with the 161.8% Fibo extension
The stop loss will be placed at 43,382.83, which is a pullback support level.
High Risk Investment Warning
Trading Forex/CFDs on margin carries a high level of risk and may not be suitable for all investors. Leverage can work against you.
Stratos Markets Limited (www.fxcm.com):
CFDs are complex instruments and come with a high risk of losing money rapidly due to leverage. 64% of retail investor accounts lose money when trading CFDs with this provider. You should consider whether you understand how CFDs work and whether you can afford to take the high risk of losing your money.
Stratos Europe Ltd, previously FXCM EU Ltd (www.fxcm.com):
CFDs are complex instruments and come with a high risk of losing money rapidly due to leverage. 66% of retail investor accounts lose money when trading CFDs with this provider. You should consider whether you understand how CFDs work and whether you can afford to take the high risk of losing your money.
Stratos Trading Pty. Limited (www.fxcm.com):
Trading FX/CFDs carries significant risks. FXCM AU (AFSL 309763), please read the Financial Services Guide, Product Disclosure Statement, Target Market Determination and Terms of Business at www.fxcm.com
Stratos Global LLC (www.fxcm.com):
Losses can exceed deposits.
Please be advised that the information presented on TradingView is provided to FXCM (‘Company’, ‘we’) by a third-party provider (‘TFA Global Pte Ltd’). Please be reminded that you are solely responsible for the trading decisions on your account. There is a very high degree of risk involved in trading. Any information and/or content is intended entirely for research, educational and informational purposes only and does not constitute investment or consultation advice or investment strategy. The information is not tailored to the investment needs of any specific person and therefore does not involve a consideration of any of the investment objectives, financial situation or needs of any viewer that may receive it. Kindly also note that past performance is not a reliable indicator of future results. Actual results may differ materially from those anticipated in forward-looking or past performance statements. We assume no liability as to the accuracy or completeness of any of the information and/or content provided herein and the Company cannot be held responsible for any omission, mistake nor for any loss or damage including without limitation to any loss of profit which may arise from reliance on any information supplied by TFA Global Pte Ltd.
The speaker(s) is neither an employee, agent nor representative of FXCM and is therefore acting independently. The opinions given are their own, constitute general market commentary, and do not constitute the opinion or advice of FXCM or any form of personal or investment advice. FXCM neither endorses nor guarantees offerings of third party speakers, nor is FXCM responsible for the content, veracity or opinions of third-party speakers, presenters or participants.

US30 Short IdeaWeekly Candle Closed as expected, High Sweep Previous Week, H4 Market Structure Shift, So I will Look for Short from FVG area. Target is November Low.
if You Are Following The Follow With Risk Management.

DowJones Sell Setup Currently Trading at 44535 , Sell For The target 38210
Looking Overbought , Start Selling It
Correction Till 38210 Possible

DOWJONS US30📝 Important ranges for this week have been drawn, you can trade them according to your personal strategy.
⏱ TIME:30M
📍If you like this kind of content, please leave a comment❤️

Dow Jones Is Approaching Important SupportHey Traders, in today's trading session we are monitoring US30 for a buying opportunity around 44,000 zone, Dow Jones is trading in an uptrend and currently is in a correction phase in which it is approaching the trend at 44,000 support and resistance area.
Trade safe, Joe.
US30 TODAYUS30 TODAY for me is very potential to move very big move UP
Look on Daily there is very strong bullish structure
On H4 and H1 i see first something to change to UP

What do DJI, SPX and NDX have in common?Well the obvious answer is that they are Major USA indices and they also share some of the big players as stocks which make up their composite Indices.
My answer the Question...
The beauty of Trading View is the ability to combine all sorts of aspects of trading information together, whether it be writing new scripts, combining indicators or in my case combing major indices together in Logarithmic view to get a new way of future price discovery (for SPX & NDX) by looking backwards or left at price structure on the next highest valued Indice.
As we know A.T.M all 3 Indices are at A.T.H's so at some point in the near future there will be a move higher into new price territory. The question then is where is the price target? Where is the next resistance level when there is no price structure to the left on that Indice?
What I noticed historically about these Indices is that past price structure (major highs and lows) from the higher valued Indice (Mostly DJI) is horizontally plotted forward into the future onto the lesser valued Indice. Like looking left historically at an instrument with a lot of data for support and resistance levels.
Obviously with DJI being the highest dollar value Indice and it also moving higher past its all time high at some point into unknown price territory, we will have to rely on its own price structure for support levels or Fibonacci levels for clues about were price will find resistance levels in the future.
On SPX and NDX though we have a different story. As these 2 Indices move higher into unknown price territory with no price structure of their own to the left looking back, we can use the past price structure of the higher dollar valued Indice (DJI) market highs and lows to assess future levels of resistance or to find future price targets.
With SPX we will be able to use NDX and also DJI to find future higher price targets and resistance.
With NDX we will be able to use DJI to find future higher price targets and resistance.
Some examples,
If you pull up these 3 indices on a line chart yourself you will find that with NDX and SPX the support levels for the Dotcom and GFC crash's were DJI's historical price structure levels from 1961-1981. $731-$965.
If you look at SPX the present high and previous equal high on 01/2022 you will find it is mirrored in price structure on NDX 2015-2016 period and that the 2000 Dotcom peak is acting as a support level $4380 for present SPX price structure. NDX 01/2022
If you go way back in time to the 1930's Great depression market crash you will find the Aug 1929 SPX high $32.50 was in fact a resistance level which became support level for DJI back in 1898 and 1903 respectively.
The major past Cycle Highs on the higher valued Indice prior to recession tend to be the resistance levels for for future highs on the lower valued Indices. Or resistance levels that were broken and became support on DJI became resistance dollar value levels for SPX and NDX.
It is obvious that vertically this 3 indices would show similar reactions to market shocks but I'm not quite sure why horizontally there are so many matching price support and resistance levels.
This is a Monthly Chart over a 130 year period so the levels are harder to see and not precisely dollar accurate but if you use a weekly or daily chart you will see the levels line up very well.
So, obviously in my head I'm wondering what the heck is happening here exactly?
Some of these older levels have played out over 50-60 years into the future on DJI to the SPX and NDX, more recently the time frame is reducing to around 10-20 years.
Fibonacci levels also work on this chart going from lowest value Indice at a recession low to next business cycle high on highest value Indice.
Maybe W.D Gann could explain this accurately for me....Like is there some sort of Fractal playing out here or do the Wall street crew already use this method or is it the madness of the crowd echoing forward through time unwittingly expressing human emotion into charts of financial greed and fear? Who knows? I'd like to hear Traders ideas about this phenomena.

DOW JONES bouncing on the 4H MA200 and 0.5 Fibonacci.Dow Jones (DJI) found Support yesterday exactly on its 4H MA200 (red trend-line), after just a brief break of the 0.5 Fibonacci retracement level. The dominant pattern has been a Channel Up since the August 05 Low and within it, every 0.5 Fib test from the previous Low, has been the most effective buy entry as it started the new Bullish Leg.
The technical symmetry within this pattern is astounding as every Bullish Leg hit its 1.236 Fibonacci extension, completing a +8.30% rise. The ROC Higher Lows indicates that a rebound should be expected right now.
We haven't had a 1.236 Fib extension since the elections Low, so naturally take this 4H MA200 / 0.5 Fib bounce to buy if you haven't and target 45000 (also +8.30% rise).
-------------------------------------------------------------------------------
** Please LIKE 👍, FOLLOW ✅, SHARE 🙌 and COMMENT ✍ if you enjoy this idea! Also share your ideas and charts in the comments section below! This is best way to keep it relevant, support us, keep the content here free and allow the idea to reach as many people as possible. **
-------------------------------------------------------------------------------
💸💸💸💸💸💸
👇 👇 👇 👇 👇 👇

DOW JONES: Bottom buy signal. Target 45,600.Dow Jones just turned neutral on its 1D technical outlook (RSI = 52.982, MACD = 339.670, ADX = 28.026) as it hit today the 4H MA200 after exactly 2 weeks. This is getting very close to the bottom of the 14 month Channel Up. Technically the last two HLs were formed when the 1D RSI double bottomed on the 30.00 oversold limit. Overall, this is a good enough buy opportunity to target yet another +6.80% bullish wave (TP = 45,600).
## If you like our free content follow our profile to get more daily ideas. ##
## Comments and likes are greatly appreciated. ##

US30 TODAYUS30 TODAY for me is still nice bearish.
At the moment looks like correct ABC
I waiting for setup
My view is on chart

DOW JONES inside a bearish wave. Expect lower prices.Dow Jones is trading inside a Channel Up since August.
However at the moment it is still on a bearish wave.
Three out of four bearish waves of this Channel Up hit the MA50 (1d) before reversing.
With the price rejected now on the MA50 (1h), this is still a sell opportunity.
Trading Plan:
1. Sell on the current market price.
Targets:
1. 43000.
Tips:
1. The RSI (1h) is also declining. Once it turns sideways, it will be the signal to reverse to buying.
Please like, follow and comment!!

Dow Jones H4 | Potential bearish breakoutDow Jones (US30) is falling towards a potential breakout level and could fall lower from here.
Sell entry is at 43,366.65 which is a potential breakout level.
Stop loss is at 43,570.00 which is a level that sits above an overlap resistance.
Take profit is at 42,967.23 which is a pullback support that aligns close to the 50.0% Fibonacci retracement level.
High Risk Investment Warning
Trading Forex/CFDs on margin carries a high level of risk and may not be suitable for all investors. Leverage can work against you.
Stratos Markets Limited (www.fxcm.com):
CFDs are complex instruments and come with a high risk of losing money rapidly due to leverage. 64% of retail investor accounts lose money when trading CFDs with this provider. You should consider whether you understand how CFDs work and whether you can afford to take the high risk of losing your money.
Stratos Europe Ltd (www.fxcm.com):
CFDs are complex instruments and come with a high risk of losing money rapidly due to leverage. 66% of retail investor accounts lose money when trading CFDs with this provider. You should consider whether you understand how CFDs work and whether you can afford to take the high risk of losing your money.
Stratos Trading Pty. Limited (www.fxcm.com):
Trading FX/CFDs carries significant risks. FXCM AU (AFSL 309763), please read the Financial Services Guide, Product Disclosure Statement, Target Market Determination and Terms of Business at www.fxcm.com
Stratos Global LLC (www.fxcm.com):
Losses can exceed deposits.
Please be advised that the information presented on TradingView is provided to FXCM (‘Company’, ‘we’) by a third-party provider (‘TFA Global Pte Ltd’). Please be reminded that you are solely responsible for the trading decisions on your account. There is a very high degree of risk involved in trading. Any information and/or content is intended entirely for research, educational and informational purposes only and does not constitute investment or consultation advice or investment strategy. The information is not tailored to the investment needs of any specific person and therefore does not involve a consideration of any of the investment objectives, financial situation or needs of any viewer that may receive it. Kindly also note that past performance is not a reliable indicator of future results. Actual results may differ materially from those anticipated in forward-looking or past performance statements. We assume no liability as to the accuracy or completeness of any of the information and/or content provided herein and the Company cannot be held responsible for any omission, mistake nor for any loss or damage including without limitation to any loss of profit which may arise from reliance on any information supplied by TFA Global Pte Ltd.
The speaker(s) is neither an employee, agent nor representative of FXCM and is therefore acting independently. The opinions given are their own, constitute general market commentary, and do not constitute the opinion or advice of FXCM or any form of personal or investment advice. FXCM neither endorses nor guarantees offerings of third-party speakers, nor is FXCM responsible for the content, veracity or opinions of third-party speakers, presenters or participants.

Weekly Forex Forecast Nov. 18 - 22: SP500, NAS, DOW, GOLDThis is the Weekly Forex Forecast for Nov 18 -22nd.
The Big 3 Indexes started to pullback last week from there elections fueled rallies. Patience is required, as we look for confirmations of a market shift from bullish to bearish.
Gold also retraced last week, and may may struggle against a surging USD. Patience here will benefit traders, as we wait until the market tips its hand.
Check the comments section below for updates regarding this analysis throughout the week.
Enjoy!
May profits be upon you.
Leave any questions or comments in the comment section.
I appreciate any feedback from my viewers!
Like and/or subscribe if you want more accurate analysis.
Thank you so much!
Disclaimer:
I do not provide personal investment advice and I am not a qualified licensed investment advisor.
All information found here, including any ideas, opinions, views, predictions, forecasts, commentaries, suggestions, expressed or implied herein, are for informational, entertainment or educational purposes only and should not be construed as personal investment advice. While the information provided is believed to be accurate, it may include errors or inaccuracies.
I will not and cannot be held liable for any actions you take as a result of anything you read here.
Conduct your own due diligence, or consult a licensed financial advisor or broker before making any and all investment decisions. Any investments, trades, speculations, or decisions made on the basis of any information found on this channel, expressed or implied herein, are committed at your own risk, financial or otherwise.

DOW JONES INDEX (US30): Best Supports For Buying
US30 finally retraced after a strong bullish rally.
Here are the significant supports from where we can
look for trend-following buying opportunities.
❤️Please, support my work with like, thank you!❤️
