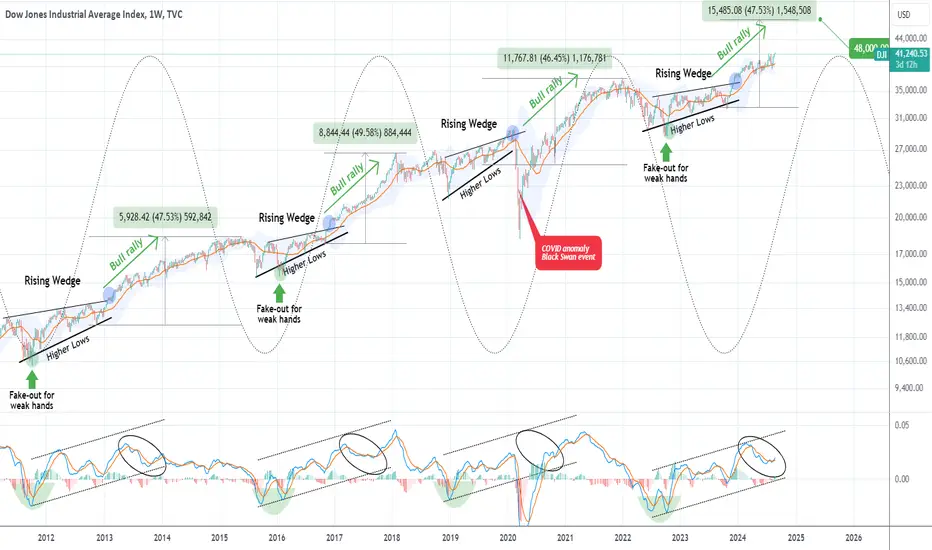
DOW JONES The pattern that never failed is now targeting 48000Dow Jones (DJI) gave us the best bullish break-out signal of the year 8 months ago (December 13 2023, see chart below), as our buy entry at 36577 is very close to hitting our 42900 Target:
At that time we made a clear point why that rally 'shouldn't surprise you' and now you see why. This 1W time-frame chart shows the cyclical behavior of the index, which peaks (Sine Wave top) then pulls back and starts forming a Rising Wedge (Sine Wave bottom) and when it breaks above the Rising Wedge, is where it flashed the bullish break-out signal we got back in December.
As you can see it then starts a gradual rise on the BB20 and completes the Cycle again (Sine Wave top) after roughly a +47% rally. The title mentions that this pattern 'never failed', in practice it only broke during the COVID flash crash, which is a non-technical event than occurs once every 100 years. As you can see even the 1W MACD sequences between the cyclical patterns are identical.
As a result, our Target towards the Sine Wave peak is 48000.
-------------------------------------------------------------------------------
** Please LIKE 👍, FOLLOW ✅, SHARE 🙌 and COMMENT ✍ if you enjoy this idea! Also share your ideas and charts in the comments section below! This is best way to keep it relevant, support us, keep the content here free and allow the idea to reach as many people as possible. **
-------------------------------------------------------------------------------
💸💸💸💸💸💸
👇 👇 👇 👇 👇 👇
Dowjones
Why the 'record high' on Dow Jones underwhelms...Another day, another record high for a US stock market. Only the one seen on the Dow Jones underwhelms given it is not backed up by its own futures market, let alone its peers. We're also approaching end-of-month flows (which can prompt fickle price action). And keep an eye on the Nvidia earnings report on Wednesday (US) which can single-handedly drive sentiment on Wall Street.

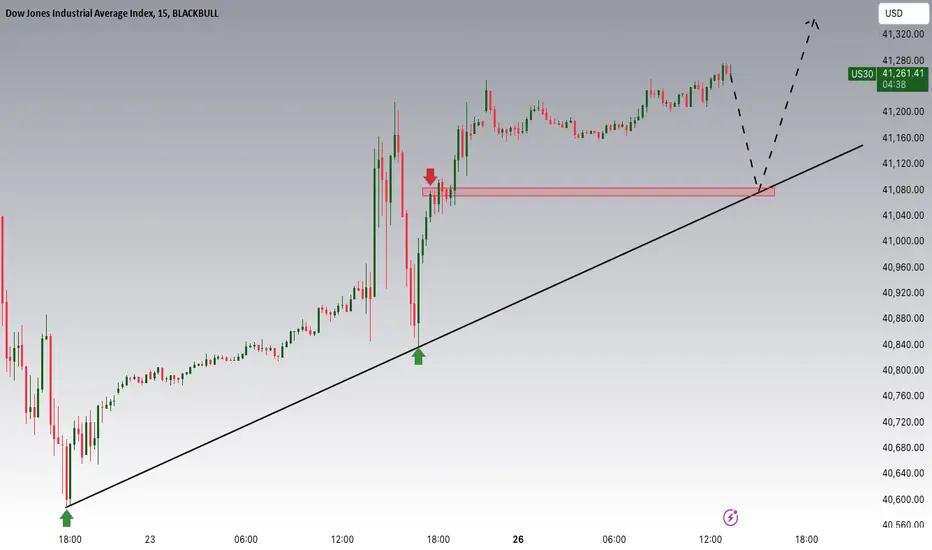
Dow Jones Potential UpsidesHey Traders, in today's trading session we are monitoring US30 for a buying opportunity around 41000 zone, Dow Jones is trading in an uptrend and currently is in a correction phase in which it is approaching the trend at 41000 support and resistance area.
Trade safe, Joe.
XAU/USD : Key Levels and Trading Strategies to WatchBy reviewing the #Gold chart on the 2-hour timeframe, we can see that today the price climbed to higher levels, reaching the $2525 range. Currently, there has been an initial reaction to this supply zone. The price is close to its historical high of $2531, and we need to see if it will stabilize below $2520 or above $2527 in the next 4 hours. Day traders will need more confirmation before taking a SELL position, while scalpers can look for suitable SELL triggers within the $2527 to $2532 range, managing risk carefully and taking quick profits. My medium-term outlook on gold remains bullish, and I expect to see the price reaching $2550 and $2600 soon.
Please support me with your likes and comments to motivate me to share more analysis with you and share your opinion about the possible trend of this chart with me !
Best Regards , Arman Shaban
((2+4+7+13+15+18+26+36+38+69+87+101+183+209+1000+1002+1000000000+1000000001+ 1000000853)^♾️*69) + 1 !

DOWJOANSDow Jones 4-hour time frame analysis
It can move up to 44000 in case of breaking the zone ceiling.

DJI - Key Resistance Zone 4 HourDJI has entered a key resistance zone of the 4 HOUR time frame.
There are 3 likely scenarios. A,B,C on the chart.
We are waiting for a definitive move on the charts, we are looking for a BREAKOUT, either BIG VOLUME breaking the resistance level, or a REJECTION of the resistance level, followed by great volume.
The third move that could be made is ACCUMULATION / RANGING. Where there is little to no volume with no definitive move, we will NOT ENTER if this is the case.

Dow Jones Index (US30): New All Time High Soon?!
US30 may update the all time high soon.
The market closed, testing a major daily structure resistance
based on a current all time high.
A bullish breakout of the underlined blue area will give us a strong bullish signal.
A bullish continuation will be expected at least to 42000.
❤️Please, support my work with like, thank you!❤️

OHLC Statistical Mapping Setup+Manipulation to +Distribution when bullish, this is the most simple model with this indicator!

Dow30 - US30 Faces DownturnBLACKBULL:US30 has returned to a crucial resistance zone, which aligns with a bearish technical setup. After the recent decline, this move back to the resistance suggests that a further drop may be imminent, especially if the index fails to break above this zone. The pattern indicates that TVC:DJI could start its downward trend again following a retest of this level, where sellers are likely to re-enter the market.
Fundamentally, the rising unemployment claims in the U.S. have heightened fears of a recession. With more individuals out of work, consumer spending could slow down, which negatively impacts corporate earnings and the broader economy. This situation could exert additional downward pressure on the Dow Jones, making the possibility of a significant decline more likely as investors brace for potential economic contraction.

US30Dow Jones 4-hour time frame analysis
I expect the price to start correcting from this area until the swap zone is determined.
By seeing confirmation in these areas, we can expect price correction.

The Future is UP and Gone.This is obviousness. The future is MOON and DOOM. '
2029 is the biggening of the end... hyperinflation and riots. And collapse of our American society. And the USA dollar.. The 2028 elections will be devastating. And will be last elections.

DOW JONES Don't lose sight of the great picture. Still bullish.Last week, while Dow Jones (DJI) was still under its 1D MA50, we called for a major rally, as technically the 5-month Channel Up has just priced its new Higher Low:
The index has now almost reached the Target of the first Bullish Leg of this pattern, pointing to a potential relief next.
On the larger picture however (1M time-frame), we had posted an article named 'Secret Cycles' on April 12 2024 (see chart below), during Dow Jones' previous pull-back that again inflicted fear in the markets, calling for a strong buy:
It is this chart that we revisit and expand up today, as we don't think the long-term trend has changed. We want to maintain a clear long-term perspective and following August's massive recovery 1M candle, we believe that Dow will enter by Q4 2024, the final stage (rally) of its current Cycle.
That has historically been 1 year at least, so as long as the index keeps holding and closing the monthly candles above the 1M MA50 (red trend-line), we will continue buying all monthly dips. Our 48850 long-term Target is intact.
-------------------------------------------------------------------------------
** Please LIKE 👍, FOLLOW ✅, SHARE 🙌 and COMMENT ✍ if you enjoy this idea! Also share your ideas and charts in the comments section below! This is best way to keep it relevant, support us, keep the content here free and allow the idea to reach as many people as possible. **
-------------------------------------------------------------------------------
💸💸💸💸💸💸
👇 👇 👇 👇 👇 👇

Resistance is ahead! Can the Dow Jones make a break through?
The index is clearly demonstrating a strong upward trend, consistently achieving higher highs and higher lows.
During this upward movement, it previously established a bullish Pole & Flag pattern, and after breaking out, the index has continued to rise.
At present, the index is trading just beneath its next resistance level.
If the Dow Jones manage to break through and hold above this breakout point, it is likely to initiate a new rally.

Additional rebound in US30 remains possible
US30 is showing a continuous uptrend as expectations for the US economy arise, along with the anticipation that Chairman Powell may provide clues about rate cuts at the Jackson Hole meeting. Goldman Sachs lowered its 12-month recession probability for the US economy from 25% to 20% following the release of July retail sales and jobless claims data.
The current market consensus is that the August employment report will determine future US30 price movements. Morgan Stanley stressed that the report's outcome will be the real test for the market, warning that a report showing weak employment would reignite growth concerns.
US30 quickly breached EMAs and continued its uptrend, rising above the trendline. The index needs an additional price trigger to retest its highs, but the current positive trend is expected to continue for the time being.
If US30 sustains support above the trendline, the index may gain upward momentum toward the 41500 high. Conversely, if US30 is pushed below the trendline and fails to hold above EMAs, the price may break the 39300 support and fall further to the 38000 level.

Hellena | DJI (4H): Long to resistance area 41000.Dear Colleagues, because the big wave “4” (38549) has completed, now I believe that the price is in wave “5”. This means that the price probably has not yet completed the upward movement. I expect a small correction, then a continuation of the upward movement at least to the 40900-41000 area.
Manage your capital correctly and competently! Only enter trades based on reliable patterns!

US30 TRADE IDEAUS30 still showing strong bullish momentum with a break above resistence followed by a retest while continuing to respect structure. A strong entry confirmation from the engulfing candlestick

XAU/USD: Gold Will Fall ? Let's See (READ THE CAPTION)By reviewing the latest #Gold chart on the 6-hour timeframe, we can see that the price has dropped over 230 pips since last night, and as expected, we're starting to see the first signs of a price reversal on the chart! A large Fair Value Gap (FVG) between $2465 and $2486 was created on Friday with the price surge, and I expect this gap to be filled soon. Keep a close eye on how the price reacts to the levels of $2486, $2480, $2473, $2468, and $2463.3.
Please support me with your likes and comments to motivate me to share more analysis with you and share your opinion about the possible trend of this chart with me !
Best Regards , Arman Shaban
((2+4+7+13+15+18+26+36+38+69+87+101+183+209+1000+1002+1000000000+1000000001+ 1000000853)^♾️*69) + 1 !

Determining Which Equity Index Futures to Trade: ES, NQ, YM, RTYWhen it comes to trading equity index futures, traders have a variety of options, each with its own unique characteristics. The four major players in this space—E-mini S&P 500 (ES), E-mini Nasdaq-100 (NQ), E-mini Dow Jones (YM), and E-mini Russell 2000 (RTY)—offer different advantages depending on your trading goals and risk tolerance. In this article, we’ll dive deep into the contract specifications of each index, explore their volatility using the Average True Range (ATR) on a daily timeframe, and discuss how these factors influence trading strategies.
1. Contract Specifications: Understanding the Basics
Each equity index future has specific contract specifications that are crucial for traders to understand. These details affect not only how the contracts are traded but also the potential risks and rewards involved.
E-mini S&P 500 (ES):
Contract Size: $50 times the S&P 500 Index.
Tick Size: 0.25 index points, equivalent to $12.50 per contract.
Trading Hours: Nearly 24 hours with key sessions during the U.S. trading hours.
Margin Requirements: Change through time given volatility conditions and perceived risk. Currently recommended as $13,800 per contract.
E-mini Nasdaq-100 (NQ):
Contract Size: $20 times the Nasdaq-100 Index.
Tick Size: 0.25 index points, worth $5 per contract.
Trading Hours: Similar to ES, with continuous trading almost 24 hours a day.
Margin Requirements: Higher due to its volatility and the tech-heavy nature of the index. Currently recommended as $21,000 per contract.
E-mini Dow Jones (YM):
Contract Size: $5 times the Dow Jones Industrial Average Index.
Tick Size: 1 index point, equating to $5 per contract.
Trading Hours: Nearly 24-hour trading, with peak activity during U.S. market hours.
Margin Requirements: Relatively lower, making it suitable for conservative traders. Currently recommended as $9,800 per contract.
E-mini Russell 2000 (RTY):
Contract Size: $50 times the Russell 2000 Index.
Tick Size: 0.1 index points, valued at $5 per contract.
Trading Hours: Continuous trading available, with key movements during U.S. hours.
Margin Requirements: Moderate, with significant price movements due to its focus on small-cap stocks. Currently recommended as $7,200 per contract.
Understanding these specifications helps traders align their trading strategies with the right market, considering factors such as account size, risk tolerance, and market exposure.
2. Applying ATR to Assess Volatility: A Key to Risk Management
Volatility is a critical factor in futures trading as it directly impacts the potential risk and reward of any trade. The Average True Range (ATR) is a popular technical indicator that measures market volatility by calculating the average range of price movements over a specified period.
In this analysis, we apply the ATR on a daily timeframe for each of the four indices—ES, NQ, YM, and RTY—to compare their volatility levels:
E-mini S&P 500 (ES): Typically exhibits moderate volatility, offering a balanced approach between risk and reward. Ideal for traders who prefer steady market movements.
E-mini Nasdaq-100 (NQ): Known for higher volatility, driven by the tech sector's dynamic nature. Offers larger price swings, which can lead to greater profit potential but also increased risk.
E-mini Dow Jones (YM): Generally shows lower volatility, reflecting the stability of the large-cap stocks in the Dow Jones Industrial Average. Suitable for traders seeking less risky and more predictable price movements.
E-mini Russell 2000 (RTY): Exhibits considerable volatility, as it focuses on small-cap stocks. This makes it attractive for traders looking to capitalize on significant price movements within shorter time frames.
By comparing the changing ATR values, traders can gain insights into which index futures offer the best fit for their trading style—whether they seek aggressive trading opportunities in high-volatility markets like NQ and RTY or more stable conditions in ES and YM.
3. Volatility and Trading Strategy: Matching Markets to Trader Preferences
The relationship between volatility and trading strategy cannot be overstated. High volatility markets like NQ and RTY can provide traders with larger potential profits, but they also require more robust risk management techniques. Conversely, markets like ES and YM may offer lower volatility and, therefore, smaller profit margins but with reduced risk.
Here’s how traders might consider using these indices based on their ATR readings:
Aggressive Traders: Those who thrive on high-risk, high-reward scenarios might prefer NQ or RTY due to their larger price fluctuations. These traders are typically well-versed in managing rapid market movements and can exploit the volatility to achieve significant gains.
Conservative Traders: If stability and consistent returns are more important, ES and YM are likely better suited. These indices provide a more predictable trading environment, allowing for smoother trade execution and potentially fewer surprises in market behavior.
Regardless of your trading style, the key takeaway is to align your strategy with the market conditions. Understanding how each index's volatility affects your potential risk and reward is essential for long-term success in futures trading.
4. Conclusion: Making Informed Trading Decisions
Choosing the right equity index futures to trade goes beyond personal preference. It requires a thorough understanding of contract specifications, an assessment of market volatility, and how these factors align with your trading objectives. Whether you opt for the balanced approach of ES, the tech-driven dynamics of NQ, the stability of YM, or the volatility of RTY, each market presents unique opportunities and challenges.
By leveraging tools like ATR and staying informed about the specific characteristics of each index, traders can make more strategic decisions and optimize their risk-to-reward ratio.
When charting futures, the data provided could be delayed. Traders working with the ticker symbols discussed in this idea may prefer to use CME Group real-time data plan on TradingView: www.tradingview.com This consideration is particularly important for shorter-term traders, whereas it may be less critical for those focused on longer-term trading strategies.
General Disclaimer:
The trade ideas presented herein are solely for illustrative purposes forming a part of a case study intended to demonstrate key principles in risk management within the context of the specific market scenarios discussed. These ideas are not to be interpreted as investment recommendations or financial advice. They do not endorse or promote any specific trading strategies, financial products, or services. The information provided is based on data believed to be reliable; however, its accuracy or completeness cannot be guaranteed. Trading in financial markets involves risks, including the potential loss of principal. Each individual should conduct their own research and consult with professional financial advisors before making any investment decisions. The author or publisher of this content bears no responsibility for any actions taken based on the information provided or for any resultant financial or other losses.

US30 Bearish Bias!US30 has almost reached
The supply cluster of the
Falling and horizontal levels
So a move down is to be
Expected towards the
Target of 39411.7

Dow jones Potential UpsidesHey Traders, in tomorrow's trading session we are monitoring US30 for a buying opportunity around 40050 zone, Dow Jones is trading in an uptrend and currently is in a correction phase in which it is approaching the trend at 40050 support and resistance area.
Trade safe, Joe.

Combined US Equities Since the last heads up analysis before the bearish pullback, some more new developments came into play, particularly how the equity market turned bullish...
1. Heads up given for RISK ON in the green ellipse. The weekly chart is actually very obvious with a long tail candlestick;
2. The latter part of that week finished with a combination of a long bullish candle, breaking and closing above a resistance trendline;
3. Then continued by another breakout of a range; and
4. This week closed with another colid bullish candle that closed the gap resistance, with another bullish candle to boot.
5. MACD and VolDiv indicators are bullish since the early part of the week.
Can easily expect a revisit to the last high of 906.50, but not before a retest of the gap support.

$IBM Support Levels HoldingNYSE:IBM did not have a great earnings report for the 1st Quarter 2024, but 2nd quarter improved. The stock has one of the better charts in the Dow 30 components. It has held up better than most of the Dow components, except for those stocks that are in buyback mode. It has been tapering off its buybacks for 2 quarters. So the gains holding above the support lows are not from buybacks. There are accumulation patterns and pro trader activity in the mix. One to watch for swing trading potential.

SHORT NASDAQ BEFORE WEEKEND..
I just open short position in Nasdaq, the reason is 2:
1) Price is now at the very strong zone: supply zone & fibo level
2) The rally for past several days is not backed up by volume, so i don't believe it's a strong uptrend, but a correction/ consolidation.
Let's go.. CHEERS!
