Dowjones Is Approaching The Daily TrendHey Traders, in today's trading session we are monitoring US30 for a buying opportunity around 38400 zone, US30 is trading in an uptrend and currently is in a correction phase in which it is approaching the trend at 38400 support and resistance area.
Trade safe, Joe.
Dowjones

Dow Jones Index (US30): One More Bearish Setup
I also see a bearish trend following setup on Dow Jones.
After yesterday's selloff, the market started a correctional movement.
On an hourly time frame, the market found a resistance around 39100 level
and formed a double top on that.
I think that the Index may drop at least to 38655 level.
❤️Please, support my work with like, thank you!❤️

US30 DailyPrice is nearing the 20-week moving average, a key support/resistance level. Historically, this MA has influenced significant reversals or trend continuations. Watch for potential bullish bounce or bearish rejection upon contact.

Dowjones updateDue to linked analysis dowjones fell as a waterfall.
be careful about BUY in Dowjones, dax, s&p500, Nasdaq and ...
The Polar bear (dowjones) will continue to fall the summit.
comment your desired analysis.
good luck

Bought calls near end of day in $DIAWe closed above daily anchored vwap late on Friday afternoon in AMEX:DIA so I did buy calls with a target towards 404
Will manage the position Monday morning

DOW JONES INDEX (US30): Oversold Market & Pullback
I think that Dow Jones may pullback on Monday.
The Index became heavily oversold after the release
of US unemployment data on Friday.
The price formed a double bottom pattern on an hourly time frame
and violated its neckline.
I suppose that the price may bounce to 39800
❤️Please, support my work with like, thank you!❤️

OHLC Statistical Mapping <3Played out beautifuly, the second scenario where opposing manipulation turns to resistance from support. target was simply -distribution.

Do you think we might see a fall in the US30?
By closing a one-hour candle below the entry point (orange line), we can see a drop.
I think the target points can be much more than these. We will move forward together step by step.
If you like my analysis, follow me

DowJones Polar Bear!!According to the linked previous analysis, price touched specified range and the shadow was as expected (a little more than expected) and then the Bearish trend started.
I see #dowjones as a wild polar BEAR.
Bearish trend will continue with swings and corrections.
will be updated...

Hellena | DJI (4H): Long to resistance area 41680 (Wave 5).Dear Colleagues, I believe that the price is still in an upward movement. At the moment, the higher order wave “4” is finishing forming. Either it has finished forming, or it will renew the minimum in the support area of 40071. After that I expect the continuation of the movement in the wave of higher order “5”. So I expect the price at the level of the maximum of the wave “3” 41680.
Manage your capital correctly and competently! Only enter trades based on reliable patterns!

US30 BuyTrade Plan:
Entry Level(Buy Limit): 40836.86
Stop Loss Level: 40300.00
Take Profit Level 1: 41344.00
Take Profit Level 2: 41910.58
Reasons for bullish bias:
- Simple DOW theory
- No divergence
- Entry at trendline plus 0.5 Fib level

YM OHLC Stat Map <3-Manipulation was broken and turned from resistance to support, target was simply +distribution because I was bullish

Expect an upward correction for the Dow JonesIt seems that we have an upward correction ahead for the Dow Jones index. This rise can occur from the current areas or a little lower and from the overlapping range of the previously broken ceiling in the daily time frame and EMA20 of the same time frame. The purpose of this rise of the Dow Jones index can be the purple box in the first step. And in the final step up to about 41,000

US30 Outlook ICT ConceptsDow Jones Industrial Average (US30) Analysis
💰 Welcome to Your Channel!
Welcome to our channel where we delve into the intricacies of financial markets. Today, we focus on US30, dissecting its current price action to uncover strategic trading opportunities. Join us as we analyze key levels and market dynamics, aiming to refine our trading strategies and maximize potential gains.
💡 Previous Analysis Review:
The price has swept the previous month high (PMH) and the buy-side liquidity (BSL) above it, placing it in a deep premium.
📍 Current Market Overview:
The current price is around 40,920.69. The price has swept the previous week low (PWL) and tapped into the 4-hour Fair Value Gap (FVG).
🔍 Identifying Key Levels:
• PMH: Previous Month High
• PWL: Previous Week Low
• PWH: Previous Week High
• PML: Previous Month Low
• BSL: Buy-Side Liquidity
• SSL: Sell-Side Liquidity
• EQH: Equal Highs
• EQL: Equal Lows
• FVG: Fair Value Gap, highlighting areas of imbalance
📊 Key Considerations:
• Current Price Position: The price is trading around 40,920.69, after sweeping the PMH and BSL, and now in a deep premium.
• PWL and 4H FVG Interaction: The price has swept the PWL and tapped into the 4H FVG, also aligning with the Optimal Trade Entry (OTE) levels.
• OTE Levels: The current price is within the OTE levels, suggesting a potential lower movement.
📈 Bearish Scenario:
Given the current price action and key considerations, a bearish scenario is possible if the following conditions are met:
Target SSL and FVG Below: The price can be expected to go lower from here, targeting the SSL and the FVG below it, or even the PWL, which is close to the equilibrium (50%) of the range.
📉 Bullish Scenario:
A bullish scenario should be considered if the following conditions are met:
Clearing Sell-Side Liquidity: For any bullish scenario and long positions, we need the sell side of the chart to be cleared from liquidity. Once the liquidity is cleared, we can then decide on potential long positions.
📊 Chart Analysis Summary:
Bearish Expectation: The expectation is for the price to potentially move lower, targeting the SSL and the FVG below it, or even the PWL, which is close to the equilibrium (50%) of the range.
Bullish Expectation: For a bullish scenario, we need the sell side of the chart to be cleared from liquidity. After the liquidity is cleared, we can consider long positions.
🙏 Thank you for joining us!
Exploring US30 today highlighted the importance of effective risk management in trading success. Prioritize research, implement robust strategies, and seek guidance for confident market navigation. Stay tuned for more insights on our channel. Here's to profitable trading and continuous learning!
⚠️ Disclaimer
The information provided here is for educational purposes only and should not be taken as financial advice. Always conduct your own research and consult a licensed financial advisor before making any investment decisions.

Dow Jones Index (US30): Intraday Bullish Signal?!
Update for the yesterday's setup on US30.
Earlier, we spotted a confirmed breakout of a key daily resistance.
After that, the market retested the broken structure and started to
consolidate within a narrow range on a 4H time frame.
The resistance of the range was broken this morning.
It is a strong intraday bullish signal.
Growth may continue to 21250
❤️Please, support my work with like, thank you!❤️

DOW JONES - NEW BREAKOUT !Hello Traders !
On the daily time frame, The DOW JONES reached a strong support level (39765.00 - 40094.00) and failed to break it !
The last lower high is broken (Change of Character).
So, I expect a bullish move 🚀
______________
TARGET: 41250.00🎯

Dow Jones - The Next Bull Run Is ImminentThe time has come: the next bull run in the Dow is about to begin.
The reasons for our bullish assessment can be found in the notes in the chart.

D JonesDowjones broke above flag n pole pattern on an hourly charts & consistently trading above it.
Could be bought with mentioned stoploss & targets.

Elliott Wave Analysis: Dow Futures (YM) Resumes Bullish TrendShort Term Elliott Wave View in E-Mini Dow Jones Futures (YM) suggests the trend should continue higher within the sequence started from April-2024 low as the part of daily sequence. It favors upside in wave 5 of (5) since 18-April, 2024 low, while dips remain above 40053 low. Since April-2024 low of (4), it placed 1 at 40213 high, 2 at 38111 low as dip pullback and 3 at 41672 high. It ended 4 as clear 3 swing zigzag pullback at 40053 low and favors upside in 5, which confirms above 41672 high to avoid any double correction, if breaks below 40053 low. Within 4 correction, it placed ((a)) at 40466 low, ((b)) at 40795 high and ((c)) at 40053 low, which missed the equal leg areas in 4 before resume higher.
Above 4 low, it placed ((i)) of 5 at 41051 high and favors corrective pullback in ((ii)), which should remain above 40053 low to extend higher in ((iii)). Within ((i)), it placed (i) at 40685 high, (ii) at 40158 low, (iii) at 41029 high, (iv) at 40863 low and finally (v) at 41051 high as ((i)). It placed (a) of ((ii)) at 40606 low and favors bounce in (b) before turning lower in (c) to finish ((ii)). As long as it stays above 40053 low, it should resume higher in 5 and can extend towards 42052 – 42671 area to finish the impulse started from April-2024 low before correcting lower. Alternatively, if it breaks below 40053 low, it can do double correction towards 39432 or lower levels before it should turn higher.

US30 H4 | Bearish Drop Based on the H4 chart analysis, we can see that the price has just reacted off our sell entry at 40,847.13, which is an overlap resistance close to 61.8% Fibo retracement.
Our take profit will be at 40,150.54, an overlap support level.
The stop loss will be placed at 41,362.20, which is a swing-high resistance level.
High Risk Investment Warning
Trading Forex/CFDs on margin carries a high level of risk and may not be suitable for all investors. Leverage can work against you.
Stratos Markets Limited (www.fxcm.com):
CFDs are complex instruments and come with a high risk of losing money rapidly due to leverage. 68% of retail investor accounts lose money when trading CFDs with this provider. You should consider whether you understand how CFDs work and whether you can afford to take the high risk of losing your money.
Stratos Europe Ltd, previously FXCM EU Ltd (www.fxcm.com):
CFDs are complex instruments and come with a high risk of losing money rapidly due to leverage. 73% of retail investor accounts lose money when trading CFDs with this provider. You should consider whether you understand how CFDs work and whether you can afford to take the high risk of losing your money.
Stratos Trading Pty. Limited (www.fxcm.com):
Trading FX/CFDs carries significant risks. FXCM AU (AFSL 309763), please read the Financial Services Guide, Product Disclosure Statement, Target Market Determination and Terms of Business at www.fxcm.com
Stratos Global LLC (www.fxcm.com):
Losses can exceed deposits.
Please be advised that the information presented on TradingView is provided to FXCM (‘Company’, ‘we’) by a third-party provider (‘TFA Global Pte Ltd’). Please be reminded that you are solely responsible for the trading decisions on your account. There is a very high degree of risk involved in trading. Any information and/or content is intended entirely for research, educational and informational purposes only and does not constitute investment or consultation advice or investment strategy. The information is not tailored to the investment needs of any specific person and therefore does not involve a consideration of any of the investment objectives, financial situation or needs of any viewer that may receive it. Kindly also note that past performance is not a reliable indicator of future results. Actual results may differ materially from those anticipated in forward-looking or past performance statements. We assume no liability as to the accuracy or completeness of any of the information and/or content provided herein and the Company cannot be held responsible for any omission, mistake nor for any loss or damage including without limitation to any loss of profit which may arise from reliance on any information supplied by TFA Global Pte Ltd.
The speaker(s) is neither an employee, agent nor representative of FXCM and is therefore acting independently. The opinions given are their own, constitute general market commentary, and do not constitute the opinion or advice of FXCM or any form of personal or investment advice. FXCM neither endorses nor guarantees offerings of third party speakers, nor is FXCM responsible for the content, veracity or opinions of third-party speakers, presenters or participants.

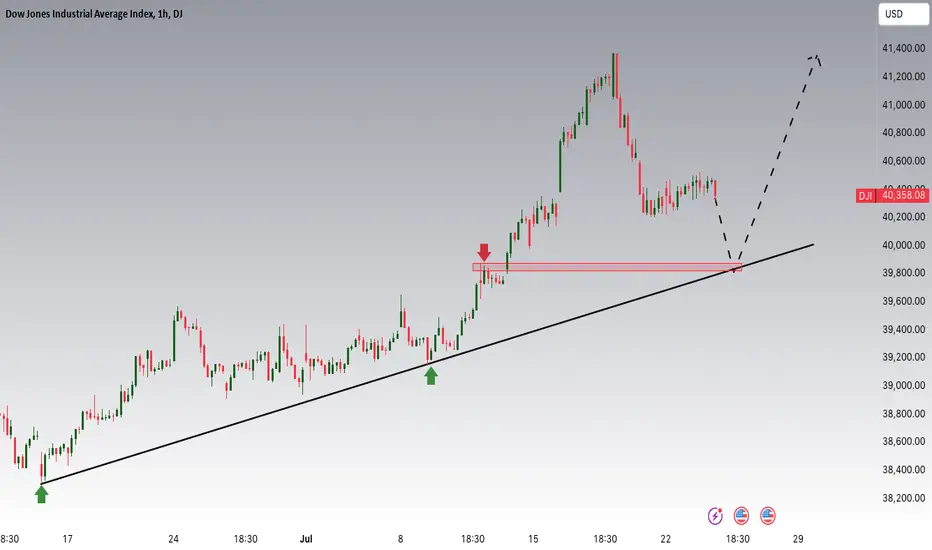
US30 Is Approaching The Main TrendHey Traders, in today's trading session we are monitoring US30 for a buying opportunity around 39800 zone, US30 is trading in an uptrend and currently is in a correction phase in which it is approaching the trend at 39800 support and resistance area.
Trade safe, Joe.
DOWJONES RoadmapHi, this is roadmap of dow jones that describe that price can raise t ~ 41016 which can touch
~41120 by shadow. after that the price will prepare for bearish trend and create a very nice trigger area for short position by an excellent R/R.
GOOD LUCK

Risk tolerance is increasing in the market
By examining the trend in the daily time frame, the Dow Jones index, having an important support interval in the range of 40348-40078, can increase up to the resistance of the previous ceiling in the range of 41360.
