DOW JONES Correction isn't over yet. See where to buy.The Dow Jones Industrial Average Index (DJIA) made initially a direct hit on our July 05 (see 1st chart below) 41000 Target and following the rejection then, is on its way of hitting the 39200 downside Target (July 17, 2nd chart below) as well:
Zooming out to the long-term pattern again after a while, we can still see that the dominant technical structure is a Channel Up that first started on the September 30 2022 inflation crisis bottom.
On the more medium-term, we can isolate a (dashed) Channel Up that started on the April 19 2024 Low. It appears that the current correction is technically its new Bearish Leg. Symmetrically, we should be expecting the new Higher Low to make contact with the 1D MA50 (blue trend-line). That is our first buy entry.
The second is just below the 0.5 Fibonacci Channel level, which can potentially make near contact with the 1D MA200 (orange trend-line), a strong long-term Support. That scenario is drawn based on the October 27 2023 bottom which was after a symmetrical correction (-9.25%) with the March 20 2023 bottom. Similarly, the current Bearish Leg could be symmetrical (-6.84%) with the correction that led to the April 18 2024 Low.
For both buy entries, our new long-term Target will be 42400 (Higher High on the medium-term Channel Up).
-------------------------------------------------------------------------------
** Please LIKE 👍, FOLLOW ✅, SHARE 🙌 and COMMENT ✍ if you enjoy this idea! Also share your ideas and charts in the comments section below! This is best way to keep it relevant, support us, keep the content here free and allow the idea to reach as many people as possible. **
-------------------------------------------------------------------------------
💸💸💸💸💸💸
👇 👇 👇 👇 👇 👇
Dowjones

US500 / S&P 500 Money Heist Plan in Bearish sideMy Dear Robbers / Traders,
This is our master plan to Heist US500 / S&P 500 Market based on Thief Trading style Technical Analysis.. kindly please follow the plan I have mentioned in the chart focus on Short entry. Our target is Green Zone that is High risk Dangerous level, market is oversold / Consolidation / Trend Reversal at the level Bullish Robbers / Traders gain the strength. Be safe and be careful and Be rich.
Note: If you've got a lot of money you can get out right away otherwise you can join with a swing trade robbers and continue the heist plan, Use Trailing SL to protect our money.
Stop Loss : Recent Swing High using 2h timeframe
Warning : Fundamental Analysis comes against our robbery plan. our plan will be ruined smash the Stop Loss. Don't Enter the market at the news update.
Loot and escape on the target 🎯 Swing Traders Plz Book the partial sum of money and wait for next breakout of dynamic level / Order block, Once it is cleared we can continue our heist plan to next new target.
Support our Robbery plan we can easily make money & take money 💰💵 Follow, Like & Share with your friends and Lovers. Make our Robbery Team Very Strong Join Ur hands with US. Loot Everything in this market everyday make money easily with Thief Trading Style.

WEEKLY FOREX FORECAST July 22-26th: OIL INDICES GOLD SILVERThis is Part 1 of the Weekly Forex Forecast JuLY 22 - 26th
In this video, we will cover:
S&P500 NASDAQ DOW GOLD SILVER US OIL UK OIL
Enjoy!
May profits be upon you.
Leave any questions or comments in the comment section.
I appreciate any feedback from my viewers!
Like and/or subscribe if you want more accurate analysis.
Thank you so much!
Disclaimer:
I do not provide personal investment advice and I am not a qualified licensed investment advisor.
All information found here, including any ideas, opinions, views, predictions, forecasts, commentaries, suggestions, expressed or implied herein, are for informational, entertainment or educational purposes only and should not be construed as personal investment advice. While the information provided is believed to be accurate, it may include errors or inaccuracies.
I will not and cannot be held liable for any actions you take as a result of anything you read here.
Conduct your own due diligence, or consult a licensed financial advisor or broker before making any and all investment decisions. Any investments, trades, speculations, or decisions made on the basis of any information found on this channel, expressed or implied herein, are committed at your own risk, financial or otherwise.

Dow Jones, interpretation of where we areDespite the fact that i calculated the dates, this is just my calculation and correction could easily end in 2033rd, but for now we are monitoring the index and in the future it will be clearer to us where we are, and idea can be updated.
According to my interpretation, the bull market ended in 2021 and now we are in a rising sideways leg, which should end at the beginning or end of summer 2024.
I have two prefered calculation's of target for rising sideway's leg(wave, local rally):
1)39150$ +-500$
2)39950$
Then we go to 1st area(white lines) and bear market within flat should last about 1 year.
Next rally(leg) in the context of the expected flat correction should end around 36000$ in Spring of 2027.
And i hope that all the correction will be finished in March of 2028(Prefered, because it should be fast destroy like tsunami) or December 2029, at the 2nd area(red lines), so we won't be too old by then.)

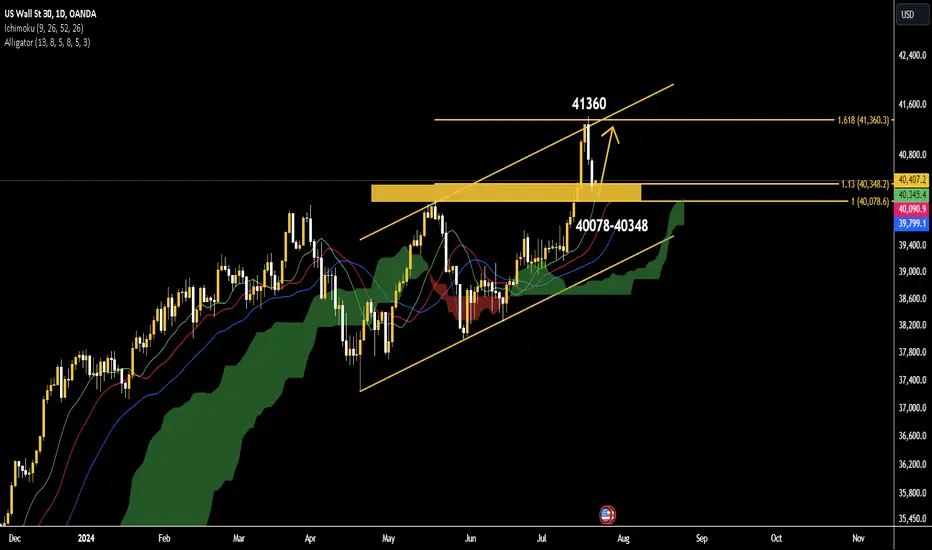
The Dow Jones index ended the correction processBy examining the trend in the daily time frame, the Dow Jones index, having an important support interval in the range of 40,348-40,078, can increase to the previous ceiling resistance in the range of 41,360.
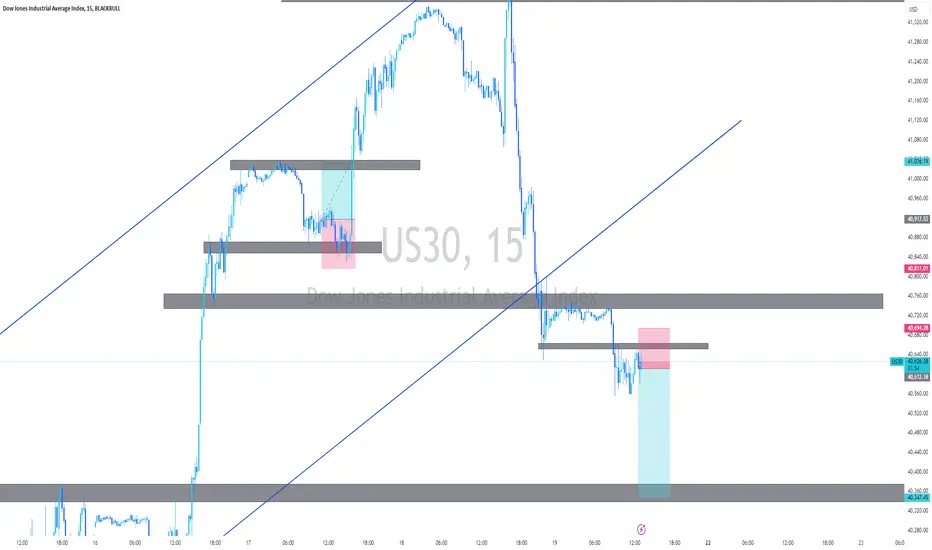
US30 trade ideaStill a continuation of last weeks movement. After breaking below the support on friday a retest followed and we anticipating for a further continuation to the downside, target being the next zone

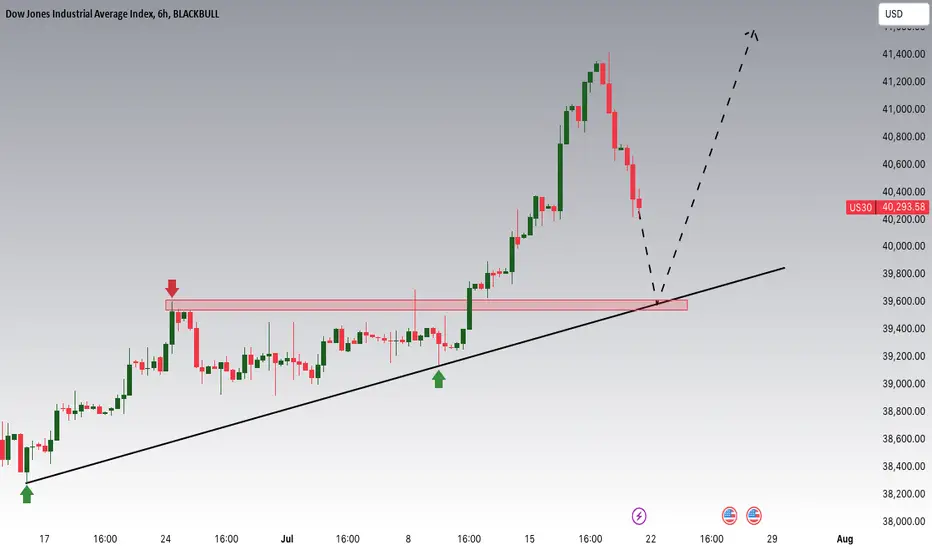
Dow Jones is approaching an important supportHey Traders, in today's trading session we are monitoring US30 for a buying opportunity around 39600 zone, US30 is trading in an uptrend and currently is in a correction phase in which it is approaching the trend at 39600 support and resistance area.
Trade safe, Joe.
Dollar IndexUS Dollar index has broken the range and now is retesting and currently rejecting.
1 Hr Timeframe Dollar Index
4HR Timeframe Dollar Index
Gold 30 minute Timeframe
Gold has rejected off 2,393.72 level I am expecting go to start to move higher and the Dollar index to move lower.

US30 trade ideaUS30 has been on an uptrend but structure has been broken. there was a brake below on the mid term support and a retest to confirm the brake and now a continuation of a downward movement is anticipated
US30The Dow Jones Industrial Average Index (US30) on a 1-day timeframe.
Key Elements in the Chart:
1. Entry Zone (40,070 - 39,880):
The recommended entry range for a long position is between 40,070 and 39,880.
2. Target Levels:
Target 1: 40,636.77
Target 2: 41,295.33
Target 3: 42,750.00
3. Stop Loss:
The stop loss level is set at 39,825.
4. Support and Resistance:
Support Zone: Marked in green below the entry range.
Resistance Levels:
First Resistance: 40,636.77
Second Resistance: 41,295.33
Final Cycle Target: 42,750.00
5. Current Price:
The current price at the time of the chart is 40,604.42, which is below the first resistance level but above the entry zone.
Analysis:
1. Entry Strategy:
The recommended entry zone for a long position is between 40,070 and 39,880. Entering within this range allows you to capitalize on a potential upward movement towards the target levels.
2. Target Levels:
The first target level of 40,636.77 is relatively close to the current price, suggesting a short-term target.
The second target of 41,295.33 and the final cycle target of 42,750.00 indicate higher resistance levels and potential profit points for medium to long-term trades.
3. Stop Loss:
A stop loss at 39,825 ensures a predefined risk, protecting the trader from significant downside moves if the market goes against the position.
4. Support and Resistance Analysis:
The support zone indicates a strong buying interest, which can serve as a cushion against falling prices.
Breaking above the resistance levels will be crucial for the continuation of the upward trend.
Trading Plan:
1. Enter Long Position: Within the entry zone (40,070 - 39,880).
2. Set Stop Loss: At 39,825 to manage risk.
3. Monitor Resistance Levels: Watch for price action around 40,636.77 and 41,295.33.
4. Take Profit:
Partial profit at the first target (40,636.77).
Further profit at the second target (41,295.33).
Final profit around the final cycle target (42,750.00).

YM OHLC Statistical Mapping + Average Range Levels by Toodegrees1/3ADR- & +Manipulation = gem | Target was 1/3ADR+
RINSE & REPEAT 1/3RR BOOKED.
Checkout my profile for the biggest discount + plenty of examples of these tools which plays out every single day and week

Papa Dow Breaks OutWhile the tech-heavy Nasdaq 100 is struggling, "The People's Index" is breaking out to fresh record highs.
The Dow has comfortably broken above previous resistance near $40K, stretching its gains to above GETTEX:41K so far. While a near-term dip is possible given the overbought RSI indicator, the longer-term bias will remain to the topside (and bulls will be looking to buy) as long as prices remain above $40K.
-MW

XAU/USD : Ready for another Fall ? (READ THE CAPTION)By analyzing the 6-hour chart of #gold, we observe that, as expected, gold experienced a decline and corrected to $2391 with a yield of 280 pips. Subsequently, the price saw a resurgence in demand and has risen to $2416 so far. The important supply levels are $2418.5 to $2424.6 and $2429 to $2433. The important demand levels are $2378 to $2384.5, $2369 to $2375, and $2326 to $2333. Keep an eye on the price reaction to these specified levels.
Please support me with your likes and comments to motivate me to share more analysis with you and share your opinion about the possible trend of this chart with me !
Best Regards , Arman Shaban

DOW JONES Top of its Channel. Sell opportunity.The Dow Jones Industrial Average Index (DJIA) hit our 41000 Target as projected on our last analysis (July 10, see chart below) and reached the top (Higher Highs trend-line) of the 3-month Channel Up:
The Bullish leg competed a rise around the same levels as the previous one (7.87% against 7.65%), so we can assume the symmetry will continue to shape within this pattern and affect the Bearish Legs too.
The previous Bearish Leg made a -5.14% decline. Our Target is 39200, marginally above the 0.618 Fibonacci retracement level.
-------------------------------------------------------------------------------
** Please LIKE 👍, FOLLOW ✅, SHARE 🙌 and COMMENT ✍ if you enjoy this idea! Also share your ideas and charts in the comments section below! This is best way to keep it relevant, support us, keep the content here free and allow the idea to reach as many people as possible. **
-------------------------------------------------------------------------------
💸💸💸💸💸💸
👇 👇 👇 👇 👇 👇

Dow Jones surges to record highs on Fed easing expectationsThe Dow Jones Industrial Average (DJIA) ascended to record highs on July 16th, 2024, fueled by mounting expectations of a Federal Reserve policy shift towards a more accommodative stance.
Fundamental Drivers:
Federal Reserve Policy: The CME FedWatch Tool currently suggests a near-certain likelihood of at least a 25-basis point interest rate cut by September, with the upcoming July FOMC meeting potentially maintaining current rates. This anticipated monetary easing is bolstering investor confidence, particularly in sectors sensitive to interest rate fluctuations, such as industrials and small-caps.
Economic Data: Recent economic data releases, including stable retail sales figures, point towards a potential "soft landing" for the U.S. economy. This reinforces optimism and supports the ongoing market rally.
Sector Rotation: Investors appear to be strategically shifting away from large-cap technology stocks, which have thrived in a low-interest-rate environment, and allocating capital towards sectors anticipated to outperform under rising interest rates.
Confirmation: The significant rise in UnitedHealth Group Inc. (UNH) on July 16th (up 6.11%) exemplifies the strength in non-technology sectors.
Looking Forward: The Dow Jones' momentum remains robust, and further upward potential exists if upcoming economic data continues to align with the Fed's potential easing narrative. Investors will be keenly focused on forthcoming economic releases and the July FOMC meeting for any insights regarding the timing and magnitude of potential rate cuts.

YM Textbook setupOHLC Statistical Mapping was precise as hell today! Textbook setup -> I was bullish so +Manipulation to +Distribution and nearly 1:5RR booked!

DOW JONES INDEX (US30): Bullish Trend Continues
US30 index updated the ATH this week.
The market managed to violate a resistance level
based on the last higher high and close above that.
The Index has a nice potential to go higher.
Next resistance - 40800
❤️Please, support my work with like, thank you!❤️

#DJIA to 40k!We are in a BULL MARKET so the risks are to the UPSIDE,
one of an explosive rally as fund managers who have badly gotten the market wrong
panic buy propelling the Stock market driven by #FOMO rather than reasoned analysis to far higher than people can imagine.
New bull market highs should arrive during summer 2023!
All whilst indecision reigns supreme on the likes of twitter in a perpetual waiting for a magic signal with the goal posts constantly drifting as those who failed to act when the knives were fast falling desperately cling onto hopes of the likes of #SPX 3600 and lower to buy
Even though if it ever happened they would once more be too fearful act just as they were the last time S&P traded down to S&P 3600 :)
My base case is we already had the recession, during the corrective moves of 2022.

Dow Jones Sustains Growth: Short-Term Bullish Strategies in PlayDuring the Wednesday session in London, the Dow Jones continued its upward trajectory. After experiencing a pullback at the $39,000 mark, the price resumed its ascent, forming a bullish candle. Our analysis suggests that the price is likely to continue rising until it reaches the Supply area, where we anticipate a potential correction.
In the meantime, we are focusing on short-term positions on lower timeframes to capitalize on this bullish continuation. These positions are aimed at taking advantage of the ongoing upward momentum as the price approaches the Supply area. By carefully monitoring the market and adjusting our strategies accordingly, we aim to maximize our gains from this bullish trend before any potential reversal occurs.
✅ Please share your thoughts about US30 in the comments section below and HIT LIKE if you appreciate my analysis. Don't forget to FOLLOW ME; you will help us a lot with this small contribution.

Dow Jones Dollar Index daily TF The Dow Jones has exhibited a bearish trend for the past nine days, following a break from its bullish channel. Historically, during its last two bullish channel periods, the index experienced a bearish phase lasting 7 to 8 days before finding support and moving higher. I anticipate a similar pattern this time, expecting the index to reach one of my areas of interest before initiating a downward swing. Once it undergoes a healthy pullback and begins to decline, a close below 12,963 will signal a significantly bearish outlook.

US30 - Dow Buy OpportunityThe Dow Jones (US30) has reached a critical support zone, aligning with an support trend line. This confluence of support provides a strong foundation for a potential upward move. If the price holds above this zone, we can expect a rise towards the resistance. Traders should watch for bullish signals and consider long positions with appropriate risk management strategies.

DOW JONES - NEW BREAKOUT Hello Traders !
Yesterday, The Dow Jones Index broke the resistance level (39064 - 39217).
The resistance becomes a new support level !
So, I expect a bullish move🚀
_____________
TARGET: 39765🎯

DOW JONES Looking to break above the 3-month Triangle.The Dow Jones Industrial Average (DJIA) has been consolidating within an Ascending Triangle since the April 01 High and recently is being supported by the 4H MA50 (blue trend-line) since June 17.
As long as it continues to hold, there are higher probabilities to finally break above the Triangle's top (Resistance 1). If it does, the pattern will transition into a Channel Up that will aim for a new Higher High.
The first Bullish Leg extended to as high as +7.52%. The 1.382 Fibonacci extension is technically the break-out target on these occasions, so our Target is in the middle of those levels at 41000.
-------------------------------------------------------------------------------
** Please LIKE 👍, FOLLOW ✅, SHARE 🙌 and COMMENT ✍ if you enjoy this idea! Also share your ideas and charts in the comments section below! This is best way to keep it relevant, support us, keep the content here free and allow the idea to reach as many people as possible. **
-------------------------------------------------------------------------------
💸💸💸💸💸💸
👇 👇 👇 👇 👇 👇
