The Dow Jones is approaching the selling rangeBy examining the trend in the four-hour time frame, the Dow Jones index is approaching the resistance range in the range of 39404-39263.
Currently, it seems that the index can decrease in price up to the support of the bottom of the channel in the range of 38941 under the condition of maintaining the mentioned resistance range.
Dowjones

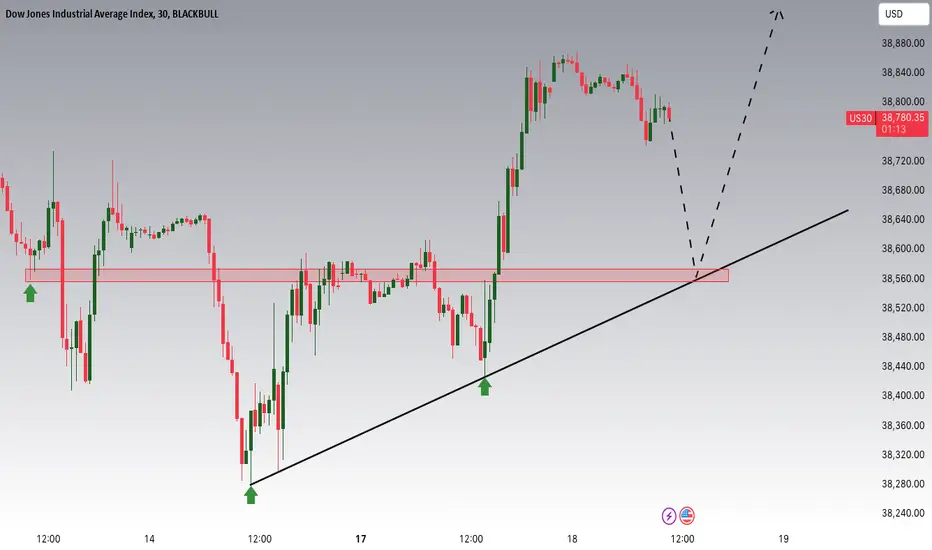
Dow Jones is approaching an important support levelHey Traders, in today's trading session we are monitoring US30 for a buying opportunity around 38,600 zone, Dow Jones is trading in an uptrend and currently is in a correction phase in which it is approaching the trend at 38,600 support and resistance area.
Trade safe, Joe.
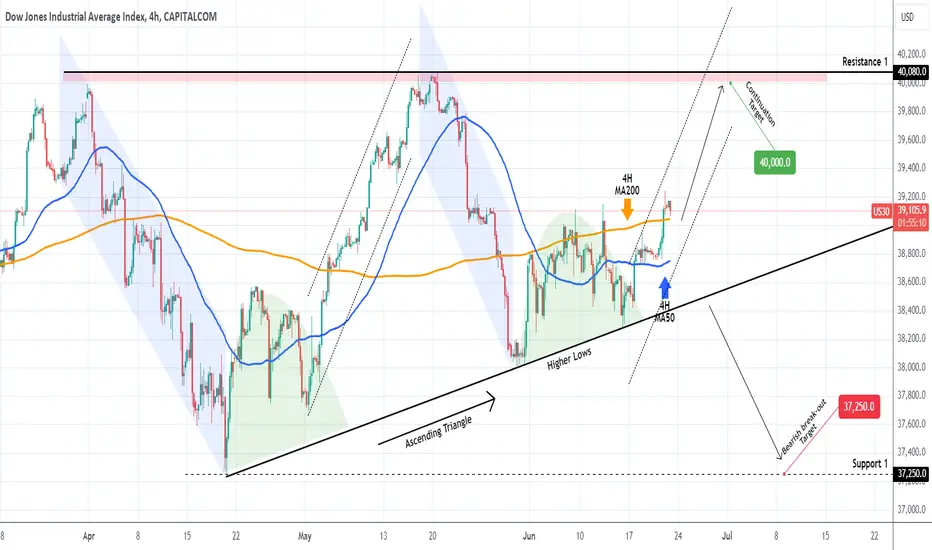
DOW JONES Ascending Triangle on its Bullish Leg.The Dow Jones Industrial Average Index (DJI) broke above the 4H MA200 (orange trend-line) again for the first time in a week, while holding the 4H MA50 (blue trend-line) as Support. The dominant pattern is an Ascending Triangle and the price action appears to be repeating the previous Leg.
As you can see, following the bottom formation and accumulation (green Arc) on the Higher Lows trend-line, which followed the Bearish Leg in the form of a Channel Down, the previous Bullish Leg (dotted Channel Up) posted a strong rally, the 2nd phase of the structure, towards the Ascending Triangle's top at 40080 (Resistance 1) when it broke above the 4H MA200.
As a result, we are bullish as long as the Asc. Triangle holds, targeting 40000 (just under Resistance 1, bottom of the red Zone). If however the price breaks below the Asc. Triangle (Higher Lows), we will take the loss on the buy and open a sell instead, targeting 37250 (Support 1).
-------------------------------------------------------------------------------
** Please LIKE 👍, FOLLOW ✅, SHARE 🙌 and COMMENT ✍ if you enjoy this idea! Also share your ideas and charts in the comments section below! This is best way to keep it relevant, support us, keep the content here free and allow the idea to reach as many people as possible. **
-------------------------------------------------------------------------------
💸💸💸💸💸💸
👇 👇 👇 👇 👇 👇
US30 Sell Setup Incoming!Based on the daily structure, there is a strong rejection and respect of the Fibonacci levels. The volume also supports this view, showing a clear accumulation of liquidity. I confidently anticipate a liquidity injection during the New York session!
Must was Heavy new on Dollar ( 30 yr bond auction rate)
Use proper risk management!!

US30 - Watch Buy Zone!US30 is creating a really interesting pattern.
We could be in an impulse/diagonal - Both of which follow similar rules. Wave 2 was a clear flat correction = 335, which broke out upwards of 23%!
We are seeing a similar correction to wave 2 now. Typically wave 4 retraces atleast to the 38.2 fibonacci level. This is where we'll have our buy zone.
We want to see 5 wave move down for subwave C (of wave 4). If all goes according to plan, we can draw an entry trendline using points 2 and 4 of subwave C to catch the 5th move higher.
Should be an easy trade!
Will update this setup if this gets enough engagement.
Goodluck and as always, trade safe!

Fund Managers underweight US equitiesLowest level since 2005
The blue lines indicate the circle low points on the graphic
I found this useful
hope u do too,

Dow Jones US30 - Lets attack ATH again!Hi Again,
Today I am sharing opportunity for long positions just before much anticipated FOMC meeting tonight.
Call it a risky trade, but if longing US30 now is risky, what the hell are currencies, gold and especially, NASDAQ and SPX doing ??
The plan is to attack 39700 area and break ATH. Who said 40000 Dow Jones is the limit?
Stop loss up to you. Safe stop loss is in 38400 area and lower due to nature of this structure they built.
Long now and lets talk tomorrow :)
Good luck and play safe!

US30 H2 - Short SignalUS30 H2
We are still looking to place short orders from as close to 39100 as possible. This is a key area of supply, resistance and psychological price. And area which has played out nicely, multiple times, during recent trade.
Similarly, we are looking for shorts on US100 from as close to 20000 price as possible. Updates to follow.

Puts DOWI think the DOW has already peaked out. I'm going to short it with puts on every rally. If tomorrow opens with a gap up I'll buy more.

DowJonesDow Jones analysis
Daily and 2-hour time frame
The price moved from the bottom of the daily range to the midline of the range.
When the price reaches the 2-hour support floor, we can enter a buying position.

Optimal US30 Entry: Capitalizing on Weak USD Amid Soft InflationHello Traders,
In today's trading session, we are closely monitoring the US30 (Dow Jones Industrial Average) for a potential buying opportunity around the 38200 zone. The Dow Jones is currently trading in an uptrend and is undergoing a correction phase, bringing it closer to the key support and resistance area at 38200. This level has historically acted as a significant pivot point, making it a strategic entry point for long positions.
From a fundamental perspective, we are considering the negative correlation between the USD and the Dow Jones. The USD has been weakening following a series of soft inflation data. Yesterday's CPI report came in lower than expected, and the Federal Reserve adopted a dovish stance during the FOMC meeting, further easing monetary policy. Additionally, today's PPI data also came in softer than anticipated, reinforcing the trend of easing inflation.
This series of soft inflation readings is expected to weigh heavily on the USD, as lower inflation reduces the need for aggressive monetary tightening by the Federal Reserve. A weaker USD is generally bullish for equities, including indices like the US30, as it enhances the appeal of US assets to foreign investors. Given these fundamental factors, the 38200 zone presents a decent support zone for the US30.
Trade safely,
Joe

WEEKLY FOREX FORECAST: INDICES, GOLD, SILVER, US OIL.... Part 2This is Part 2 of the Weekly Forex Forecast.
Click the link below for Part 1!
In this video, we will cover:
S&P500
NASDAQ
DOW JONES
GOLD
SILVER
WTI CRUDE OIL
Enjoy!
May profits be upon you.

DOW JONES Bottom next week. 42k long-term Target.Dow Jones (DJI) is about to close a red 1W candle, staying flat basically for the 3rd week in a row. May's Double Top on Resistance 1 (40075) technically calls for an approach attempt on Support 1 (37250) but that doesn't invalidate the long-term bullish technicals as the pattern is a 1.5 year Channel Up.
As a result, with the 1W MA50 (blue trend-line) supporting since the week of October 30 2023, closing in towards Support 1, we expect a bottom to be formed next week when the 1W RSI makes a Lower Low. As you can see, the last 3 long-term buy opportunities have been when a 1W RSI Channel Down (blue) made a Lower Low.
Our long-term Target for Q4 is 42000 (just above the 0.786 Fibonacci Channel level).
-------------------------------------------------------------------------------
** Please LIKE 👍, FOLLOW ✅, SHARE 🙌 and COMMENT ✍ if you enjoy this idea! Also share your ideas and charts in the comments section below! This is best way to keep it relevant, support us, keep the content here free and allow the idea to reach as many people as possible. **
-------------------------------------------------------------------------------
💸💸💸💸💸💸
👇 👇 👇 👇 👇 👇

DOW JONES - DOUBLE TOPHello Traders !
On Friday 7 June, The dow jones reached a resistance level (39114 - 39217).
The price formed a double top pattern.
At the moment, The neckline is broken !
So, i predict a bearish move📉
___________
TARGET: 38115🎯

Industrial stocks in troubleI see DOW is running out of stem. I just bought puts of CAT strike 325 expire July 12. You can just short the stock as well. If the price pulls back to test the 334 resistance I'll buy more puts. The double top also looks very bearish.

XAUUSD NFP ANALYSIS AND TRADE LEVEL 7-6-24 (2)XAUUSD NFP DAY ANALYSIS 7-6-24:
Spot Gold Prices and Market Movements
Current Trends: Spot gold prices have surged to $2,387, indicating hawkish market movements. However, with the opening of the UK session, a retracement to a low of $2,340.92 has already been observed.
Upcoming Data: Looking ahead, the release of the Non-Farm Payroll (NFP) data on June 7, 2024, is highly anticipated. Gold trading is expected to be cautious, with high trade volumes and significant numbers.
Market Closures: On Monday, the markets in China and Australia, which have a substantial influence on gold prices, will be closed due to holidays.
Influencing Factors
US Dollar and Treasury Yields: Several factors, such as hawkish Federal Reserve expectations, have revived the demand for the US Dollar across the market. Treasury bond yields have rallied to multi-week highs.
GDP Data and Jobless Claims: Thursday’s revision of GDP data from 1.3% to an estimated 1.6% suggests that jobless claims might increase, which could put pressure on the Dollar. This could affect gold values, potentially pushing them back to the $2,380-$2,400 range.
Heading towards NFP show as of writing XAUUSD SPOT GOLD Prices are crashing to $2338.45 cmp now and as mentioned in our last NFP the factors influencing gold on NFP day
This helped gold price attempt a modest comeback, having incurred steep losses on Wednesday. A surprise uptick in the Core figure will reinforce delayed and less aggressive Fed rate cut expectations, providing extra legs to the US Dollar decline while smashing gold price.
Fundamental Which Might Affect XAUUSD:7-6-24
NFP Scenarios Friday:
• 150,000 or Less: Could trigger USD selloff, boosting gold.
• 200,000 to 250,000: May keep focus on inflation without major USD impact.
• 250,000 or More: Could lead to Fed rate cut, driving USD rally and gold drop
• Crucial jobs report for May. April’s NFP increase led to USD selling pressure.
Upcoming Influences:
The future of gold prices hinges on the forthcoming US Core PCE inflation data, due later in the American trading session on Friday. The Core PCE Price Index is anticipated to rise by 2.8% year-over-year in April, maintaining the same pace as observed in March.
If the Core PCE price index exceeds expectations, it could delay anticipated aggressive Federal Reserve rate cuts. This situation tends to strengthen the US dollar while exerting downward pressure on gold prices.
Conversely, if the Core PCE price index shows unexpected softness, it may increase the likelihood of a Federal Reserve rate cut in September, potentially driving a further increase in gold prices.
Depending on forthcoming economic indicators, US inflation data might propel XAUUSD into the
$2288-$2250 Range or $2400-$2450 range
Technical Level and Analysis:
Buy at:$2323.69-$2306.23-$2286.23-$2261.91
Sell at :$2388.31-$2400.67-$2425.41-$2447.34
⚠️Warning: Do not risk more than 5% of your capital, you might lose your money
🔴Technical Status: XAUUSD: 📌
D1 SMA100-P (2260.90) Buy 🔺
H4 SMA100-P (2368.74) Sell 🔻
H1 SMA100-P (2347.88) Sell🔻
H4 SMA200-P(2351.01) Buy🔺
RSI(14): Status: Oversold
STOCHRSI(14): Status: Oversold
ROC: Status: Buy
William%R: Status: Buy
ATR(14): Status: Buy
SOC: Status: Neutral
⚠️Ongoing Geo-political Tensions: ‼️
Israel – Iran
Russia - Ukraine
US-China Relations
Middle East Instability
Taiwan-China Relations

TSLA : First Bearish Target Reached , What's Next ? (Fall More?)Upon reviewing Tesla's stock chart, we see that the price hit its initial target of $168 and even corrected down to $167. Following the release of yesterday's CPI data, the stock saw renewed demand and is currently trading around $177.
Prediction : After a brief upward movement, I anticipate the stock will face another decline.
Note : All other assumptions from the previous analysis remain valid.
Please support me with your likes and comments to motivate me to share more analysis with you and share your opinion about the possible trend of this chart with me !
Best Regards , Arman Shaban

US30 / DJ30 / DJI Market Robbery Plan to heist moneyMy Dear Robbers / Traders,
This is our master plan to Heist (US30 / DowJones30) based on Thief Trading style Technical Analysis.. kindly please follow the plan I have mentioned 2 Plans with target in the chart focus on whether Long or short entry. Our target is Red Zone for Bulls and Green Zone for Bears that is High risk Dangerous level market is overbought & Oversold / Consolidation / Trend Reversal at the level Robbers / Traders gain the strength. Be safe and be careful and Be rich.
Note: If you've got a lot of money you can get out right away otherwise you can join with a swing trade robbers and continue the heist plan,
Loot and escape on the target 🎯 Swing Traders Plz Book the partial sum of money and wait for next breakout of dynamic level / Order block, Once it is cleared we can continue our heist plan to next new target.
support our robbery plan we can easily make money & take money 💰💵 Join your hands with US. Loot Everything in this market everyday.

#NASDAQ vs #DJIA has only been lower on the RSI 3 times! I wager #TECH is still the place to earn better gains going forward.
It also doesn't carry the risk of #Financials
and it is not dragged down by slow growth "stable" companies like utilities.
Bleeding edge has always been the place to grow your money
and with #AI manifesting itself for the next wave of user growth along with #CRYPTO
you need exsposure to network effects investments.

DOWJONES US30 Multitimeframe analysisUS100 and 500 are almost completely the same with this analysis
☝️Do not act based on my analysis, do your own research!!
The main purpose of my resources is free, actionable education for anyone who wants to learn trading and improve mental and technical trading skills. Learn from hundreds of videos and the real story of a particular trader, with all the mistakes and pain on the way to consistency. I'm always glad to discuss and answer questions. 🙌
☝️ALL ideas and videos here are for sharing my experience purposes only, not financial advice, NOT A SIGNAL. YOUR TRADES ARE YOUR COMPLETE RESPONSIBILITY. Everything here should be treated as a simulated, educational environment. Important disclaimer - this idea is just a possibility and my extremely subjective opinion. Do not act based on my analysis, do your own research!!

DowJones (US30) Bearish patterns and signsIn this 1-hour chart of DowJones (US30), we observe a significant bearish pattern forming after the price action. The market hunted the highs of both the Asia and Euro sessions during the NY session, which typically signals a liquidity grab. This maneuver often leads to a swift reversal, as is evident by the price dropping back down after touching the resistance zone.
The index has broken down from a rising wedge pattern, a bearish reversal signal. This suggests that after the false breakout to the upside, the DowJones is poised for a considerable decline. Traders should anticipate further bearish momentum, potentially leading the index down to lower levels. The break below the wedge confirms that the upward momentum has weakened, and sellers are likely to dominate, pushing the price down further.
Keep an eye on support levels for any potential slowdowns, but the overall trend appears to be bearish for the immediate future.

NASDAQ INDEX (US100): Potential Scenarios Ahead of FOMC
NASDAQ Index is currently consolidating within a horizontal range.
Most likely, the market participants are waiting for the FOMC tomorrow.
Depending on the reaction of the market to the boundaries of the range,
I see 2 potential scenarios.
Bullish Scenario
If the market breaks and closes above 19115 the resistance of the range,
with a high probability, a bullish rally will continue.
Bearish Scenario
If the Index breaks and closes below 18880 the support of the range,
it may initiate a correctional movement.
I think that US100 may keep being weak before the news release.
Let's see what direction the market will choose tomorrow.
❤️Please, support my work with like, thank you!❤️

DJ30 FORECASTBased on the OANDA:US30USD chart, the price at 38790.0 is above the pivot point of 38753, indicating a bullish sentiment. If the price stays above this pivot, it could move towards Bullish levels at 38906 and 39022. Conversely, if it drops below the pivot point, it could target Bearish levels at 38637 and 38484. The current bias is bullish, but close monitoring around the pivot point is essential to confirm the market direction.
Key Levels:
Bullish Lines: 38818, 38906, 39022, 39165
Pivot Line: 38753
Bearish Line: 38637, 38484, 38279
