XAU/USD : Possible of Growth ? Let's See ! By analyzing the #gold chart in the 2-hour time frame, we can see that the price has finally dropped below the $2,300 level and reached the demand zone at $2,288. As you can see, the initial reaction to this level has been positive. Only if the price stabilizes above the $2,277 to $2,288 range can we expect further short-term growth in gold. With the significant drop in gold, a large FVG (Fair Value Gap) and LV (Liquidity Void) have been created, which I expect will be filled in the medium term. The expected return of this analysis is a minimum of 40 to 100 pips, and in the best-case scenario, up to 700 pips.
Please support me with your likes and comments to motivate me to share more analysis with you and share your opinion about the possible trend of this chart with me !
Best Regards , Arman Shaban
Dowjones

Trade Like A Sniper - Episode 20 - DJI - (6th June 2024)This video is part of a video series where I backtest a specific asset using the TradingView Replay function, and perform a top-down analysis using ICT's Concepts in order to frame ONE high-probability setup. I choose a random point of time to replay, and begin to work my way down the timeframes. Trading like a sniper is not about entries with no drawdown. It is about careful planning, discipline, and taking your shot at the right time in the best of conditions.
A couple of things to note:
- I cannot see news events.
- I cannot change timeframes without affecting my bias due to higher-timeframe candles revealing its entire range.
- I cannot go to a very low timeframe due to the limit in amount of replayed candlesticks
In this session I will be analyzing the Dow Jones Industrial Average Index (DJI), starting from the 6-Month chart.

APPLE (AAPL)Apple's innovation shown in iPhone 14 is not likely enough to entice consumers to stretch their budgets in the current macroeconomic environment
40% of Warren Buffett portfolio still belongs to Apple?! for most people and traders I think its a slow asset class and like Tim Apple! sorry Cook ,Warren like to play safe too
Apple price showed a good reaction to 135 support and now heading to 149, for Scalpers breaking 150 resistance can be a good long opportunity and for investors AAPL still can back to 125$ levels so
there is no reason to fomo

Dow Jones - All time high and 20% rally?Hello Traders and Investors, today I will take a look at the Dow Jones .
--------
Explanation of my video analysis:
For more than a decade, the Dow Jones has been trading in a rising channel formation. We had the first retest of support and resistance back in 2011 and ever since this was a massively profitable channel pattern. With the recent breakout above the $35.000 resistance level, the Dow Jones clearly looks like the next target is once again the upper resistance of the channel.
--------
Keep your long term vision,
Philip (BasicTrading)

DowJones US30 / DJ30 Bullish Money heist planMy Dear Robbers / Traders,
This is our master plan to Heist US30 Dow Jones Market based on Thief Trading style Technical Analysis.. kindly please follow the plan I have mentioned in the chart. Our target is Green Zone that is High risk Dangerous level MA act as a Dynamic Resistance & Order Block, So the Market is overbought / Consolidation / Trend Reversal at the level Bullish Robbers / Traders gain the strength. Be safe and be careful and Be rich.
Note: If you've got a lot of money you can get out right away otherwise you can join with a swing trade robbers and continue the heist plan,
Loot and escape on the target 🎯
support our robbery plan we can easily make money & take money 💰💵 Join your hands with US. Loot Everything in this market everyday.

How to pick trades in different market conditionsIn the video I look at two different markets and the resultant setups which yielded the prime trades. The two markets had to be approached in different ways, especially early in the session.
I look through the price action on the DOW and then the Nasdaq. The DOW proved to be more clear cut and a trend style approach while the Nasdaq was very choppy and warranted a range or reversion style approach to the trades.
Still, both were tradable and produced some good scalps although the action had to be recognised early.
ANY QUESTIONS, JUST LEAVE IN THE COMMENTS !!
** If you like the content then take a look at the profile to get more ideas and learning material **
** Any Comments and likes are greatly appreciated **

DOW JONES The bleeding may not be over. How low will it go?On our last Dow Jones (DJI) analysis (May 24, see chart below), we called for the high probability of a bearish break-out below the Channel Down, following the 1D MACD Bearish Cross (similar to April 02):
As you can see, Dow delivered, so our 38350 Target got hit, with minimum losses on the buy position at the bottom of the Channel Up. Yesterday's rejection on the 1D MA50 (blue trend-line) though, is far from ideal and opens the way for more downside.
The chart shows DJI's long-term pattern, which has been a Channel Up since the October 03 2022 market bottom. The periodic corrections through Bearish Legs have both declined by -9.25%, a striking resemblance indeed. Yesterday's 1D MA50 rejection basically resembles those of the past Bearish Legs on March 06 2023 and October 17 2023.
Ahead of the 1D MA50/ 100 Bearish Cross, which could be completed by tomorrow, there is high probability for a deeper Low, at least as Low as Support 1 (37250). This would be ideal as it would also make contact with the 1D MA200 (orange trend-line) for the first time in 7 months (since November 03 2023)!
After that though, we will turn into long-term buyers again, even though that wouldn't complete the -9.25% decline of the previous Bearish Legs, but in terms of R/R would be acceptable enough to aim for 40000 before the Channel Up goes for a Higher High.
-------------------------------------------------------------------------------
** Please LIKE 👍, FOLLOW ✅, SHARE 🙌 and COMMENT ✍ if you enjoy this idea! Also share your ideas and charts in the comments section below! This is best way to keep it relevant, support us, keep the content here free and allow the idea to reach as many people as possible. **
-------------------------------------------------------------------------------
💸💸💸💸💸💸
👇 👇 👇 👇 👇 👇

WEEKLY FOREX FORECAST: NASDAQ, SP500, DOW, CRUDE OIL (Part 2)We are covering the indices and crude oil in this video.
Providing analysis for the week of June 3-7th.

US30 H4 | Bearish drop?Based on the H4 chart analysis, we can see that the price is rising toward our sell entry at 39,353, which is a pullback resistance close to 61.8% Fivo retracement.
Our take profit will be at 38,617 a supoprt support level.
The stop loss will be placed at 39,898, an overlap resistance level.
High Risk Investment Warning
Trading Forex/CFDs on margin carries a high level of risk and may not be suitable for all investors. Leverage can work against you.
Stratos Markets Limited (www.fxcm.com):
CFDs are complex instruments and come with a high risk of losing money rapidly due to leverage. 68% of retail investor accounts lose money when trading CFDs with this provider. You should consider whether you understand how CFDs work and whether you can afford to take the high risk of losing your money.
Stratos Europe Ltd, previously FXCM EU Ltd (www.fxcm.com):
CFDs are complex instruments and come with a high risk of losing money rapidly due to leverage. 70% of retail investor accounts lose money when trading CFDs with this provider. You should consider whether you understand how CFDs work and whether you can afford to take the high risk of losing your money.
Stratos Trading Pty. Limited (www.fxcm.com):
Trading FX/CFDs carries significant risks. FXCM AU (AFSL 309763), please read the Financial Services Guide, Product Disclosure Statement, Target Market Determination and Terms of Business at www.fxcm.com
Stratos Global LLC (www.fxcm.com):
Losses can exceed deposits.
Please be advised that the information presented on TradingView is provided to FXCM (‘Company’, ‘we’) by a third-party provider (‘TFA Global Pte Ltd’). Please be reminded that you are solely responsible for the trading decisions on your account. There is a very high degree of risk involved in trading. Any information and/or content is intended entirely for research, educational and informational purposes only and does not constitute investment or consultation advice or investment strategy. The information is not tailored to the investment needs of any specific person and therefore does not involve a consideration of any of the investment objectives, financial situation or needs of any viewer that may receive it. Kindly also note that past performance is not a reliable indicator of future results. Actual results may differ materially from those anticipated in forward-looking or past performance statements. We assume no liability as to the accuracy or completeness of any of the information and/or content provided herein and the Company cannot be held responsible for any omission, mistake nor for any loss or damage including without limitation to any loss of profit which may arise from reliance on any information supplied by TFA Global Pte Ltd.
The speaker(s) is neither an employee, agent nor representative of FXCM and is therefore acting independently. The opinions given are their own, constitute general market commentary, and do not constitute the opinion or advice of FXCM or any form of personal or investment advice. FXCM neither endorses nor guarantees offerings of third party speakers, nor is FXCM responsible for the content, veracity or opinions of third-party speakers, presenters or participants.

US30 Trading Plan - 02/Jun/2024Hello Traders,
Hope you all are doing good!!
I expect US30 to go Up after finishing the correction.
Currently US30 has given a nice impulse showing us that buyers are interested to enter the market for pushing US30 upside.
Plan to Trade:
If market starts to correct from current levels without going further to 39k level, then any correction towards highlighted zone will be a potential BUY.
The first target level to look for reaction will be 39k & if it corrects here then the next target will be around 39.5k level.
If market keeps on pushing towards 39k level before start to correct, then any correction to highlighted zone will be a potential BUY.
In this case the target will be 39.5k level.
Look for your BUY entry setups as per the above expectations.
Your follow and like will be a token of appreciation.
Disclaimer: This is just an idea. Please do your own analysis before opening a position. Always use SL & proper risk management.
Market can evolve anytime, hence, always do your analysis and learn trade management before following any idea.

SPY WEEKLY 3rd June 2024Welcome to SPY Weekly. I have discussed the levels where to go long. If you have any doubts or questions please feel free to DM here on X.
NOTE: DO NOT BUY CALLS

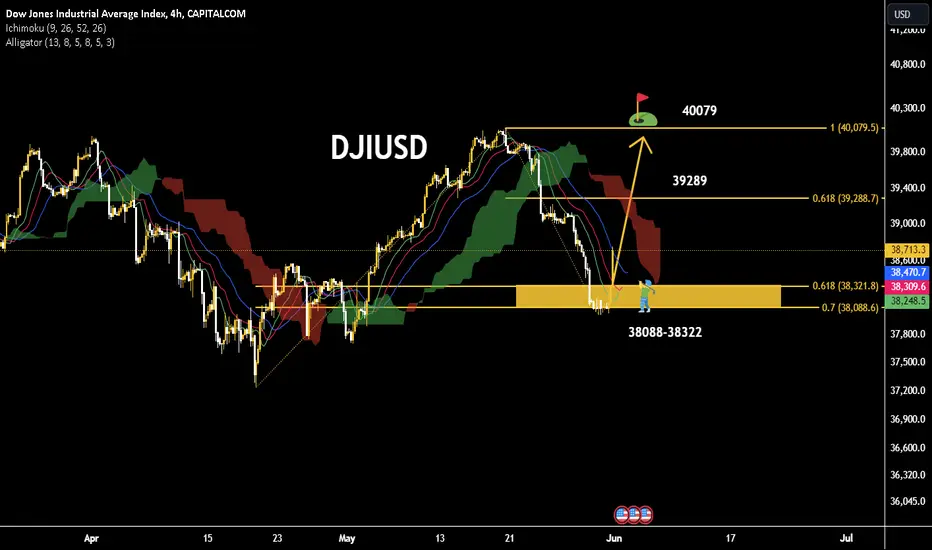
NEW IDEA FOR DOWJONES The increase in the Dow Jones index due to the increase in profits from the income of companies
By examining the trend in the four-hour time frame, the Dow Jones index, having an important support interval in the range of 38,322-38,088, can increase to the previous ceiling resistance in the range of 40,079, in the meantime, the 61.8% Fibo resistance will be seen at 39,289.
DOW JONES (US30) LONGS NOT BAD IDEADuring the uncertainty and risk off environment, low GDP data didn't come unnoticed and big boys accumulated some equities after the huge Salesforce panic.
Today, with NASDAQ loosing almost 2% and 0.7% for SP500, DJ was accumulated, so I think we might see nice and strong reversal for the end of the week and month close.
Play safe and good luck!

US30 H4 | Bearish reversalBased on the H4 chart analysis, we can see that the price is rising toward our sell entry at 39,355, which is a pullback resistance.
Our take profit will be at 38,761, an overlap support level.
The stop loss will be placed at 39.839, an overlap resistance level.
High Risk Investment Warning
Trading Forex/CFDs on margin carries a high level of risk and may not be suitable for all investors. Leverage can work against you.
Stratos Markets Limited (www.fxcm.com):
CFDs are complex instruments and come with a high risk of losing money rapidly due to leverage. 68% of retail investor accounts lose money when trading CFDs with this provider. You should consider whether you understand how CFDs work and whether you can afford to take the high risk of losing your money.
Stratos Europe Ltd, previously FXCM EU Ltd (www.fxcm.com):
CFDs are complex instruments and come with a high risk of losing money rapidly due to leverage. 70% of retail investor accounts lose money when trading CFDs with this provider. You should consider whether you understand how CFDs work and whether you can afford to take the high risk of losing your money.
Stratos Trading Pty. Limited (www.fxcm.com):
Trading FX/CFDs carries significant risks. FXCM AU (AFSL 309763), please read the Financial Services Guide, Product Disclosure Statement, Target Market Determination and Terms of Business at www.fxcm.com
Stratos Global LLC (www.fxcm.com):
Losses can exceed deposits.
Please be advised that the information presented on TradingView is provided to FXCM (‘Company’, ‘we’) by a third-party provider (‘TFA Global Pte Ltd’). Please be reminded that you are solely responsible for the trading decisions on your account. There is a very high degree of risk involved in trading. Any information and/or content is intended entirely for research, educational and informational purposes only and does not constitute investment or consultation advice or investment strategy. The information is not tailored to the investment needs of any specific person and therefore does not involve a consideration of any of the investment objectives, financial situation or needs of any viewer that may receive it. Kindly also note that past performance is not a reliable indicator of future results. Actual results may differ materially from those anticipated in forward-looking or past performance statements. We assume no liability as to the accuracy or completeness of any of the information and/or content provided herein and the Company cannot be held responsible for any omission, mistake nor for any loss or damage including without limitation to any loss of profit which may arise from reliance on any information supplied by TFA Global Pte Ltd.
The speaker(s) is neither an employee, agent nor representative of FXCM and is therefore acting independently. The opinions given are their own, constitute general market commentary, and do not constitute the opinion or advice of FXCM or any form of personal or investment advice. FXCM neither endorses nor guarantees offerings of third party speakers, nor is FXCM responsible for the content, veracity or opinions of third-party speakers, presenters or participants.

My bottom/date scenario prepared for the Dow Jones."My expectation for the 2026 bottom region of the Dow Jones, which I have been anticipating since last year, and the momentum it will gain afterward is as follows. My chart covers the next 10 years and beyond. I have made my purchases under the current circumstances, and if my anticipated bottom scenario materializes in late 2025 and early 2026, I will make my second purchase.
Note: My charts reflect my own ideas."

DJ30 FORECASTThe forecast for the Dow Jones 30 is now leaning towards a bearish trend. Prices are expected to fluctuate between 40050 and 39564. However, if the 4h candle closes below the pivot line at 39,564, the bearish pressure is likely to continue, potentially driving prices down to 39400 and 38825.
Key Levels:
Bullish Line: 39825, 40050, 40285, 40500
Pivot Line: 39564
Bearish Line: 39400, 39075, 38825, 38445

US30Dow Jones index analysis
1 hour time frame
The price can move to the bottom of the 1-hour range and from there return to the top of the 1-hour range.

DJ30 FORECASTThe forecast for the OANDA:US30USD indicates a potential bearish trend. However, there may be a retest of resistance levels between 38445 and 38600 before the downtrend begins. The bearish movement is expected to target support levels at 37721 and 37499.
Key Levels:
Bullish Line: 38445, 38825, 39075, 39400
Pivot Line: 38000
Bearish Line: 37721, 37499, 37130, 36665

Dow Jones H4 | Pullback support at 78.6% Fibonacci retracementThe Dow Jones (US30) is falling towards a pullback support and could potentially bounce off this level to climb higher.
Buy entry is at 37,777.51 which is a pullback support that lies underneath the 78.6% Fibonacci retracement level.
Stop loss is at 37,200.00 which is a level that lies underneath a swing-low support.
Take profit is at 38,575.61 which is an overlap resistance.
High Risk Investment Warning
Trading Forex/CFDs on margin carries a high level of risk and may not be suitable for all investors. Leverage can work against you.
Stratos Markets Limited (www.fxcm.com):
CFDs are complex instruments and come with a high risk of losing money rapidly due to leverage. 68% of retail investor accounts lose money when trading CFDs with this provider. You should consider whether you understand how CFDs work and whether you can afford to take the high risk of losing your money.
Stratos Europe Ltd, previously FXCM EU Ltd (www.fxcm.com):
CFDs are complex instruments and come with a high risk of losing money rapidly due to leverage. 70% of retail investor accounts lose money when trading CFDs with this provider. You should consider whether you understand how CFDs work and whether you can afford to take the high risk of losing your money.
Stratos Trading Pty. Limited (www.fxcm.com):
Trading FX/CFDs carries significant risks. FXCM AU (AFSL 309763), please read the Financial Services Guide, Product Disclosure Statement, Target Market Determination and Terms of Business at www.fxcm.com
Stratos Global LLC (www.fxcm.com):
Losses can exceed deposits.
Please be advised that the information presented on TradingView is provided to FXCM (‘Company’, ‘we’) by a third-party provider (‘TFA Global Pte Ltd’). Please be reminded that you are solely responsible for the trading decisions on your account. There is a very high degree of risk involved in trading. Any information and/or content is intended entirely for research, educational and informational purposes only and does not constitute investment or consultation advice or investment strategy. The information is not tailored to the investment needs of any specific person and therefore does not involve a consideration of any of the investment objectives, financial situation or needs of any viewer that may receive it. Kindly also note that past performance is not a reliable indicator of future results. Actual results may differ materially from those anticipated in forward-looking or past performance statements. We assume no liability as to the accuracy or completeness of any of the information and/or content provided herein and the Company cannot be held responsible for any omission, mistake nor for any loss or damage including without limitation to any loss of profit which may arise from reliance on any information supplied by TFA Global Pte Ltd.
The speaker(s) is neither an employee, agent nor representative of FXCM and is therefore acting independently. The opinions given are their own, constitute general market commentary, and do not constitute the opinion or advice of FXCM or any form of personal or investment advice. FXCM neither endorses nor guarantees offerings of third-party speakers, nor is FXCM responsible for the content, veracity or opinions of third-party speakers, presenters or participants.

Hellena | DJI (4H): Short to the support area 37616.32.Dear colleagues, having reviewed the waves I assume that now the price is in a big correction and I expect that the price will continue downward movement to the support area 37616.32 (completion of the wave “C”). Before that a small correction to the resistance area 38978.81 is possible.
Manage your capital correctly and competently! Only enter trades based on reliable patterns!

US30. Weekly trading levels 27 - 31.05.2024
During the week you can trade from these price levels. Finding the entry point into a transaction and its support is up to you, depending on your trading style and the development of the situation. Zones show preferred price ranges WHERE to look for an entry point into a trade.
If you expect any medium-term price movements, then most likely they will start from one of the zones.
Levels are valid for a week, the date is in the title. Next week I will adjust the levels based on new data and publish a new post.
! Please note that brokers have a difference in quotes, take this into account when trading.
The history of level development can be seen in my previous posts. They cannot be edited or deleted. Everything is fair. :)
----------------------------------------------
I don’t play guess the direction (that’s why there are no directional arrows), but zones (levels) are used for trading. We wait for the zone to approach, watch the reaction, and enter the trade.
Levels are drawn based on volumes and data from the CME. They are used as areas of interest for trading. Traded as classic support/resistance levels. We see the reaction to the rebound, we trade the rebound. We see a breakout and continue to trade on a rollback to the level. The worst option is if we revolve around the zone in a flat.
Do not reverse the market at every level; if there is a trend movement, consider it as an opportunity to continue the movement. Until the price has drawn a reversal pattern.
Don't forget to like Rocket and Subscribe!!! Feedback is very important to me!

DOW JONES: Correction completed. Time for a new High.Dow Jones may have turned red on its 1D technical outlook (RSI = 35.469, MACD = -17.010, ADX = 38.217) but it is only neutral on 1W (RSI = 52.498) suggesting that on the long run, these are strong buy levels from a R/R perspective. Two weeks ago we called the current pullback to 38,550 as a possibility but now it is time to turn bullish again. As you can see, on the 1W timeframe, there are striking resemblances with the Channel Up of March 2023 and in today's terms we are on the May's 2023 corrective wave. We expect at least a +13.67% rise from the recent bottom and our target sits slightly under that level (TP = 42,000).
See how our prior idea has worked out:
## If you like our free content follow our profile to get more daily ideas. ##
## Comments and likes are greatly appreciated. ##

Dow Jones (US30):🔴Is it bearish..?!🔴Hello trader
By examining Dow Jones on the weekly and 4-hour chart we can figure out the chart is bearish and there is sell-side liquidity that can be defined as targets for smart money.
In this chart, the price failed to create an all-time high and dropped, the price made the bearish breaker and respected it and shifted the market structure.
Now we can see the bearish order block with bearish FVG that makes an important resistance, If the price reaches this zone we can look for a sell position in a lower time frame.
💡Wait for the update!
🗓️27/05/2024
🔎 DYOR
💌It is my honor to share your comments with me💌
