Dow Jones Bullish Setup A potential bullish setup is forming on the Dow Jones Industrial,
suggesting a long opportunity upon confirmation. The trade will only activate if key validation criteria are met, targeting a 1:3 risk-reward ratio.
Dowjones

DowJones INTRADAY Key trading zone retestKey Support and Resistance Levels
Resistance Level 1: 42,920
Resistance Level 2: 43,300
Resistance Level 3: 43,620
Support Level 1: 41,470
Support Level 2: 41,160
Support Level 3: 40,890
This communication is for informational purposes only and should not be viewed as any form of recommendation as to a particular course of action or as investment advice. It is not intended as an offer or solicitation for the purchase or sale of any financial instrument or as an official confirmation of any transaction. Opinions, estimates and assumptions expressed herein are made as of the date of this communication and are subject to change without notice. This communication has been prepared based upon information, including market prices, data and other information, believed to be reliable; however, Trade Nation does not warrant its completeness or accuracy. All market prices and market data contained in or attached to this communication are indicative and subject to change without notice.

The tariff legal zig-zagWith different US courts firing "shots" at each other over the legality of tariffs, the market is taking a bit of a pause from accelerating further. Let's dig in!
DJ:DJI
TVC:SPX
TVC:NDQ
TVC:DXY
Let us know what you think in the comments below.
Thank you.
77.3% of retail investor accounts lose money when trading CFDs with this provider. You should consider whether you understand how CFDs work and whether you can afford to take the high risk of losing your money. Past performance is not necessarily indicative of future results. The value of investments may fall as well as rise and the investor may not get back the amount initially invested. This content is not intended for nor applicable to residents of the UK. Cryptocurrency CFDs and spread bets are restricted in the UK for all retail clients.

DowJones INTRADAY important resistance retest Key Support and Resistance Levels
Resistance Level 1: 42,920
Resistance Level 2: 43,300
Resistance Level 3: 43,620
Support Level 1: 41,470
Support Level 2: 41,160
Support Level 3: 40,890
This communication is for informational purposes only and should not be viewed as any form of recommendation as to a particular course of action or as investment advice. It is not intended as an offer or solicitation for the purchase or sale of any financial instrument or as an official confirmation of any transaction. Opinions, estimates and assumptions expressed herein are made as of the date of this communication and are subject to change without notice. This communication has been prepared based upon information, including market prices, data and other information, believed to be reliable; however, Trade Nation does not warrant its completeness or accuracy. All market prices and market data contained in or attached to this communication are indicative and subject to change without notice.

Dow Eyes 42,800 Resistance – Key Breakout Ahead?The Dow is currently holding near the neckline of a double-top formation that developed between December 2024 and February 2025, possibly buoyed by ongoing tech and Nasdaq optimism. The broader rebound from the 2025 lows is also forming a diagonal structure, setting up the following scenarios:
Bullish Scenario:
With weekly RSI holding above the 50 neutral zone after rebounding from oversold levels last seen in 2020, a sustained move above the 42,800-resistance level could extend the rally toward 43,800 and 44,800. A breakout above the all-time high near 45,000 would open the door toward the next major resistance at 46,800.
Bearish Scenario:
If the diagonal formation breaks to the downside—below 41,400 and 41,000—selling pressure could resume, forming a diagonal correction targeting support levels at 40,400, 39,700, and 39,000.
Written by Razan Hilal, CMT

DOW JONES: Channel Up targeting 43,400.Dow Jones is practically neutral on its 1D technical outlook (RSI = 55.880, MACD = 380.350, ADX = 13.770) as the price is consolidating on its 4H MA50. Despite the neutrality, it remains inside the Channel Up, that is supported by the 4H MA200 and whose 4H RSI squeeze indicates we might be on a similar slow uptrend as late April's. We expect a similar +5.60% rise from the HL bottom, TP = 43,300.
## If you like our free content follow our profile to get more daily ideas. ##
## Comments and likes are greatly appreciated. ##

The Dow Jones Begins to Stabilize Around 42,500 PointsThe U.S. index has halted the advance of its recent bullish moves near this resistance zone, mainly because the market is awaiting the release of the Federal Reserve minutes later today, along with Nvidia’s earnings report, expected after the stock market close. For now, investor anticipation has created a neutral sentiment in the index's recent movements as it approaches the 42,500-point resistance, and these upcoming events are likely to provide deeper insight into the market’s direction in the coming sessions.
Possible Bullish Channel
Since early April, the Dow Jones has shown consistent buying movements, attempting to maintain a potential bullish channel. So far, there have been no signs of significant bearish corrections in the price, which suggests that the current bullish pattern remains the dominant structure to monitor in the short term. However, a strong selling correction could put this trend at risk.
Neutrality Intensifies:
MACD: The MACD histogram continues to hover around the zero line, reflecting a sustained equilibrium in the momentum of the moving averages. This highlights a lack of clear direction in the market over the short term.
ADX: The ADX line remains below the 20 level, indicating that volatility is low, a condition not seen since February of this year.
Both indicators point to persistent neutrality, likely driven by market indecision ahead of key fundamental events, as well as the technical resistance zone, which is currently limiting price advances.
Key Levels to Watch:
42,500 points: Current resistance level aligned with the 200-period moving average. It may act as a potential point for bearish corrections.
43,800 points: A distant resistance level not seen since February. If the price rallies to this level, it could reinforce the current bullish formation and strengthen the prevailing upward channel.
41,100 points: A key support aligned with the 50-period moving average. A drop near this level could jeopardize the bullish formation and potentially shift momentum toward a bearish bias.
Written by Julian Pineda, CFA – Market Analyst

Dow Jones Index Local Short! Sell!
Hello,Traders!
US30 index keeps going up
But the price will soon hit
A strong horizontal resistance
Level around 42,876 from where
We will be expecting a local
Pullback and a move down
Sell!
Comment and subscribe to help us grow!
Check out other forecasts below too!
Disclosure: I am part of Trade Nation's Influencer program and receive a monthly fee for using their TradingView charts in my analysis.

DowJones INTRADAY corrective pulback supported at 41470Key Support and Resistance Levels
Resistance Level 1: 42920
Resistance Level 2: 43300
Resistance Level 3: 43620
Support Level 1: 41470
Support Level 2: 41160
Support Level 3: 40890
This communication is for informational purposes only and should not be viewed as any form of recommendation as to a particular course of action or as investment advice. It is not intended as an offer or solicitation for the purchase or sale of any financial instrument or as an official confirmation of any transaction. Opinions, estimates and assumptions expressed herein are made as of the date of this communication and are subject to change without notice. This communication has been prepared based upon information, including market prices, data and other information, believed to be reliable; however, Trade Nation does not warrant its completeness or accuracy. All market prices and market data contained in or attached to this communication are indicative and subject to change without notice.

DOW JONES Holding the 1D MA50 can propel it to 45000.Dow Jones (DJI) contained Friday's Trump-led pull-back just above its 1D MA50 (blue trend-line), marking the strongest correction since April 21. So far that is purely a technical reaction to the Resistance 1 (42855) rejection a day earlier.
This is forming an Inverse Head and Shoulders (IH&S) but above all, as long as the 1D MA50 holds, it is a bullish continuation of April's rebound/ Bullish Leg at the bottom of the long-term Bullish Megaphone pattern and on the 1W MA200 (red trend-line).
As you can see, the 1W MA200 has been the ultimate Support of this pattern and last time it started a rebound that broke above the 1D MA50 and retested it, was on the first Bullish on November 09 2023.
That pull-back held the 1D MA50 and the price action continued the bullish trend until it completed a +23.69% rise, before the next 1D MA50 break.
As a result, as long as the 1D MA50 holds, we expect at least another +23.69% rise on the medium-term, which this times falls on the Resistance 2 level (45100), aligning perfectly for a technical test. Our Target will be a little lower at 45000.
-------------------------------------------------------------------------------
** Please LIKE 👍, FOLLOW ✅, SHARE 🙌 and COMMENT ✍ if you enjoy this idea! Also share your ideas and charts in the comments section below! This is best way to keep it relevant, support us, keep the content here free and allow the idea to reach as many people as possible. **
-------------------------------------------------------------------------------
Disclosure: I am part of Trade Nation's Influencer program and receive a monthly fee for using their TradingView charts in my analysis.
💸💸💸💸💸💸
👇 👇 👇 👇 👇 👇

US30 - At Resistance? Holds or not??#US30 #DOWJONES - market just reached near to his current resistance region.
And if market hold it in that case we can expect a drop from here.
So don't be lazy here and only short below that.
Note: we will go for cut n reverse above region on confirmation.
Good luck
Trade wisely

May 26 US30Let's get to work... Price at the moment is trending down, creating lower highs and lower lows on the 4hr. However it broke structure on the 1hr and is trending upward.
I'm going to wait for price to get to 42,055 level and wait for it to break and retest for a buy or break structure for a sell.
Caution. Monday is a holiday so I most likely won't trade until Tuesday.
And ultimately whichever way price goes I'm going to get out at my net key level.
Have fun, stay safe and enjoy your journey
Stock Markets, Gold, Silver: Run With The Bulls!In this Weekly Market Forecast, we will analyze the S&P 500, NASDAQ, DOW JONES, Gold and Silver futures, for the week of May 25 - 31st.
The Stock Markets are bullish, so run with valid buy setups when they form.
Gold and Silver are relatively strong. With tensions in Gaza and Iran, this is expected. Valid buys should be taken.
Crude Oil is a tad bearish due to US inventories, so valid sells are warranted in the short term.
Enjoy!
May profits be upon you.
Leave any questions or comments in the comment section.
I appreciate any feedback from my viewers!
Like and/or subscribe if you want more accurate analysis.
Thank you so much!
Disclaimer:
I do not provide personal investment advice and I am not a qualified licensed investment advisor.
All information found here, including any ideas, opinions, views, predictions, forecasts, commentaries, suggestions, expressed or implied herein, are for informational, entertainment or educational purposes only and should not be construed as personal investment advice. While the information provided is believed to be accurate, it may include errors or inaccuracies.
I will not and cannot be held liable for any actions you take as a result of anything you read here.
Conduct your own due diligence, or consult a licensed financial advisor or broker before making any and all investment decisions. Any investments, trades, speculations, or decisions made on the basis of any information found on this channel, expressed or implied herein, are committed at your own risk, financial or otherwise.

Apple losing $3Trillion clubNASDAQ:AAPL lost a fair amount of market share this week.
Coming under pressure from comments by Trump and tarrif news.
Apple seems to be a target for the president despite him answering a call on live TV today using an Iphone...kinda ironic.
Apple could easily chop in this 9% range before it makes a definitive move.
I lean more bullish since we're testing the lows of the trade range.
If Apple holds here it could be forming a right shoulder for a very bul,ish inverse head and shoulder pattern.

DOW JONES Inverse Head and Shoulders starting new rally.Dow Jones/ US30 has found support today on its 1day MA50 despite the strong correction.
The long term pattern is an Inverse Head and Shoulders and today's 1day MA50 hold may complete its Right Shoulder.
Go long and target the 2.0 Fibonacci extension at 50000.
Follow us, like the idea and leave a comment below!!

Dow Jonas - Elliot wave📉 DJI — Elliott Wave Top in Sight?
🔍 A long-term analysis with serious implications...
I've been diving deep into the Dow Jones Industrial Average (DJI), using Elliott Wave principles — and what I see may signal the end of one of the longest bull markets in history.
Elliott was right — the massive bull cycle did arrive and extended well into the 2000s. But now, that journey looks to be nearing its final destination.
Currently, I believe we're witnessing the development of an Ending Diagonal pattern — a structure often seen at the end of a major impulse. This formation appears to be completing a set of blue sub-waves, which in turn cap off the larger green primary impulse wave.
📍 The box marks my anticipated top for the DJI. From this point, I expect a strong reversal and the beginning of a major correction.
Now here's the shocking part:
If this correction plays out in time and reaches the Fibonacci 0.382 level, that would suggest a retracement spanning up to 86 years — yes, 86 years.
This isn’t just about markets anymore — such a scenario could carry massive consequences for the global economy and society as a whole.
If, however, we see a strong breakout above the box, then the ending diagonal thesis would be invalidated, and we might instead be witnessing an extended wave 5 — complete with five internal sub-waves.
But either way — the top is coming. It’s just a matter of when, and how hard we fall.
💬 What are your thoughts? Could we really be on the edge of a generational peak?

Things are looking UPSUnited Parcel Service served as one of our canaries in the coal mine, signalling that the real economy was much weaker than what the Biden administration was reporting. The figures presented were positively skewed, masking the harsh reality that we were all facing difficult times.
We recognized the head and shoulders topping pattern and warned that an economic disaster was approaching us. This ultimately led to the Trump tariff panic that caused the collapse of equities.
The thesis indicated a lack of confirmation regarding rising index prices; however, consumers were feeling the pressure, which manifested in reduced consumption and, consequently, fewer deliveries.
A modern Dow Theory if you will.
As we near new peaks in the stock market, I am convinced that our economy is on a much more solid foundation, poised to benefit Main Street instead of just a handful of monopolistic tech giants. Since equities are forward-looking, stocks are anticipating an exhilarating 2026!
I believe UPS will confirm this economic recovery as we head towards my long anticipated and forecast DOW JONES price of 64,000 likely by 2030.

Potential bearish drop?Dow Jones (US30) is rising towards the pivot, which lines up with the 61.8% Fibonacci retracement and could drop to the 1st support.
Pivot: 42,435.88
1st Support: 41,294.81
1st Resistance: 43,025.39
Risk Warning:
Trading Forex and CFDs carries a high level of risk to your capital and you should only trade with money you can afford to lose. Trading Forex and CFDs may not be suitable for all investors, so please ensure that you fully understand the risks involved and seek independent advice if necessary.
Disclaimer:
The above opinions given constitute general market commentary, and do not constitute the opinion or advice of IC Markets or any form of personal or investment advice.
Any opinions, news, research, analyses, prices, other information, or links to third-party sites contained on this website are provided on an "as-is" basis, are intended only to be informative, is not an advice nor a recommendation, nor research, or a record of our trading prices, or an offer of, or solicitation for a transaction in any financial instrument and thus should not be treated as such. The information provided does not involve any specific investment objectives, financial situation and needs of any specific person who may receive it. Please be aware, that past performance is not a reliable indicator of future performance and/or results. Past Performance or Forward-looking scenarios based upon the reasonable beliefs of the third-party provider are not a guarantee of future performance. Actual results may differ materially from those anticipated in forward-looking or past performance statements. IC Markets makes no representation or warranty and assumes no liability as to the accuracy or completeness of the information provided, nor any loss arising from any investment based on a recommendation, forecast or any information supplied by any third-party.

US30/Dow Jones Trade IdeaThis is what I believe could be cooking up currently on US30... A possible buyers control might be coming up the coming days as it looks like price is possibly heading for HTF FVG.
Remember this is just a trade idea and nothing is completely guaranteed to play out the way I'm anticipating... Following this trade idea will be on your own risk!
#us30 #dowjones #indices #nasdaq #german30 #dax

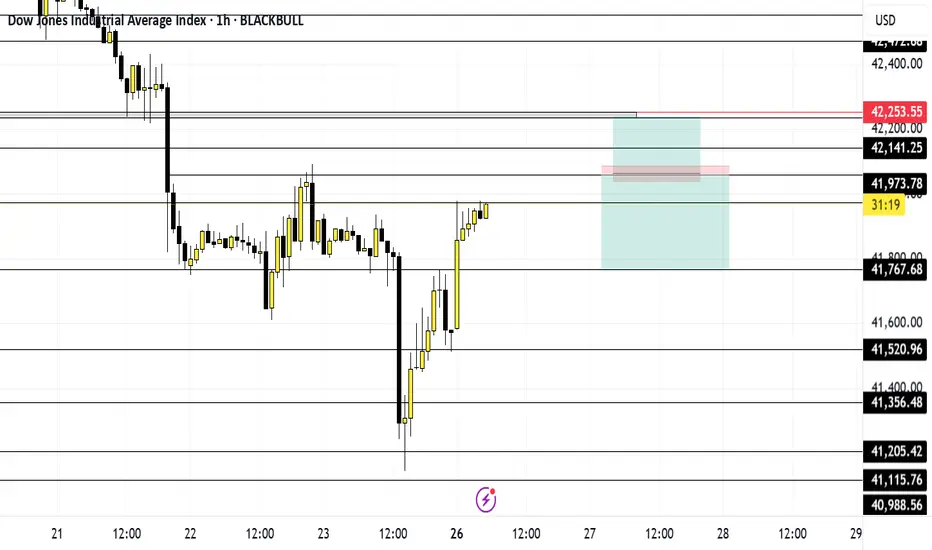
DOW JONES INDEX (US30): Your Plan to Buy Explained
There is a high chance that US30 will resume growth soon.
The index is currently testing a wide daily support cluster.
My signal to buy will be a bullish violation and a candle close above
41920 minor horizontal resistance.
A bullish movement will be anticipated at least to 42200 level then.
❤️Please, support my work with like, thank you!❤️
I am part of Trade Nation's Influencer program and receive a monthly fee for using their TradingView charts in my analysis.

Dow Jones Short Term Sell Trading PlanM15 - Strong bearish momentum
Lower lows on the moving averages of the MACD indicator.
Until the two Fibonacci resistance zones hold I expect the price to continue lower further.
If you enjoy this idea, don’t forget to LIKE 👍, FOLLOW ✅, SHARE 🙌, and COMMENT ✍! Drop your thoughts and charts below to keep the discussion going. Your support helps keep this content free and reach more people! 🚀
--------------------------------------------------------------------------------------------------------------------
Disclosure: I am part of Trade Nation's Influencer program and receive a monthly fee for using their TradingView charts in my analysis.

VIX SPY500 forecast until end of June 2025VIX S&P500 Index is in reversal. Downward movement has ended. Uptrend is starting now. All the way until end of June 2025 VIX will grow and steadily and surely.
Bottom is now at 18.18 and possible interim top is at 36.54
This view is supported by my forecast of S&P500 for June 2025.
For more updates on 1D chart click social media links in my profile.

Dow Jones INTRADAY supported at 41900Geopolitical Risk: Oil prices spiked after CNN reported Israel may strike Iran’s nuclear sites, increasing market uncertainty. No final decision confirmed yet.
Rising geopolitical tension could weigh on risk sentiment and equities.
Safe-Haven Moves: The Swiss franc and Japanese yen strengthened as investors moved to safety. Reflects cautious tone in global markets, possibly limiting upside for equities.
Morgan Stanley View: Strategists recommend “Buy America” – but not the US dollar, hinting at confidence in US assets (e.g., stocks), while expecting further USD weakness.
Bond Market Shift: Traders expect long-term US bond yields to rise, which could pressure tech and growth stocks in equity indexes like the Nasdaq.
UK Inflation Watch: UK inflation data expected to tick higher — adding to global inflation and rate hike concerns, which may influence market mood.
Trading Outlook:
US equity indexes may open mixed to cautious. Geopolitical risks and rising yields could create headwinds, especially for rate-sensitive sectors. Watch for oil-driven inflation fears, bond yield movements, and shifts in safe-haven flows.
Key Support and Resistance Levels
Resistance Level 1: 42950
Resistance Level 2: 43370
Resistance Level 3: 43630
Support Level 1: 41900
Support Level 2: 41500
Support Level 3: 41200
This communication is for informational purposes only and should not be viewed as any form of recommendation as to a particular course of action or as investment advice. It is not intended as an offer or solicitation for the purchase or sale of any financial instrument or as an official confirmation of any transaction. Opinions, estimates and assumptions expressed herein are made as of the date of this communication and are subject to change without notice. This communication has been prepared based upon information, including market prices, data and other information, believed to be reliable; however, Trade Nation does not warrant its completeness or accuracy. All market prices and market data contained in or attached to this communication are indicative and subject to change without notice.
