US30 Analysis 'SHORT' The analysis was done according to fractal analysis and high and low. You can also see the flag drawn above. According to Dow Jones analysis, it should touch two targets. In case of touch target1, I will update the analysis.
Dowjonesanalysis

I"M LOVING THIS US30 SETUP Seems toooo good to be true?
Taking short positions on US3 on RS and TL - follow for more

Dow Jones - DJI 20 March - 24 March Pair : Dow Jones - DJI30
Description :
Impulse Correction Impulse
Break of Structure
Flag Pattern
Bearish Channel in Long Time Frame and Short Time Frame as an Corrective Pattern
Divergence
Completed " 12345 " Impulsive Wave " ABC " Corrective Wave

US30, YM, DOW JONES 4H BUY predictions This is a 4H BUY Analysis of the Dow Jones:
Price can:
-Reach 32239 @ End of Tokyo.
-Fly to 32980 @ London open.
Happy Trading

Collapse Of The US Economy DOW AMERICA | Part Two
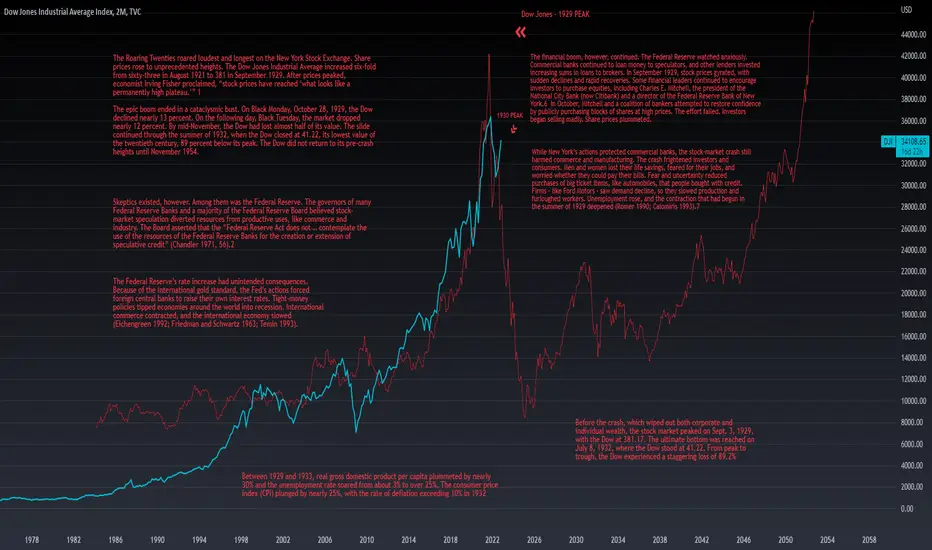
The Roaring Twenties roared loudest and longest on the New York Stock Exchange. Share prices rose to unprecedented heights. The Dow Jones Industrial Average increased six-fold from sixty-three in August 1921 to 381 in September 1929. After prices peaked, economist Irving Fisher proclaimed, “stock prices have reached ‘what looks like a permanently high plateau.’” 1
The epic boom ended in a cataclysmic bust. On Black Monday, October 28, 1929, the Dow declined nearly 13 percent. On the following day, Black Tuesday, the market dropped nearly 12 percent. By mid-November, the Dow had lost almost half of its value. The slide continued through the summer of 1932, when the Dow closed at 41.22, its lowest value of the twentieth century, 89 percent below its peak. The Dow did not return to its pre-crash heights until November 1954.
Skeptics existed, however. Among them was the Federal Reserve. The governors of many Federal Reserve Banks and a majority of the Federal Reserve Board believed stock-market speculation diverted resources from productive uses, like commerce and industry. The Board asserted that the “Federal Reserve Act does not … contemplate the use of the resources of the Federal Reserve Banks for the creation or extension of speculative credit” (Chandler 1971, 56).2
The Federal Reserve’s rate increase had unintended consequences. Because of the international gold standard, the Fed’s actions forced foreign central banks to raise their own interest rates. Tight-money policies tipped economies around the world into recession. International commerce contracted, and the international economy slowed (Eichengreen 1992; Friedman and Schwartz 1963; Temin 1993).
The financial boom, however, continued. The Federal Reserve watched anxiously. Commercial banks continued to loan money to speculators, and other lenders invested increasing sums in loans to brokers. In September 1929, stock prices gyrated, with sudden declines and rapid recoveries. Some financial leaders continued to encourage investors to purchase equities, including Charles E. Mitchell, the president of the National City Bank (now Citibank) and a director of the Federal Reserve Bank of New York.6 In October, Mitchell and a coalition of bankers attempted to restore confidence by publicly purchasing blocks of shares at high prices. The effort failed. Investors began selling madly. Share prices plummeted.
While New York’s actions protected commercial banks, the stock-market crash still harmed commerce and manufacturing. The crash frightened investors and consumers. Men and women lost their life savings, feared for their jobs, and worried whether they could pay their bills. Fear and uncertainty reduced purchases of big ticket items, like automobiles, that people bought with credit. Firms – like Ford Motors – saw demand decline, so they slowed production and furloughed workers. Unemployment rose, and the contraction that had begun in the summer of 1929 deepened (Romer 1990; Calomiris 1993).7
Before the crash, which wiped out both corporate and individual wealth, the stock market peaked on Sept. 3, 1929, with the Dow at 381.17. The ultimate bottom was reached on July 8, 1932, where the Dow stood at 41.22. From peak to trough, the Dow experienced a staggering loss of 89.2%
Between 1929 and 1933, real gross domestic product per capita plummeted by nearly 30% and the unemployment rate soared from about 3% to over 25%. The consumer price index (CPI) plunged by nearly 25%, with the rate of deflation exceeding 10% in 1932
20 Reasons for buy US30 Dowjones 🔆MULTI-TIME FRAME TOP-DOWN ANALYSIS OVERVIEW☀️
1:✨Eagle eye: Super Bullish and already swept multiyear Liquidity NO weakness here back to back High
2:📆Monthly: The bulls Are so much in power After form, and Valid Hidg prices Are Also confirmed Valid low to And making a Monthly Flag type pattern A continuation sign toward the upside
3:📅Weekly: After a Choch price, we cannot break the previous Pullback and take more robust Support here. also, a weekly FVG and OB
4:🕛Daily: A valid Higher Low and a Proper wick off Spring After tab Daily OB here a strong bull reversal patterns also appeared, so we need to seek only buy entries from here
😇7 Dimension analysis
🟢 analysis time frame: H4
5: 1 Price Structure: Sideways after a bearish Trap On recent low
6: 2 Pattern Candle/Chart: Bouble Bottom, Bearish TRap, Sharinking Candle, Move Start with Gap ups, and also makes a poll and flag type pattern here everything BUllish
7: 3 Volume:
8: 4 Momentum UNCONVENTIONAL Rsi: Taking resistance on 60 levels that indicate just for sometime price may halt here, and complete flag patterns on h4 but may not go down 33310 level because here h4 FVG a strong support
9: 5 Volatility measure Bollinger bands: even it on above middle band after a w pattern, but we need a strong upside breakout or proper structure even on 1min tf
10: 6 Strength ADX: DMi cross bulls are in strength right now
11: 7 Sentiment ROC: USD is weaker indices are stronger
✔️ Entry Time Frame: 15M
12: Entry TF Structure: bullish and retest their 1st OB also make a bullish momentum candle
13: entry move: just impulsive move is started
14: Support resistance base: 15 min ob Support
15: FIB: trigger event occurred, and even the trend line also broke
☑️ final comments: Buy
16: 💡decision: Buy
17: 🚀Entry: 33433
18: ✋Stop losel: 33299
19: 🎯Take profit: 34167
20: 😊Risk to reward Ratio: 1:5
🕛 Excepted Duration: 4 day

Dow Jones: Periscope 👀Like a periscope, Dow Jones is craning its neck upwards, watching waves v in orange and (i) in blue unfolding before its eyes. To finish the current movement, the index should climb above the resistance at 35 521 points but ideally stop just short of the next mark at 36 446 points. Wave (ii) in blue should then lead Dow Jones decidedly back below 35 521 points. A 35% chance remains, though, for the index to turn downwards and to drop below the support at 28 635 points. In that case, Dow Jones would develop a new low in the form of wave alt.iv in magenta first before heading upwards again.

DJ30This CFD will be clime to 33475.1. but may be get in long times such as days. we can buy and hold

DJ30 Technical trend The price move in channel. we can scalp between H&L line of that .So it will be signed drop in 1D, W.
I see DJ30 can shoot to 31896
Sell and injoy do right 👍

us30 decline from 71% to -37% of yesterdays price displacementus30 is going to drop more than 330 points to erase yesterdays rally. Give me a follow if it pans out correctly.

US30 Short-Term Bullish AnalysisClick on Boost (like) to support these free analyses
This expectation is a framework to look for a potential trading setup; I recommend you to not just execute based on these levels. I always wait for confirmations on lower timeframes
This Analysis was done using my complete Strategy which includes:
- Smart Money Concepts
- Multi Timeframe Liquidity and Market Structure
- Supply And Demand
- Auction Theory
- Volume Analysis
- Footprint
- Market Profile
- Volume Profile
- Wyckoff
- Etc.

US30The best choice now is to wait for the valuable chances,
Take a look at the Buy and sell areas..
CURRENCYCOM:US30

DOW Jones Buy or Sell ?Pair : US30 ( DJI - Dow Jones )
Description :
Impulse Correction Impulse
Completed " 1234 " Corrective Pattern
Divergence
S / R Level
Symmetrical Triangle as a Corrective Pattern need to wait until it Breaks the Upper or Lower Trend Line

Dow Jones: Friday Feels 🍾After moving sideways, the Dow Jones should finally commit to dropping to the orange target zone. Within 32 401 and 31 689 points, the Index should hit the corrective low of the orange wave iv, which would turn the trend back North. On that note, we expect the course to rise above the resistance line at 34 707 in order to complete the blue wave (i). In our alternative scenario with a probability of 45%, the Dow Jones could exceed the resistance mark at 34 707 points right away, without dropping into a correction beforehand.

DOW JONES FORECAST FOR END OF JANUARY 2023My previous idea on Dow Jones Industrial Average Index was Bearish Continuation (Looking for new low).
Here's an alternative for bull run.

AW Dow Jones - ASX Analysis - 2022 Bear Market Not Over Yet...In this fast-paced analytical video from down under we cover the chart from left to right up and down...
In a nutshell I had a major revelation when it comes to what is going on in these two markets across the futures and market hours charts.
I see some strange things, but it leads to opportunity...
Just when you thought it was safe to put on a long position on the index it seems like a fake out wave in the making.
The move up is not over yet but it's very close.
In this video I aim to demystify the movements which have taken place over the last two years and what is going on right now.
Say goodbye to 20 minutes of your life as you hear me talk at a hundred miles per hour, so I don't lose my train of thought and hopefully your attention.
Well, it's worth a try!
Remember to use Disciplined Money Management Principles to ensure longevity as a trader.
If you don't know the long term pattern shouldn't you be doing your research instead of just following the crowd?
Just remember: I am not a financial adviser; I suggest using this only as a guide. Always do your own research.
***AriasWave is not the same as Elliott Wave so your counts may differ to mine if you happen to use it.***

Dow Jones Analysis 25.01.2023Hello Traders,
welcome to this free and educational analysis.
I am going to explain where I think this asset is going to go over the next few days and weeks and where I would look for trading opportunities.
If you have any questions or suggestions which asset I should analyse tomorrow, please leave a comment below.
I will personally reply to every single comment!
If you enjoyed this analysis, I would definitely appreciate it, if you smash that like button and maybe consider following my channel.
Thank you for watching and I will see you tomorrow!
You can also check out my previous analysis of this asset:

DJIA Monthly Chart ReviewToday you can review the technical analysis idea on a 1M linear scale chart for the Dow Jones Industrial Average Index (DJI).
In the chart, I added in the RSI as well as review the Great Recession history to get an idea of where the DJI is headed. It seems that the DJI has been moving up an ARC with a possibility to come down and touch it again. It is currently inside a descending channel . If DJI price falls as much as it did during the Great Recession, it could come down to the $18K level where there is strong support. The RSI could support that type of drop as it is no where near the oversold region.
This is presented on the monthly chart so please have patience.
If you enjoy my ideas, feel free to like it and drop in a comment. I love reading your comments below.
Disclosure: This is just my opinion and not any type of financial advice. I enjoy charting and discussing technical analysis . Don't trade based on my advice. Do your own research! #millionaireeconomics

DowJones is expected to move down in US SessionWith an resistance at 34350-34400 Dow is likely to move downish side.

AW Dow Jones Analysis - So Which is it? Up or Down Right Now?This video aims to answer the question of timing and direction.
Using my last 2 videos as evidence I make a call on this.
Mind you though, those 2 videos are the results of many other videos.
I have presented many views and concluded with what is now the most likely scenario.
This is an important juncture in the Dow Jones because all we will see is 5-Wave Moves in each direction from here on out.
According to my views and opinions which I have presented in full over the last couples of weeks.
Now it is up to you to make up your mind.
I encourage you to learn the waves because it helps you gain a better understanding and perspective on the markets.
Even if it does take a lot of work. It's worth it.
Check out all related ideas down below.
Remember to use Disciplined Money Management Principles to ensure longevity as a trader.
If you don't know the long term pattern shouldn't you be doing your research instead of just following the crowd?
Just remember: I am not a financial adviser; I suggest using this only as a guide. Always do your own research.

AW Dow Jones Analysis - Lotta Ups and Downs In Trading...Bad, dad joke, I know.
In this video I incorporate the thinking that the US Dollar may be looking for another high.
If it does, then one should question the setup and critique the lack of retracement versus the weakness at the small degree.
Something doesn't add up here...
Everything looks right but the markets always find a way to make you wrong.
Thats why I need to take the time to consider the possibilities as always and bring you more ideas.
I don't want you to follow me blindly, I want you to think for yourself.
If you have already started to label the waves the AriasWave way, that means that you have already seen the light.
Remember to use Disciplined Money Management Principles to ensure longevity as a trader.
If you don't know the long term pattern shouldn't you be doing your research instead of just following the crowd?
Just remember: I am not a financial adviser; I suggest using this only as a guide. Always do your own research.

Us dow jones ideaDow Jones made some successive bottoms that seem higher than the previous
It seems to be bullish , it penterated the resistance level at 33474 ,
Now it is the time to test this resistance again that converted into support .
It is a short trade so keep the stop at 33800 .
If you liked this idea boosta and follow >
keep stop please

AW Dow Jones Analysis - The Bigger Picture - Forecast Chart...This chart is presented in association with the video idea linked below in related ideas.
This chart is a thesis developed using AriasWave in order to determine the likely ending to this move up since The Great Depression.
A series of booms and busts contained withing a range will be the result of continued modern monetary policies.
There are very good reasons why this will happen from a technical standpoint.
One main reason is that you can only stretch a zig-zag so far before it snaps back correctively in order to complete the pattern.
We are around the mid point of some of the most extremely stretched out zig-zags possibly in all of history that will result in a series of booms and busts.
As the markets struggle to find any real support during these times they will simply oscillate violently over long periods of time.
If this analysis is accurate then the whole move up since 1932 is just one big giant zig-zag Wave B bubble that still has a way to go.
One can only imagine what will happen when this gigantic Wave B finally ends.
Most of us likely won't be around to see it happen.
Remember to use Disciplined Money Management Principles to ensure longevity as a trader.
If you don't know the long term pattern shouldn't you be doing your research instead of just following the crowd?
Just remember: I am not a financial adviser; I suggest using this only as a guide. Always do your own research.
