Dowjonesanalysis

New stimulus package? DOWEveryone is expecting a crash, dow touched perfectly the 0.618 fib, will it bounce?


DOW JONES Prediction: Ring the bell, we're calling the TOP!On the 3rd of August we sent the following chart to our members:
We don't want to brag, but DAMN, this is too good to be true! We never thought we can predict how the price will move EXACTLY in the future, but It seems like we just did😱
Look at the prediction (light blue) line we drew on the chart on August 3 ... The price and candles are following our prediction to the ABSOLUTE PERFECTION🤯
If our analysis and prediction holds, then we might also call it now: we are extremely close or we are actually at the TOP of the MARKETS.
So expect downhill movement to start anytime next week(s). ⏳

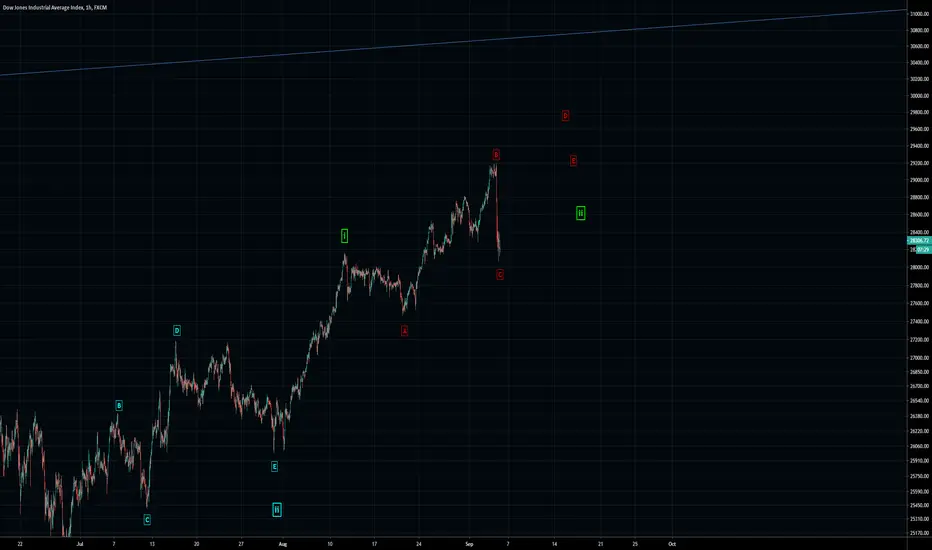
DOW JONES - Wave Revision - Green Wave ii still in progressIt appears we are seeing an extremely choppy end to this trend.
What appears to be a C Wave has just occurred.
Some patience is needed whilst we wait for a D and E wave to occur before re-entering this market.
----------------------------------------------------------------------------------------------------------------------------------------------
Just a reminder to please not blindly follow my ideas and get mad when it doesn't work out.
What about when it does work out and you make profits?
The key here is to learn how to read these waves, I provide all the info on my channel.
A better approach is to have your own analysis and then compare with mine.
Share ideas and leave comments. As we get better at identifying these waves with patience our analysis will improve and so will the profits.
Don't forget money management, keep your bets small.
Once again do not blindly follow my ideas and only get happy when the trades work out for you.
What happens if I stop posting tomorrow? Will you blindly follow others etc? You would be setting yourself up for disappointment.
Please LIKE and FOLLOW to get notification of updates and future posts.


DOW JONES - Wave Revision Based On Anecdotal EvidenceLet's take a look at a few things in play here to realize a logical objective.
Yes we are still bullish the DOW JONES but there are couple things we need to discuss.
See previous ideas to understand how we got here.
Please LIKE and FOLLOW to get notification of updates and future posts.

DOW JONES - Target Reached - Now Watch For ThisCheck out this victorious update. Congratulations if you rode this up.
Now watch for this.
Please LIKE and FOLLOW to get notification of updates and future posts.

DOW JONES - Wave Analysis - Wave 2\3 Price Action RetracementsIn this video we quickly examine expected retracements after Wave 2 has completed.
We want to capture some profits so that we can re-enter the trade with less risk.
See related idea below.
Please LIKE and FOLLOW to get notification of updates and future posts.

dowjonesHello traders, here is the analysis from our team :
sell:27517
TP@; 27507
TARGET: 27467
stop: 27567
we take money management from
27507 as profit area on up.
Let us know in the comment section below if you have any questions.😉

Dow Jones BullishAs we see on the chart last week's candle is bullish. I expect this week or next price to reach All Time High.

DOW JONES - Wave\Target Revision - Wave 5 of 5 In Progress.Check out this important update.
I have been working hard on long-term analysis across all markets.
I will be posting more during the week.
Please LIKE and FOLLOW to get notification of updates and future posts.


DJI Showing Me The Money. Tipping Point?Day 3 of holding a big boy short on the dow and everything is going as planned.
Ema dots, custom rsi, custom candles all red shifting trend.
If this is wave 5 I think we should be in for a good size selloff.
This is a daily chart. Would love to see this close red.
How are your trades going?

🚨 Critical. Lord Almighty! Pay Attention To The Market Now! 💰3rd daily red with the 2 day now displaying very tight compression off major Resistance level at previous high.
Since bottom recovery of pandemic collapse each buy impulse has got shorter with less momentum.
Could be buyers exhaustion. If double top plays out this will be juicy.
Stay safe out there boys and gals.

DOW JONES - Wave Revision - Tracking Waves With PrecisionCheck out this awesome update on the Dow Jones where I lay it all out for you wonderfully.
You better make some profits so you can trade what is around the corner.
Please LIKE and FOLLOW to get notification of updates and future posts.

DJI/ Dow Jones is about to go hit 27.200$ by the end of the weekDJI/ Dow Jones is about to go hit 27.200$ by the end of the week
What do you think guys ?

dowHello traders, here is the analysis from our team :
We feel; These area's. Will give best results for scalp buys, Or Sells.
#1 Buy@ 26601
* Futures sometimes run in one direction during Day. *
So. If no Momentum, Or pullback in these area's for 7/27/2020.
Void trade. We like 130 pip Sl/Target. Take profit 5 to 130 pips, Move
STOP LOSS UP WHEN YOU CAN.
Let us know in the comment section below if you have any questions.😉

DOW JONES - Conceptual Thinking - Breaking Down The WavesJust some thoughts on the DOW JONES pattern.
Take this with a grain of salt.
I like putting information out there to see if I can stimulate some thinking.
I think a lot of the time we expect to see news related events reflected in the markets which can hinder judgement.
Please LIKE and FOLLOW to get notification of updates and future posts.

DIA Gravity Center with too much respect Well here is another opinion that can tell the story of the DOWJONES STOCK,
in the weekly analysis we can tell that there is a high probability that the market will go down to test the green trend values,
Please share with me your thoughts,
Kind regards.

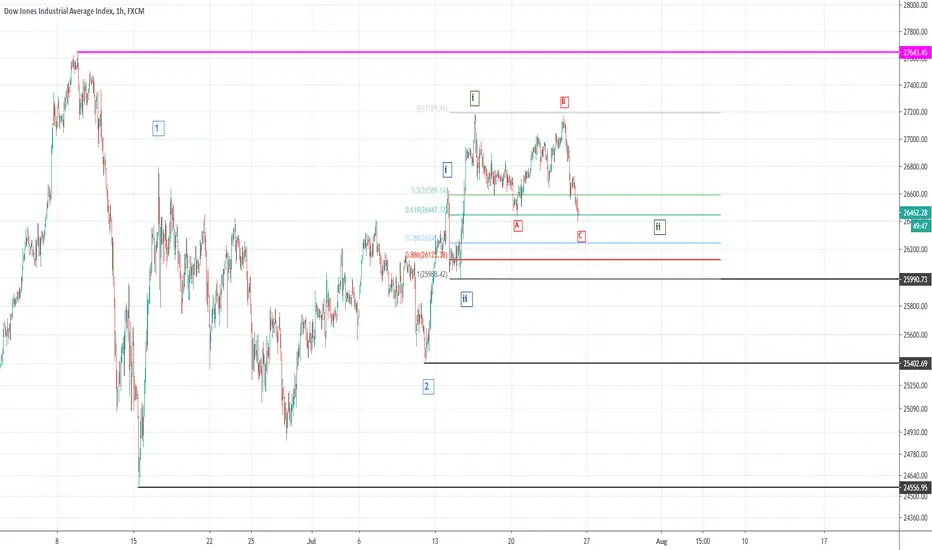
DOW JONES - Wave Revision - Green Wave ii in ProgressAt this point in time I am bullish on the DOW JONES and I believe we are part way through a correction of Green Wave ii.
Although we still need to see Waves D and E the C Wave look complete at the .619 retracement.
Depending on the D Wave and whether or not it is an expanded D the breaks above the end of Green Wave i this could be a good place to go long.
Stop: 25,990
So depending on how the D wave plays out this could be a good chance to trade a zig zag.
Please LIKE and FOLLOW to get notification of updates and future posts.
DOW JONES 30Multiple harmonious efforts putting by congress and president to keep positive i.e, financial package, zero rate interest since lehman crisis, mortgage loan concern and OPEC meeting. All these keeps up healthier this week, but how long this may impact.
Employees filling for jobless registration, now data will reached 15% in April-2020, Outpur shortage, oil storage has been almost fulled, consumption has been reduced drastically.
Conclude : Market will retrace it again down path, until any curb in patients or antidote.
