US30 Swing Short!
HI,Traders !
#US30 keeps falling down
And the index broke the
Key wide horizontal level
Around 43924.6 which is now
A resistance and the breakout
Is confirmed so we are very
Bearish biased and we will
Be expecting a bearish
Continuation on Monday !
Comment and subscribe to help us grow !
Dowjonesindustrial

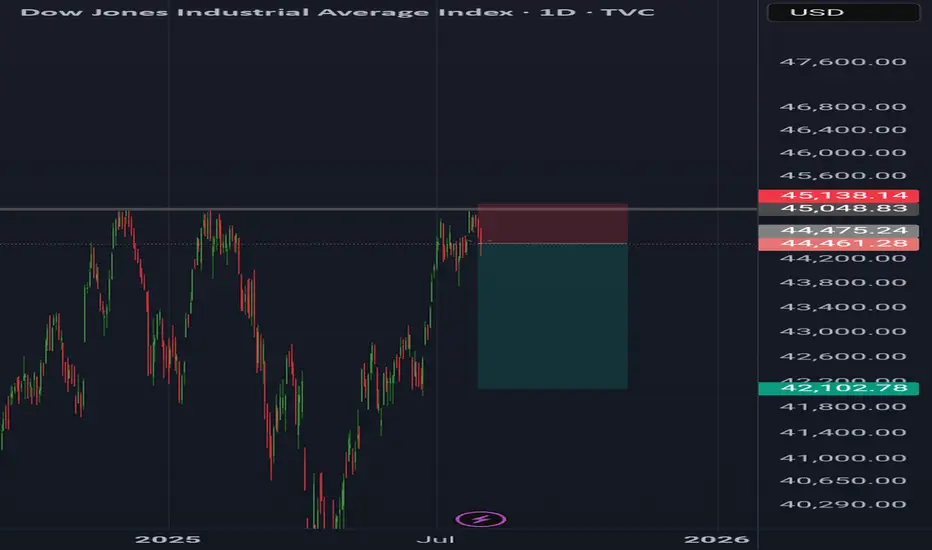
Dow jonesDow Jones daily analysis
Time frame daily
Risk rewards ratio >3.5
Short position
Because price couldn't break the 45.048 again and earthquake in 5he east of Russia and Japan makes the markets drop down
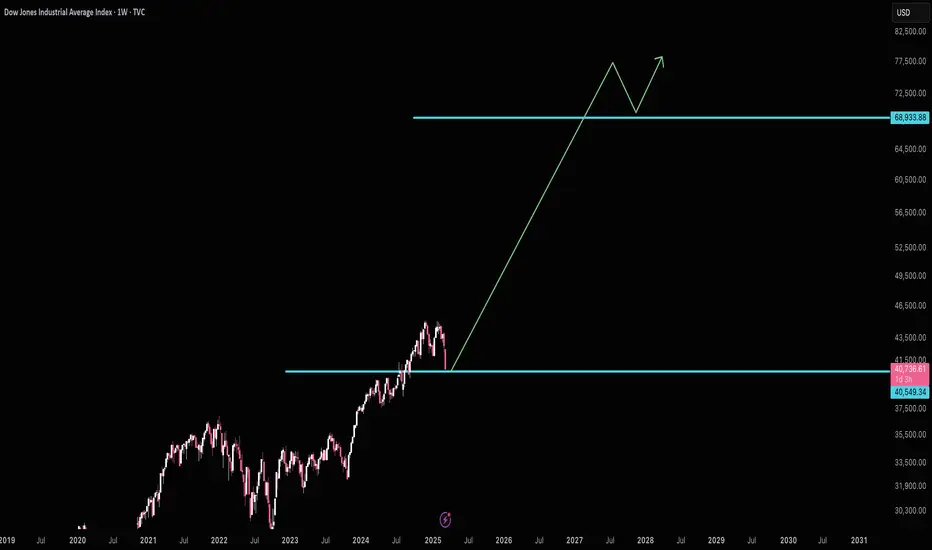
Dow Jones -> A breakout rally of +40%!🐂Dow Jones ( TVC:DJI ) will create new highs:
🔎Analysis summary:
Since the April lows, the Dow Jones already rallied about +25%. This was simply the expected rejection away from a strong confluence of support. Now, the Dow Jones is sitting at the previous all time highs and about to break out, leading to a massive rally.
📝Levels to watch:
$45.000, $60.000
🙏🏻#LONGTERMVISION
Philip - Swing Trader

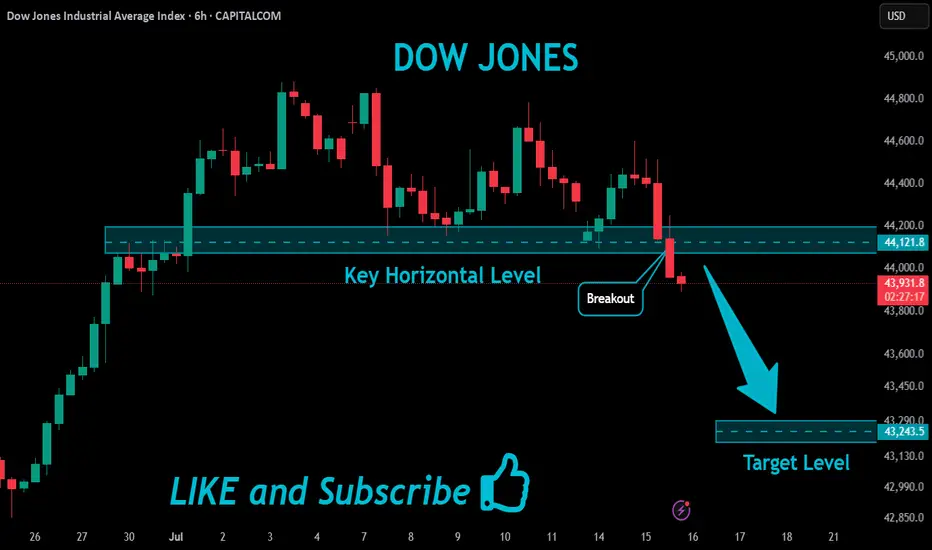
US30 Bearish Breakout!
HI,Traders !
#US30 index is trading in a strong downtrend,
and has broken through the key horizontal
level at 44121.8, reinforcing our bearish
outlook. We expect further declines !
Comment and subscribe to help us grow !
Market Mood Sours as Inflation Surprises AgainU.S. stock markets were under pressure on Tuesday after new inflation data came in higher than expected. This has made investors rethink how soon the Federal Reserve might cut interest rates.
What Happened?
● The Consumer Price Index (CPI) recorded its biggest monthly rise in 5 months.
● Core inflation (which excludes food and energy) jumped by 2.9% compared to last year — more than the Fed's 2% target.
What It Means
● Investors had expected the Fed to cut interest rates multiple times in 2025.
● After the inflation report, they now think the Fed will cut less than expected.
● The chances of a rate cut in September also dropped sharply.
Market Impact
● Bond yields went up — the 10-year U.S. government bond yield rose to 4.49%, making borrowing more expensive.
● Stock futures fell (Dow, S&P 500, Nasdaq), as higher yields tend to hurt company profits and stock prices.
S&P 500 and Dow Struggle at Resistance
● Both the S&P 500 and Dow Jones faced resistance near all-time highs.
● This rejection suggests potential for further short-term pullback, especially if macro pressures like inflation and rate uncertainty persist.
Near-Term Outlook
With inflation running hotter than expected, hopes for early Fed rate cuts have cooled. Traders and investors should remain cautious, manage risk actively, and prepare for continued volatility in the coming weeks.

Dow Jones Extends Rally Toward New HighsOver the past two trading sessions, the Dow Jones Industrial Average has gained nearly 1%, approaching the all-time high zone near 45,000 points. For now, the bullish bias remains intact, supported by the Federal Reserve’s announcement that a rate cut may occur later this year, despite renewed concerns over a potential reignition of trade war tensions. If buying pressure holds in the short term, this could fuel further upward momentum, potentially pushing the index to new record levels.
Consistent Uptrend
The recent bullish swings have sustained a steady level of investor confidence, allowing the upward trend to remain unbroken. So far, there hasn’t been any significant selling correction strong enough to break the structure, meaning the dominant long-term uptrend remains intact. This continues to be the most important technical pattern to monitor, although the index is once again testing previous highs, where short-term selling corrections may emerge.
Technical Indicators
RSI: The RSI line is hovering near the overbought level around 70, suggesting that buying momentum has created an imbalance in market forces. This may open the door to a potential technical pullback as the index approaches historical highs.
ADX: The ADX line continues to rise above the neutral 20 level, maintaining a steady upward slope in recent sessions. If this trend continues, it could indicate increasing strength behind the current uptrend, especially if key resistance levels are broken.
Key Levels:
44,970 – Major Resistance: This level marks the all-time high and serves as the most important short-term resistance. A breakout above it could strengthen the bullish bias, open the door to new record highs, and further confirm the ongoing uptrend.
43,863 – Intermediate Support: A technical indecision zone seen in late February. A drop below this level may trigger a period of short-term neutrality or sideways movement.
42,756 – Critical Support: This zone aligns with the 50- and 200-period moving averages, making it a key technical area. A break below this level may signal the end of the current bullish trend and initiate a deeper correction.
Written by Julian Pineda, CFA – Market Analyst

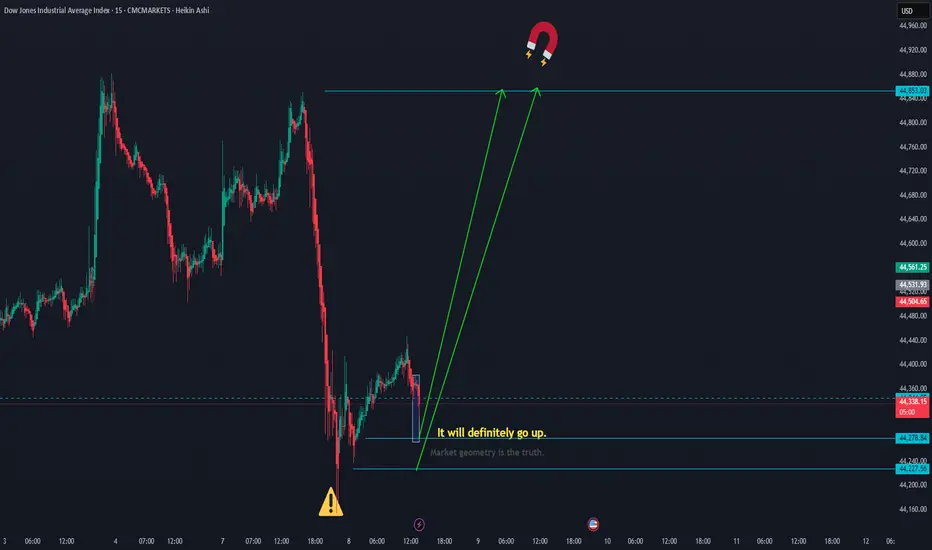
The dowjones should move upThe Dow Jones should move up to 44,853.
The levels 44,278.84 and 44,227.56 are good potential points for a bullish reversal. CMCMARKETS:US30
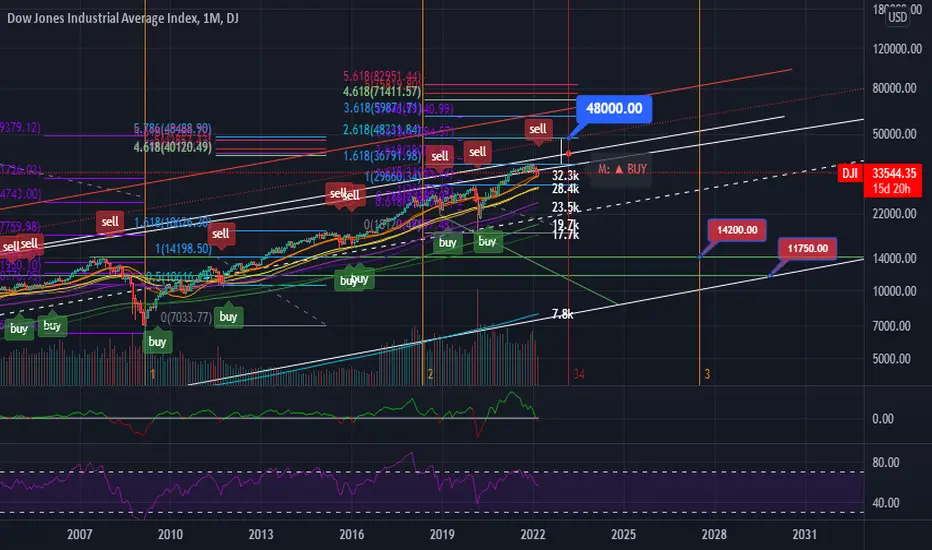
Dow Jones (DJI) Logarithmic Macro Outlook Log target: 48k
The dotted red line is adjusted for inflation. The stock market cycles are lengthening. Continued downside till EOM followed by a final melt-up rally that will bring the end of grand wave 5.
ETA: Q1 '23.
Market Heist in Progress! US30/DJI Long Trade – Ride or Escape?🔥 "The US30/DJI Heist: Bullish Loot & Escape Before the Trap!" 🔥
🌟 Hi! Hola! Ola! Bonjour! Hallo! Marhaba! 🌟
Dear Money Makers & Market Robbers, 🤑💰💸✈️
Based on the 🔥Thief Trading Style🔥 (technical + fundamental analysis), here’s our master plan to heist the US30/DJI (Dow Jones Industrial Average). Follow the strategy on the chart—long entry is the play! Aim to escape near the high-risk RED Zone (overbought, consolidation, potential reversal). The bears are lurking, so take profits and treat yourself—you’ve earned it! 💪🏆🎉
🚀Entry (The Vault is Open!)
"Swipe the bullish loot at any price!"
For precision, place buy limit orders within 15-30min timeframe (recent swing lows/highs).
Set alerts! Don’t miss the heist.
🛑 Stop Loss (Safety Net)
Thief-style SL at nearest swing low (3H timeframe) → 41,400 (adjust based on risk/lot size).
🏴☠️ Target 🎯: 44,200.00
Bullish momentum is fueling this heist—ride the wave but exit before the trap!
📰 Fundamental Backing (Why This Heist Works)
Macroeconomic trends, COT data, geopolitics, and sentiment align for bullish moves.
Full analysis? Check our bio0 linkk! 👉🔗🌎
⚠️ Trading Alerts (News & Risk Mgmt)
Avoid new trades during high-impact news (volatility = danger).
Use trailing stops to lock profits and dodge sudden reversals.
💥 Boost This Heist!
Hit 👍 (Boost Button) to strengthen our robbery squad!
More heists = More profits—stay tuned for the next steal! 🚀🤑
See you soon, fellow thieves! 🤝🎉

Dow Jones Approaches Two-Month Highs AgainThe Dow Jones index has started the week with a strong bullish bias, pushing the price up by more than 1% in the short term. This upward trend has remained solid despite growing military tensions in the Middle East. While the conflict caused significant volatility last week, markets have now digested the uncertainty, with CNN’s Fear and Greed Index remaining steady in the “greed” zone, showing no signs of retreating toward neutral territory. This suggests that confidence remains firm in the short term, allowing demand for risk assets like the Dow Jones to stay consistent in recent sessions.
However, it is important to note that the Dow has historically shown significant sensitivity to trade war developments. Although ongoing negotiations between the United States and China continue, the outcome regarding tariffs remains uncertain. If no agreement is reached, negative trade dynamics could resurface, triggering a renewed loss of confidence and possibly leading to sustained selling pressure in the long term.
Consistent Bullish Trend
Since early April, the Dow Jones has maintained a strong buying trend, with price movements consistently above the 40,000-point level. So far, there have been no major bearish corrections that would break this structure. However, the price is currently facing a key resistance level. If this barrier holds, it could mark the beginning of a corrective phase in the short term.
Technical Indicators:
RSI: The RSI line has begun to show a bearish divergence, as it records lower highs, while the Dow’s price posts higher highs. This reflects an imbalance in market forces, which may lead to short-term downside corrections.
TRIX: The TRIX line, which measures the momentum of exponential moving averages, remains above the neutral level (0), but has started to flatten, potentially signaling the beginning of a neutral phase, especially as the price tests resistance zones.
Key Levels to Watch:
42,700 points: A critical resistance zone, aligned with the 200-period simple moving average. A breakout above this level would strengthen the current bullish bias and help consolidate the uptrend.
41,900 points: A short-term support level, associated with a recent neutral zone. It could act as a barrier against downward corrections.
41,064 points: The final support, aligned with the 50-period simple moving average. A drop to this level could threaten the ongoing bullish trend.
Written by Julian Pineda, CFA – Market Analyst
Follow him at: @julianpineda25

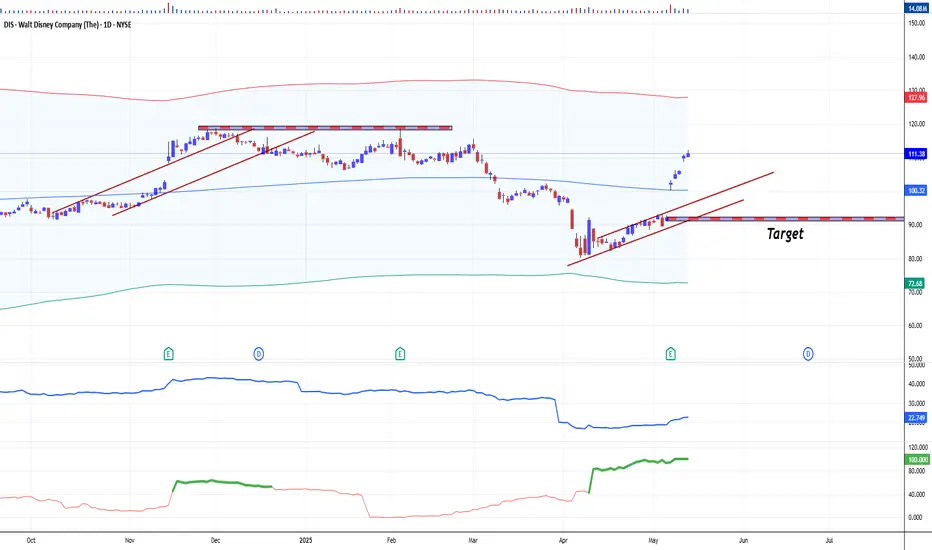
The Walt Disney Stock Future Goes 'Shining Bright as Never'The Walt Disney Company’s stock (DIS) has demonstrated robust performance following its Q2 2025 earnings release a week ago, with both fundamental and technical indicators reflecting positive momentum.
Here’s a detailed analysis:
Fundamental Perspective
Disney’s Q2 2025 results exceeded expectations, driven by strong execution across its entertainment, streaming, and experiences segments. Key financial highlights include:
Revenue Growth. Revenues rose 7% year-over-year (YoY) to $23.6 billion, surpassing estimates of $23.14 billion.
Profitability Surge. Adjusted EPS jumped 20% YoY to $1.45, beating forecasts of $1.20. Net income swung to $3.3 billion from a $20 million loss in Q2 2024.
Streaming Strength. Disney+ added 1.4 million subscribers (reaching 126 million globally), defying expectations of a decline. Combined Disney+ and Hulu streaming operations generated $336 million in profit, a sevenfold increase from $47 million YoY.
Guidance Upgrade. Disney raised its fiscal 2025 adjusted EPS forecast to $5.75 (up 16% YoY), citing confidence in double-digit operating income growth for entertainment and sports, and 6%-8% growth for experiences.
Growth Drivers:
Entertainment. Segment operating income rose $0.5 billion YoY to $1.3 billion, fueled by streaming profitability and box office success (e.g., Moana 2).
Experiences. Theme parks and consumer products saw higher attendance, guest spending, and cruise demand, though international parks faced headwinds in Shanghai and Hong Kong.
Strategic Initiatives. The upcoming Abu Dhabi theme park and ESPN’s direct-to-consumer launch are expected to drive long-term growth.
Technical Perspective
Disney’s stock firstly reacted positive to the earnings beat, reflecting renewed investor confidence:
Price Action. Shares surged 10-12% post-earnings, hitting an intraday high of $103.31. Over the past month, DIS gained 31%, including a 20% rally in five days.
Valuation. The stock trades at 18.4x forward earnings and 2.1x sales, a premium to industry averages but below its historical norms.
Analyst Sentiment. The average price target stands at $126.50 (14% upside), with a Street-high target of $148 (33% upside).
Technical Indicators:
Momentum. The breakout above key resistance levels (e.g., $100) signals bullish sentiment, supported by high trading volume.
Volatility. Beta of 1.01 aligns with market volatility, while short interest remains low at 1.24% of float.
Risks and Considerations
Macroeconomic Uncertainty. Disney acknowledged potential impacts from tariffs and global economic conditions.
Valuation Premium. While growth prospects justify some premium, prolonged macroeconomic stress could pressure multiples.
Investors challenge
Disney’s Q2 2025 results underscore its ability to execute on streaming monetization, theme park innovation, and content-driven growth.
Fundamentally, raised guidance and streaming profitability signal a turnaround, while technically, the stock’s breakout suggests locally bullish momentum.
Following historical patterns we are Bearishly tuned at this time, with targets to fill the gap at $92.17 per share (left after Earnings report), and drilling all the way below.
--
Best wishes,
@PandorraResearch Team
"US30 Heist Alert: Thief Style's Bullish Plan to Steal Profits!"🌟 Salut! Ciao! Hola! Konnichiwa! 🌟
Dear Wealth Raiders & Market Bandits, 🤑💰✈️
Here’s our slick *Thief Trading Style* heist plan for the **US30 / Dow Jones Industrial Average Cash** Index, crafted with sharp technicals and fundamentals. 💥 Stick to the chart’s long entry strategy and aim to slip out near the spicy Yellow ATR Zone—a risky, overbought level where bears and traps lurk. 🏆💸 *Grab profits and treat yourself, you’ve earned it!* 💪🎉
**Entry 📈**: The heist kicks off! Watch for a breakout above the MA line (42600.0) to jump in—bullish riches await! 🤑 Set *buy stop orders* above the MA or *buy limit orders* near the most recent 15/30-min swing low/high for pullback entries. 🚨 Set an *alert* to catch the breakout signal!
**Stop Loss 🛑**: Yo, thieves, listen up! 🗣️ For buy stop orders, hold off on placing that stop loss until the breakout confirms. 🔊 Place it at the 8H recent/swing low (40850.0) for day/swing trades. Adjust SL based on your risk, lot size, and number of orders. Play it smart, or it’s your loot on the line! ⚠️🔥
**Target 🎯**: Aim for 44500.0 or bail before the target hits. 🏴☠️
**Scalpers, eyes here 👀**: Stick to long-side scalps. Big bankrolls can dive in; smaller ones, join the swing trade heist. Use *trailing SL* to lock in your haul. 💰
💸 **US30 Market Heist Outlook**: The index is neutral but leaning bullish, fueled by key drivers. ☝ Check the fundamentals, macroeconomics, COT reports, geopolitics, sentiment, intermarket analysis, and future trend targets for the full score. 🌎🔗
⚠️ **Trading Alert: News & Position Management** 📰🚫
News can shake the market hard. To protect your loot:
- Skip new trades during news releases.
- Use trailing stop-loss orders to secure running profits.
💖 Boost our heist plan! 🚀 Hit that *Boost Button* to power up our robbery squad. With *Thief Trading Style*, we’re snatching profits daily. 🏆🤝 Stay sharp for the next heist plan! 🤑🐱👤🤩
---
### Latest Real-Time Data (UTC+1, May 16, 2025) 📊
*Data sourced from reliable platforms like Financial Juice and official market feeds.*
**Indices** 📈
- US30 (Dow Jones): 42580.0 | +0.18% 😊
- S&P 500: 5720.5 | +0.12% 😄
- NASDAQ 100: 20150.2 | +0.25% 😊
- FTSE 100: 8250.3 | -0.05% 😐
---
### Latest COT Data (Updated Friday, May 9, 2025) 📑
*Commitment of Traders (COT) report for US30/Dow Jones futures, sourced from CFTC.*
- **Non-Commercial (Speculators)**:
- Long: 45,200 contracts | +2,500 😄
- Short: 38,900 contracts | -1,200 😊
- Net Position: +6,300 (Bullish bias) 🟢
- **Commercial (Hedgers)**:
- Long: 82,500 contracts | -1,000 😐
- Short: 90,700 contracts | +800 😐
- Net Position: -8,200 (Bearish hedge) 🔴
- **Open Interest**: 165,400 contracts | +1,200 😊
- **Key Insight**: Speculators are increasing bullish bets, while hedgers lean bearish, signaling potential volatility near resistance levels like the Yellow ATR Zone. ⚠️
---
💥 Join the *Thief Trading* crew, boost the plan, and let’s raid the markets together! 🤑🚀

US30 ShortOverall, the Dow Jones (US30) is bullish.
But has we all know, all the gaps are always filled. I'm shorting until the gap is filled and then the market might continue it's movement to the upside.

US30/DJI "Dow Jones" Index CFD Market Heist Plan (Day or Swing)🌟Hi! Hola! Ola! Bonjour! Hallo! Marhaba!🌟
Dear Money Makers & Robbers, 🤑💰✈️
Based on 🔥Thief Trading style technical and fundamental analysis🔥, here is our master plan to heist the US30/DJI "Dow Jones" Index CFD Market. Please adhere to the strategy I've outlined in the chart, which emphasizes short entry. Our aim is the high-risk Yellow MA Zone. Risky level, oversold market, consolidation, trend reversal, trap at the level where traders and bullish robbers are stronger. 🏆💸"Take profit and treat yourself, traders. You deserve it!💪🏆🎉
Entry 📈 : "The vault is wide open! Swipe the Bearish loot at any price - the heist is on!
however I advise to Place sell limit orders within a 15 or 30 minute timeframe most nearest or swing, low or high level for Pullback Entries.
Stop Loss 🛑:
📌Thief SL placed at the nearest/swing High or Low level Using the 1D timeframe (41000) Day/Swing trade basis.
📌SL is based on your risk of the trade, lot size and how many multiple orders you have to take.
Target 🎯: 35000 (or) Escape Before the Target
💰💵💸US30/DJI "Dow Jones" Index CFD Market Heist Plan (Swing/Day Trade) is currently experiencing a Bearish trend.., driven by several key factors.👇👇👇
📰🗞️Get & Read the Fundamental, Macro, COT Report, Geopolitical and News Analysis, Sentimental Outlook, Intermarket Analysis, Index-Specific Analysis, Future trend targets with Overall outlook score... go ahead to check 👉👉👉🔗🔗
⚠️Trading Alert : News Releases and Position Management 📰 🗞️ 🚫🚏
As a reminder, news releases can have a significant impact on market prices and volatility. To minimize potential losses and protect your running positions,
we recommend the following:
Avoid taking new trades during news releases
Use trailing stop-loss orders to protect your running positions and lock in profits
💖Supporting our robbery plan 💥Hit the Boost Button💥 will enable us to effortlessly make and steal money 💰💵. Boost the strength of our robbery team. Every day in this market make money with ease by using the Thief Trading Style.🏆💪🤝❤️🎉🚀
I'll see you soon with another heist plan, so stay tuned 🤑🐱👤🤗🤩

US30/ Dow jonesConsidering the high that was hit during London session, I’m waiting to see what happens during the New York session. If that high breaks, I’ll look to buy; if not, I’ll be selling.

"US30/DJI30" Index CFD Market Heist Plan (Scalping/Day Trade)🌟Hi! Hola! Ola! Bonjour! Hallo! Marhaba!🌟
Dear Money Makers & Robbers, 🤑 💰💸✈️
Based on 🔥Thief Trading style technical and fundamental analysis🔥, here is our master plan to heist the "US30/DJI30" Index CFD Market. Please adhere to the strategy I've outlined in the chart, which emphasizes long entry. Our aim is to escape near the high-risk MA Zone. Risky level, overbought market, consolidation, trend reversal, trap at the level where traders and bearish robbers are stronger. 🏆💸"Take profit and treat yourself, traders. You deserve it!💪🏆🎉
Entry 📈 : "The heist is on! Wait for the MA breakout (40800) then make your move - Bullish profits await!"
however I advise to Place Buy stop orders above the Moving average (or) Place buy limit orders within a 15 or 30 minute timeframe most recent or swing, low or high level for Pullback entries.
📌I strongly advise you to set an "alert (Alarm)" on your chart so you can see when the breakout entry occurs.
Stop Loss 🛑: "🔊 Yo, listen up! 🗣️ If you're lookin' to get in on a buy stop order, don't even think about settin' that stop loss till after the breakout 🚀. You feel me? Now, if you're smart, you'll place that stop loss where I told you to 📍, but if you're a rebel, you can put it wherever you like 🤪 - just don't say I didn't warn you ⚠️. You're playin' with fire 🔥, and it's your risk, not mine 👊."
📍 Thief SL placed at the recent/swing low level Using the 1H timeframe (39200) Day trade basis.
📍 SL is based on your risk of the trade, lot size and how many multiple orders you have to take.
🏴☠️Target 🎯: 42700 (or) Escape Before the Target
🧲Scalpers, take note 👀 : only scalp on the Long side. If you have a lot of money, you can go straight away; if not, you can join swing traders and carry out the robbery plan. Use trailing SL to safeguard your money 💰.
💰💵💴💸"US30/DJI30" Index CFD Market Heist Plan (Day / Scalping Trade) is currently experiencing a bullishness🐂.., driven by several key factors.👇👇👇
📰🗞️Get & Read the Fundamental, Macro, COT Report, Quantitative Analysis, Sentimental Outlook, Intermarket Analysis, Future trend targets... go ahead to check 👉👉👉🔗🔗
⚠️Trading Alert : News Releases and Position Management 📰 🗞️ 🚫🚏
As a reminder, news releases can have a significant impact on market prices and volatility. To minimize potential losses and protect your running positions,
we recommend the following:
Avoid taking new trades during news releases
Use trailing stop-loss orders to protect your running positions and lock in profits
💖Supporting our robbery plan 💥Hit the Boost Button💥 will enable us to effortlessly make and steal money 💰💵. Boost the strength of our robbery team. Every day in this market make money with ease by using the Thief Trading Style.🏆💪🤝❤️🎉🚀
I'll see you soon with another heist plan, so stay tuned 🤑🐱👤🤗🤩

Dow Jones - Value Is The King Of 2025!Dow Jones ( TVC:DJI ) withstands all bearish struggles:
Click chart above to see the detailed analysis👆🏻
All major U.S. indices have been weakening lately but the Dow Jones is clearly the strongest of all. It seems like big institutions are shifting back to value stocks and therefore the Dow Jones remains very strong. Looking at technicals, this trend is rather likely to continue during 2025.
Levels to watch: $40.000, $50.000
Keep your long term vision,
Philip (BasicTrading)

Warning Signs Flashing: Dow Jones Breaks Key SupportThe Dow Jones Index has officially broken its rising trendline support, signaling a possible shift in the medium-term trend. After losing this key ascending structure, price is now hovering near the psychological support zone of 40,000, which has historically acted as both resistance and support.
This level is crucial. If it holds, we could see a temporary bounce or consolidation. However, if the 40K zone fails to provide support, the index may head toward the next major support area around 38,000, aligned with the longer-term trendline support.
Do like and follow us
THANK YOU

DOW JONES - FAKE BREAKDOWNHello Traders !
The US30 failed to break the support level (41603 - 41958).
The price formed a bullish candlestick pattern.
So, I expect a bullish move🚀
_______________
TARGET: 42965🎯

Dow Jones 3-daily OutlookLooks like a confirmed double-top, might turn into a Head/Shoulders even.
Head Shoulders:
A common scenario with these is, it looks like a double top, then has a strong reclaim of the neckline, which is around 41.9k, and then a 2nd loss of it shortly after w/ yet another re-test with failure to reclaim.
Double Top:
Another common scenario is just a re-test and failure to reclaim, and this is a textbook double-top.
50/200 3-daily EMAs and MAs:
After losing the 50 EMA and MA, we keep dropping below the 200 EMA and MA on the 3 daily chart during stronger dips, and then finally recovering back above both.
Recovery or Recession?
Recovery:
If we want to see a recovery, we need to do that again. So, a strong move back above the 200 and 50 EMAs/MAs after losing both, down to around 38.5k and then 37.5k, possibly as low as 36.3ish.
Or, for a more immediate flip to bullish, we need to reclaim ~41.9k during any re-tests, and then head to a new ATH above 45k.
Recession:
If we don't bounce from just below the 200 EMA and MA, we might see an extended move down or even a recession.

Dow 200 Points from Major SupportThe Dow Jones is just about 200 points from major support. I should caution there's often a move through support and slightly below, but this is where all the buyers are.
(I should have drawn the arrow to hit the next major resistance/support around 2031 lol, but you get the idea)
Good luck!
Dow Jones - Bearish Double TOPHello Traders !
The US30 failed to create a new higher high.
The price ormed a double top pattern.
Currently, The neckline is broken !
So, I expect a bearish move📉
____________
TARGET: 40320🎯

Dow Jones: Neutrality Strengthens Around 44,000 PointsThe Dow Jones Industrial Average has fluctuated within a 1% range over the past few trading sessions, encountering a neutral barrier near the 44,000-point zone.
For now, investors remain cautious as uncertainty grows amid trade and diplomatic tensions from the White House with multiple countries. This prolonged uncertainty has reinforced a neutral bias in recent price movements.
Persistent Neutrality
Currently, the Dow Jones remains trapped in a sideways range, with:
45,000 resistance at the upper boundary.
42,300 support at the lower boundary.
The price remains in the middle of this range, reinforcing the market’s indecision. As long as price action stays within this zone, the neutral structure may extend further in the coming sessions.
MACD Indicator
MACD movements confirm the current neutral market outlook. Both the MACD line and signal line remain oscillating near the 0 neutral zone.
The histogram also remains close to 0, indicating low momentum. As long as these conditions persist, price neutrality is likely to continue in the coming sessions.
Key Levels to Watch:
45,000 – Key Resistance:
Upper boundary of the sideways range.
A breakout above this level could mark new highs, potentially reviving the long-term uptrend that has been stagnant in recent weeks.
43,000 – Neutral Zone:
Converges with the 50-period and 100-period moving averages.
Also aligns with the 38.2% Fibonacci retracement level.
The most important short-term barrier that could limit any short-term bullish attempt.
If price fails to reclaim this level, bearish momentum could grow.
42,000 – Critical Support:
Lower boundary of the sideways channel. A break below this level could create a stronger bearish bias, potentially threatening the long-term uptrend that has been in place since last year.
By Julian Pineda, CFA – Market Analyst
