US30 TRADE IDEA + PPI%Hi everyone,
So here is my analysis for US30 today - as we can see yesterday the CPI% was released and the stats were:Actual: Actual: 0.1% - Expected: 0.2% - Previous: 0.4% - natrually you would say stocks would have a positive reaction to this data, correct? Well indeed it did when the stats were released but it instantly reversed and market closed down lower than expected. I call this move a BULL TRAP - All though there was positive news, based off what the FED has to do to battle inflation as well as talks of a potential recession in the U.S.A. gave reasoning why investors would focus on shorting the market.
Same thing today for PPI - I expect a fake breakout up and then a reverse down taking stocks into last weeks range. Nice potential swing trade setup if we get into a good entry.
Be cautious today as there is a lot happening - apply proper risk management and don't see this opportunity as a winning lottery ticket, see it as an opportunity to compound on your current wins to grow into an even more profitable trader.
Dowjonesindustrial

Dow Jones Index (US30): The Market Will Go Higher 📈
On a today's live stream, we discussed Dow Jones Index.
We spotted an inside bar formation, being formed on a key daily structure resistance
and a confirmed bullish violation of the upper boundary of the range of the mother's bar.
It is a very important bullish clue.
Probabilities will be high that the Index will keep growing.
The next goal for buyers will be 34175.
❤️Please, support this video with like and comment!❤️

ARE WE FINALLY HEADING DOWN?Afternoon everyone, unfortunately with the public holiday on Friday it prohibited us catching the US30 buy, today I’m looking for a long position on US30 - we need to see where the market wants to head today so please only risk 50% of what you usually trade with.
Predicting this move to happen at NYSE open - 3:30pm SAST
Thanks for all the amazing support so far! Let's get to 1000!

US30 NFP TRADE SETUP US30 TRADE IDEA FOR NFP
Expecting a stop loss hunt up kicking out sellers and then sells from set areas. We will wait for NFP to get released.

Bull Trap Before NFP?Based off what's currently happening in the USA we can expect the market to go down even further - keep in mind that NFP (Non-Farm payrolls) is tomorrow so price will be extremely volatile, I am expecting price to takeout in the form of buys and then go the direction we want.

Clearly April is going to fun for Bears.Its fabulous for me to see each day jargons of bulls rhyming about its their play now. Do not forget the crisis have just led to calm a bit, recessionary riots have just oozed out to take rest. Bond yields will grow further, you see their graphs you would understand they will bounce and traded largely. The markets will crash again don't think twice before going long because thats what makes momentum for bears.

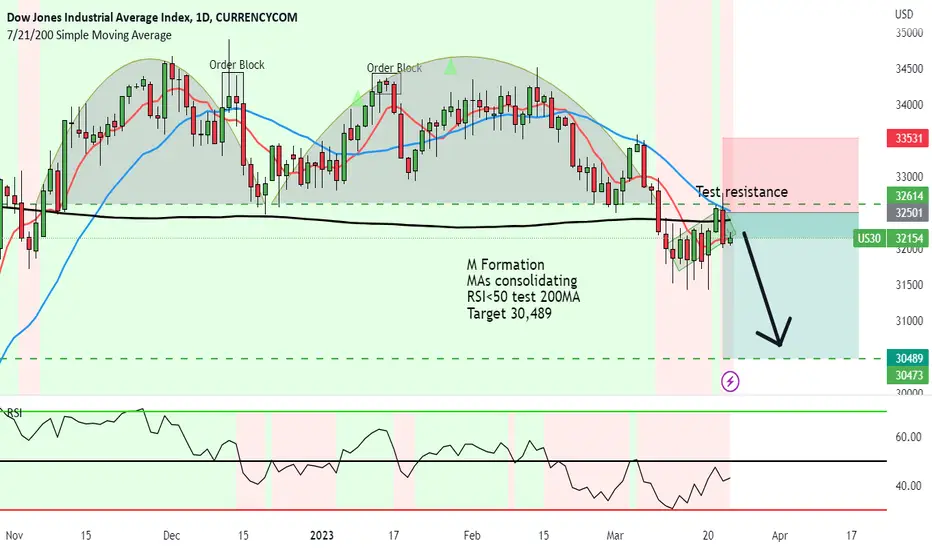
US30 showing a short signal to 30,489M Formation formed on US 30 followed by a break in the neckline and then a rising flag formation which broke below.
MAs consolidating
RSI<50 test 200MA
America is showing conflicting signals as the price is currently consolidating followed by the confusion with the banking crises.
I guess price action is showing downside to come.
Target 30,489
Dow Jones - DJI 20 March - 24 March Pair : Dow Jones - DJI30
Description :
Impulse Correction Impulse
Break of Structure
Flag Pattern
Bearish Channel in Long Time Frame and Short Time Frame as an Corrective Pattern
Divergence
Completed " 12345 " Impulsive Wave " ABC " Corrective Wave

DJI - Evaluating Crisis By ImpactBy far the conflicts seen from Russia and Ukraine outweigh the monetary greed fueled by each of the earlier struggles.
With the world seemingly in a 'cold war state', all of this preceded by a deadly pandemic that took over our world.
It makes sense to evaluate crisis based on impact, and the impact seen on the market just isn't enough and doesn't align correctly with other aspects including cryptocurrency.
If a big drop occurs on DJI as suggested by this chart, it will not be followed by Bitcoin . Bitcoin will act as a hedge.
The last wave down of a massive pattern formation.

YM, DOW JONES, US30 Daily analysisThis is a Daily analysis of both BUY and SELL Scenarios of the Dow Jones:
Buy:
-Buy Opportunity after retesting the old Support(Nov 4th, 22)
Sell:
-If Market breaks 31700 it's highly Possible to drop and retest 30100 Again.
Happy Trading

Collapse Of The US Economy DOW AMERICA | Part Two
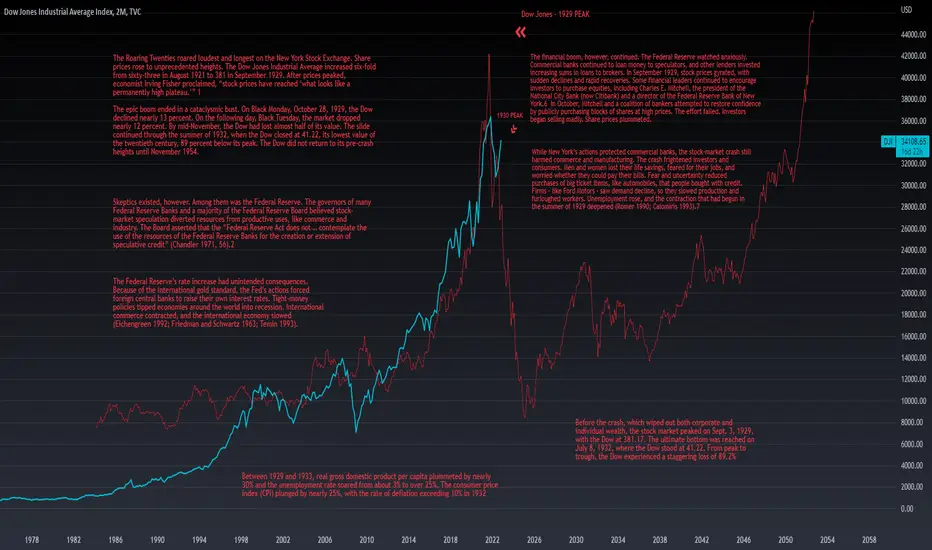
The Roaring Twenties roared loudest and longest on the New York Stock Exchange. Share prices rose to unprecedented heights. The Dow Jones Industrial Average increased six-fold from sixty-three in August 1921 to 381 in September 1929. After prices peaked, economist Irving Fisher proclaimed, “stock prices have reached ‘what looks like a permanently high plateau.’” 1
The epic boom ended in a cataclysmic bust. On Black Monday, October 28, 1929, the Dow declined nearly 13 percent. On the following day, Black Tuesday, the market dropped nearly 12 percent. By mid-November, the Dow had lost almost half of its value. The slide continued through the summer of 1932, when the Dow closed at 41.22, its lowest value of the twentieth century, 89 percent below its peak. The Dow did not return to its pre-crash heights until November 1954.
Skeptics existed, however. Among them was the Federal Reserve. The governors of many Federal Reserve Banks and a majority of the Federal Reserve Board believed stock-market speculation diverted resources from productive uses, like commerce and industry. The Board asserted that the “Federal Reserve Act does not … contemplate the use of the resources of the Federal Reserve Banks for the creation or extension of speculative credit” (Chandler 1971, 56).2
The Federal Reserve’s rate increase had unintended consequences. Because of the international gold standard, the Fed’s actions forced foreign central banks to raise their own interest rates. Tight-money policies tipped economies around the world into recession. International commerce contracted, and the international economy slowed (Eichengreen 1992; Friedman and Schwartz 1963; Temin 1993).
The financial boom, however, continued. The Federal Reserve watched anxiously. Commercial banks continued to loan money to speculators, and other lenders invested increasing sums in loans to brokers. In September 1929, stock prices gyrated, with sudden declines and rapid recoveries. Some financial leaders continued to encourage investors to purchase equities, including Charles E. Mitchell, the president of the National City Bank (now Citibank) and a director of the Federal Reserve Bank of New York.6 In October, Mitchell and a coalition of bankers attempted to restore confidence by publicly purchasing blocks of shares at high prices. The effort failed. Investors began selling madly. Share prices plummeted.
While New York’s actions protected commercial banks, the stock-market crash still harmed commerce and manufacturing. The crash frightened investors and consumers. Men and women lost their life savings, feared for their jobs, and worried whether they could pay their bills. Fear and uncertainty reduced purchases of big ticket items, like automobiles, that people bought with credit. Firms – like Ford Motors – saw demand decline, so they slowed production and furloughed workers. Unemployment rose, and the contraction that had begun in the summer of 1929 deepened (Romer 1990; Calomiris 1993).7
Before the crash, which wiped out both corporate and individual wealth, the stock market peaked on Sept. 3, 1929, with the Dow at 381.17. The ultimate bottom was reached on July 8, 1932, where the Dow stood at 41.22. From peak to trough, the Dow experienced a staggering loss of 89.2%
Between 1929 and 1933, real gross domestic product per capita plummeted by nearly 30% and the unemployment rate soared from about 3% to over 25%. The consumer price index (CPI) plunged by nearly 25%, with the rate of deflation exceeding 10% in 1932
YM Bigest Short in Human HistoryYM Target 19588 this is 6700 tics down... insane thing for economy....
Take care friends.

20 Reasons for buy US30 Dowjones 🔆MULTI-TIME FRAME TOP-DOWN ANALYSIS OVERVIEW☀️
1:✨Eagle eye: Super Bullish and already swept multiyear Liquidity NO weakness here back to back High
2:📆Monthly: The bulls Are so much in power After form, and Valid Hidg prices Are Also confirmed Valid low to And making a Monthly Flag type pattern A continuation sign toward the upside
3:📅Weekly: After a Choch price, we cannot break the previous Pullback and take more robust Support here. also, a weekly FVG and OB
4:🕛Daily: A valid Higher Low and a Proper wick off Spring After tab Daily OB here a strong bull reversal patterns also appeared, so we need to seek only buy entries from here
😇7 Dimension analysis
🟢 analysis time frame: H4
5: 1 Price Structure: Sideways after a bearish Trap On recent low
6: 2 Pattern Candle/Chart: Bouble Bottom, Bearish TRap, Sharinking Candle, Move Start with Gap ups, and also makes a poll and flag type pattern here everything BUllish
7: 3 Volume:
8: 4 Momentum UNCONVENTIONAL Rsi: Taking resistance on 60 levels that indicate just for sometime price may halt here, and complete flag patterns on h4 but may not go down 33310 level because here h4 FVG a strong support
9: 5 Volatility measure Bollinger bands: even it on above middle band after a w pattern, but we need a strong upside breakout or proper structure even on 1min tf
10: 6 Strength ADX: DMi cross bulls are in strength right now
11: 7 Sentiment ROC: USD is weaker indices are stronger
✔️ Entry Time Frame: 15M
12: Entry TF Structure: bullish and retest their 1st OB also make a bullish momentum candle
13: entry move: just impulsive move is started
14: Support resistance base: 15 min ob Support
15: FIB: trigger event occurred, and even the trend line also broke
☑️ final comments: Buy
16: 💡decision: Buy
17: 🚀Entry: 33433
18: ✋Stop losel: 33299
19: 🎯Take profit: 34167
20: 😊Risk to reward Ratio: 1:5
🕛 Excepted Duration: 4 day

Dow Jones: Periscope 👀Like a periscope, Dow Jones is craning its neck upwards, watching waves v in orange and (i) in blue unfolding before its eyes. To finish the current movement, the index should climb above the resistance at 35 521 points but ideally stop just short of the next mark at 36 446 points. Wave (ii) in blue should then lead Dow Jones decidedly back below 35 521 points. A 35% chance remains, though, for the index to turn downwards and to drop below the support at 28 635 points. In that case, Dow Jones would develop a new low in the form of wave alt.iv in magenta first before heading upwards again.

DOW on a bearish price action 🦐Dow on the 4h chart is moving in aseries of lower low lower high.
The Price is now testing a key support and according to Plancton's strategy if the market will make a clear break below we will set a nice short order.

Dow Jones Index (US30): Oversold Market & Pullback
Dow Jones Index reached a key level.
Testing that, the price formed an inverted head & shoulders pattern on an hourly time frame
and broke a resistance line of a falling wedge pattern then.
I expect a pullback now.
Goals: 32950 / 33110
❤️Please, support my work with like, thank you!❤️


us30 decline from 71% to -37% of yesterdays price displacementus30 is going to drop more than 330 points to erase yesterdays rally. Give me a follow if it pans out correctly.

Dow Jones Index (US30): Detailed Technical Outlook 📈
Dow Jones is consolidating within a horizontal trading range for more than 4 weeks.
Depending on the reaction of the price to its lower boundary,
the market may drop sharply.
To confirm a coming bearish wave, wait for a bearish breakout of 33450 - 33660
and a rising trend line. We need a daily candle close below them 2 to confirm the breakout.
A bearish continuation will be expected then.
Goal will be 33060.
❤️Please, support my work with like, thank you!❤️

DJI - Be Ready My FriendsHi, this is my new update for DJI. As you see in the first picture, we are exactly in the same place we should be for a big crash. It is difficult to estimate a date, but I expect we are going to see 80% downside on DJI in the near future.
Right now we are on a beautiful uptrend channel pattern and it has acted as resistance level multiple times and the middle line has acted like support level multiple times. At the same time we have An RSI divergence in monthly chart and that indicates we are ready for bearish signals.

DOW Jones Buy or Sell ?Pair : US30 ( DJI - Dow Jones )
Description :
Impulse Correction Impulse
Completed " 1234 " Corrective Pattern
Divergence
S / R Level
Symmetrical Triangle as a Corrective Pattern need to wait until it Breaks the Upper or Lower Trend Line

NDQ/DJI - Short; Significant Statistical Arbitrage opportunity!While the NDQ/DJI, itself, represents a significant trade opportunity here, even more notably, a number of the index components display remarkably skewed "Greeks"! (For example, APPL-GOOGL, CAT-PEP, TSLA-BA, etc..) E.g., It is a rather strait forward process - at these levels - to assemble baskets of stocks (Long) in each index (Short) with rather juicy, +30%-40% near term (<7 months!) profit targets.
All this is a strait forward process - once one starts looking :-)
p.s. Will provide ideas for some of these stock baskets if/as time allows.

DIA Bullish pennant Dow Jones formed Golden Cross on DEc 14th now forming a bullish Pennant. Still above 200, 50 Day Moving Avg. If it breaks the pennant, we see more upside and may reach 2022 highs this year.
