Dow Jones (US 30) Break below the trend line, What is next? Dow Jones Break below the long-term trend line that started from January this year.
But the recent omicron concerns and ahead of year-end profit may hamper the U.S. 30.
Though fundamental environment, high corporate incomes, and constructive profit outlook will be the driving force for most U.S. stocks in this market. However, omicron variant uncertainty can also drive price action over short-term periods.
Technically, U.S. 30 breaks below the trendline support. And the last four days, US30 held below the trendline resistance and ranging nearly the trend line. If omicron cases rise more, the market may drop more.
As long as U.S 30 below 35650, we should consider it a downtrend. And last week's U.S labor market reports couldn't meet their forecast, though the reports were not too bad.
Technically, from the present rate, we can short, our first target to the downside will be 33800, and after breaking below 33800, our final mark to the downside is 32119.
And stop-out should be above the trendline resistance. If the market breaks above the resistance trend line again, ut must continue its uptrend bias again.
Dowjonesindustrial

Dow Jones: Lowwwww!❎❎❎For a moment, the Dow looked like it was serious about rising again. However with the current movement, the course is developing in our predicted direction. We expect the course to turn around at 33518 points and surge again. An alternative breakout has a probability of 35%.
Happy weekend!

Dow jones at the edge ! close under 34500 in 4h or daily could be bad for market :
1. the market might retest the 33500 area in 4h (a pul back to 30 level in rsi )
2. if we lost 30 level in rsi in daily time frame we will see the massive sell out.
3. also we have the rsi 50 support in weekly chart(if we close uder rsi 30 in daily time frame the market will lose that too)
4.33000 to 33600 are the decision making area for weekly chart and if we lost 33000 . 30000 is the next stop
CURRENCYCOM:US30 CAPITALCOM:US30 SKILLING:DJ30

Buy US30 Clean Long Buy Dow JonesHello traders hope you'll are doing well, it's been a long time since i posted any signal over here, but here I'm now ✌️
Buy Dow Jones coming week will be bullish hopefully, so good luck.

DOW JONES SHORT ⬇️⬇️⬇️ Expecting new lows to be formed on DOW, i hope we will see a bearish price action with the first target on sell stop liquidity(eye) RISK OFF market sentiment be aware of those moves purely on fundamental reasons not technical.

US30 Sell and Buy PlaybookOn this chart, we have the Supply Zone and Demand Zone. These are the levels I would like the price to react from for me to engage.
1. The Sell Setup
If the price touches the SZ (Supply Zone), I would look for a bearish candle reversal pattern within the zone and sell to the next DZ (Demand Zone).
2. The Buy Setup
If the Sell Setup plays out as expected, I would look to buy at the DZ (Demand Zone). I would look to ride the up move to the top resistance level at 36570 area. I will definitely be taking profit along the way especially at
36358 area.
Let's see how this plays out.
Good Luck
MatrixPip

Dow Jones The rising trend of the Dow Jones index was broken down in February. Later, a V-shaped recovery took place. Generally, in such graphs, after V movement, a sharp decrease followed by a small correction and horizontal movements are followed. We saw this in the past week. Then I predict an uptrend that will touch the rising trend which was broken down in February.

DJI - Dow Jones Industrial Average IndexAll 50 states under disaster declaration for first time in US history. The number of Covid-19 cases and deaths are increasing day by day. Besides the negative news flow, I have prepared an Elliot wave analysis in terms of technical analysis. This week, I'm expecting a drop towards the 4th wave, i.e. 22,500. On the other hand, I'm expecting a rise towards the 5th wave in the week of April 20-27. That value is around 25,500, as I have shown on the chart.

US30 - Next Great Buying Opportunity 😋Technical Overview: - Dow Jones
Simple, whoever tells you short is selling you lies, you want to be on the safe side? stay bullish on US markets simple as that.
Wait for dips if they happen don't chase the market :)
Analysis is only 1 piece of the puzzle 🧩
Our analysis is a sentiment for the upcoming week, month.
Use this as a weather forecast, you are the person that has to put on a jacket when it’s raining.
Trade this sentiment based off your own entry strategy at the right time.
Flow with the Devil 😈
Trade with the manipulation👾

DJI Selloff and buy for the long run#DOW the new sell off starting at 36636.60
#DOW new buy for the long run at 18166.19
good luck!

Too much noise in the lower timeframesPrice is moving sideways in the lower time frames. The higher time frames will keep saying it all.
Once i confirm Divergence in M15, i will send out the possible buy signal in my next post here.
I appreciate the love so many of you show towards this channel, and to as many that keeps supporting us, i say a big 'thank you' !.

DOW on a new ATH 🦐DOW on the 4h chart is trading at the ath, the price has created an ascending triangle below a minor resistance and according to Plancton's strategy if the price will break above we can set a nice long order.
–––––
Follow the Shrimp 🦐
Keep in mind.
• 🟣 Purple structure -> Monthly structure.
• 🔴 Red structure -> Weekly structure.
• 🔵 Blue structure -> Daily structure.
• 🟡 Yellow structure -> 4h structure.
• ⚫️ Black structure -> >4h structure.
Here is the Plancton0618 technical analysis , please comment below if you have any question.
The ENTRY in the market will be taken only if the condition of the Plancton0618 strategy will trigger.
Dow Jones-1h(us30)dow jones looking for upward
price create uptrend
if the price breaks 36147
the target will be 36512

The Trade Desk Short Setup Trade the Range until it breaks and here we have a classic example .
TTD has been inside this range since Nov 2020 and has respected
the Top , Bottom and mid range of this descending channel .
We are currently approaching a key resistance at the top of the
Descending channel .
Hitting the very top Fib level that I have marked and rejecting there would add to the
pattern thus far of another lower high.
This of course can claim that resistance and hold but keeping things
simple and trading the range until it breaks is the best play.
SL placement is straight forward here and depending on your appetite for
risk the widest option is above the ATH or the alternative lower highs depending on your entry and risk management .
Know your invalidation and Like and Follow for regular analysis .

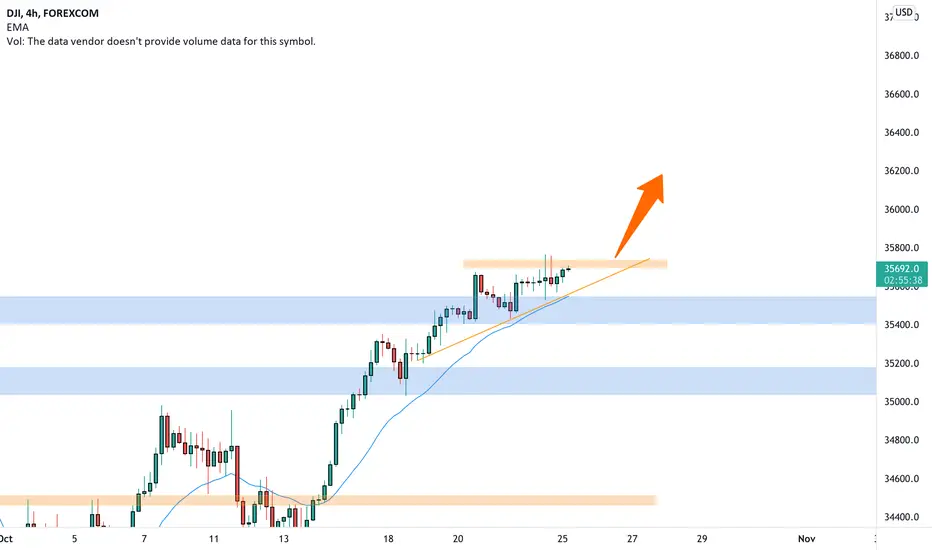
Dow jones longdow jones is about to make an uptrend.
after that downtrend that the price have been on, it finally squeezed exactly where i put the arrow,
as we can see the price didn't go lower than that, we're expecting to break the resistance and get our track back to the channel
buy at 36274, that's your entry, close position at 36440

US30 UptrendUS30 is in a strong uptrend right now but rejected at 36600. No break of trend yet nor incomplete order-block that needs to be filled so uptrend still strong and valid. We can expect it to rally back up to 36600 and catch a few points but chances of a strong rejection possible again so I don’t suggest a hodl through the 36600 area, a reversal/counter-trend trade could be valid at the 36600 area again if there are enough confirmations and you know how to execute the style. Good luck

Dow Jones: Rock'N'Roll 🤘🤘🤘The Dow Jones is extending its gains and solidifies its position north of the mark at 35777 points. The index should not cross this line - for now. In total, we expect the course to further increase and reach areas above 36958 points. After that, we expect a fall towards 35822 points.
Happy trading!

dow jones Swing tradea short dow jones trade
dow jones broke a bullish trendline to declare a correction of all waves as mentioned in chart
enjoy!

US30 - Where we can see Buy Pressure 😋 / Smart Money TradingTechnical Overview: - Dow Jones
We like to see price react to our buy zones providing intraday/scalps as they are not meant to be strong as the lower zone marked :)
Simple, whoever tells you short is selling you lies, you want to be on the safe side? stay bullish on US markets simple as that.
Wait for dips if they happen don't chase the market :)
Analysis is only 1 piece of the puzzle 🧩
Our analysis is a sentiment for the upcoming week, month.
Use this as a weather forecast, you are the person that has to put on a jacket when it’s raining.
Trade this sentiment based off your own entry strategy at the right time.
Flow with the Devil 😈
Trade with the manipulation👾

$DJI Dow Jones heading to Waterfall - WEEKLY CHARTHi traders! It's thatsBuck @twitter.
I'm changing my prediction on a DOW jones LONG.
After more analysis of the charts I found the DOW jones to be in a tricky triangle ending point. I painted the triangle green instead of red. Let's just say that I'm predicting massive sell off by the end of December 2021. Expecting 2 year swing in favor of Bears. Updates to follow with Gannzilla take profit points? Keep an eye on the USDCHF and USDCAD to confirm the devaluation of the US dollar. USA is BROKE and asking for more stimulus to try to dodge the debt waterfall.

DJI DOW JONES Bulls Have a lot of JUICE ; 40,000 by MAY 2021What people have not learned about the Bulls? They keep on COMING! Ever seen a cow studded by a man bull? Just watch out for the pointy end! But seriously, everyone doubts the dow. Might as well spell the next short "DOWnt" because Bulls are still in control of the weekly chart.
Take Profit May 2021
40,000

US30 scalpingHi Traders, i'm monitoring today a short term long idea in us30 at 35488 zone, once i will notice any bullish confirmation i will execute the trade.
Attention:
always remember to use proper risk management especially with the indices since their movements are too fast and it's easy for the indices to marginate your account if you're not cautious about your money management plan.
Take care and trade safe.
Joe

Dow Jones: Good Boy! 🐶🐶🐶The Dow Jones has been a very good boy ever since the low of the yellow wave 2. Currently, the surge should continue until somewhere around 35822 points. After completing a small correction, we expect the course to increase once again.
Push it to the limit!
