The Best (passive) Index SHORT in the world. - The Dow!The Title Chart is the DJIA/Nikkei225 - the best of them all.
Here are the rest;
This one is not very representative since it reflects the weakness in the Pound.
Still, it is a country-mile better deal than holding the Dow (Long).
Well, you get the idea as the rest of the worldwide indexes reflect the same story, across the board. (With the Asian Indexes leading the pack vs. the DJIA!)
One other, important issue to consider that these - above -declines haven't even factored in the Currency Differential(s) between between local currencies and the U$D. - Doing so, the Dow has an even grimmer future.
Dowjonesindustrial

US30 33155 + 0.33 % LONG IDEA * PRICE ACTION & STRUCTURE HELLO EVERYONE
HOPE EVERYONE IS DOING GOOD HAVING A GOOD ONE IN THE MARKET THIS WEEK, HERE'S A LOOK AT THE JOE DONES INDUSTRIAL.
* follow your entry rules on entries
* significant moves with the bears change the plan.
lets see how it goes.
many stars must align with the plan before executing the trade, kindly follow your rules.
HAPPY TRADING EVERYONE & LET YOUR WINS RUN...
_________________________________________________________________________________________________________________________
ENTRY & SL - FOLLOW YOUR RULES
some rules on exits & entries hope they help.
1. look at structure be it descending channels, pennants and so forth basically price action whats price doing.
2. If you use indicator determine does it align with your play e.g is it overbought/oversold where there market is it in a pull back to structure or continuing does price alighn with your indicator.
3. entries from 30M , 1H, 2H & 4H time-frames the higher the time-frame the more likely it will end up swing or long term.
4. aggressive trades can be executed on the pull back / or at ranges of structure that's when you are a scalper or your trade are Intra - day based
5. price action must definitely align with the plan.'
6. structure definitely
7. FIBONACCI EXTENSIONS AS GUIDELINES FOR SL & TP'S .
9. CANDLE STICK PATTERNS.
That's basically entry & exits plan basic guide lines
RISK-MANAGEMENT
PERIOD - SWING TRADE
__________________________________________________________________________________________________________________________
If this idea helps with your trading plan kindly leave a like definitely appreciate it.


DowJ divergence and market collapse by end of year??The monthly Dow index is dominated by divergence, thus indicating the direction of the market, the same was in February during the covid-19 expansion (the market anticipates this a few months before and do not understand how it did so). With the formation of the divergence against covid-19, it began on September 04, 2018 (dark red) (blue line on January 2, 2018) and ended on December 02, 2019, it caused significant damage to the market along with the covid-19 pandemic. But the bears divergence was replaced by a bull that started on January 4, 2016 and ended on March 02, 2020. And the bull divergence was much longer and the market went much higher. And this new divide divergence, which began on January 2, 2018 (dark blue line) and may end in the second half of this year.
I think after this long bull market there will be a pretty strong market depreciation later this year, and definitely stronger as it was a couple of weeks ago.
But as I mentioned, if rsi rise above 93.09, otherwise there will be bears divergence and the Dow index will fall, thus starting to collapse the market.
From a technical analysis point of view, everything is very simple and basic. But it is a powerful tool that makes a big impact on the market.
If you have anything to add, write it in the comments.


DOW can dip upto 29500?Expecting a dip in DOW30 in coming days/ weeks
SL setup around 32220 - 32250
TGT for short is 29500
Hope for the best.

Bearish divergence view fail if gap up happen, candle close below 31650 with sufficient volume and holds - 3-5% correction possible

DOW JONES US 30 BEARISHHey Traders,
So this is my analysis on the Dow Jones US30. Looking at this trendline from the covid crash to current then breaking below the covid trend line, I anticipate a drop then little bull trade and a further drop again.
Any comments?
Lets learn from each other guys.
Cheers to your profits.

Dow Jones , time to go down son. I will wait there to hug you.Did it long weeks ago, still valid, more than I thought.


🩸 🐖 "Bulls make money, bears make money, pigs get slaughtered"Hi guys after Friday rout there are new developments in stock market indicies. Last week price action on AMEX:DIA formed bearish reversal pattern buying climax above upper megaphone pattern line at the top of rising wedge. This rising wedge is 5th Elliot wave which is signaling trend will reverse soon.
As you can notice in chart last week realized volume was relatively big and volume week ago last week was rather small. Thats the signs that bears taking control significantly in recent days.
I expecting this week breakdown bellow megaphone upper line and begin forming corrective wave (a).
If you like the idea, do not forget to support with a 👍 like and follow.
Leave a comment that is helpful or encouraging. Let's master the markets together.

Massive correction incoming for US30.I'm fundamentally and technically selling US30 next week. Following Biden's bombing of Syria we will see more and more market volatility and i think it will be to the downside. Follow me for more trading ideas, thank you all and good luck!

US 30 Long Idea Context
- 4hr bullish OB + 50% FVG Setup
- Daily closed bullish above Market Structure
- London open i would like to see a A.M.D Model

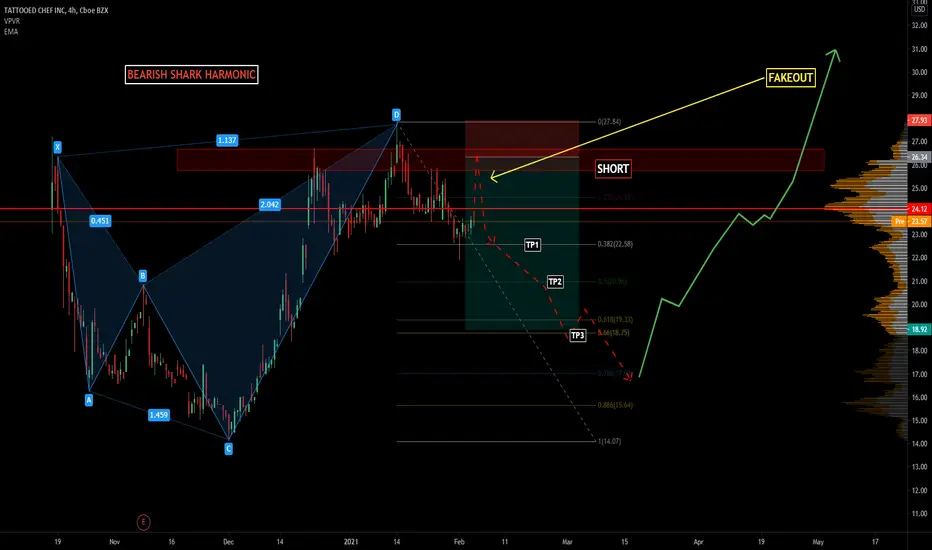
BEARISH SHARK ALTERNATIVE TTCFSHORT OPPERTUNITY LOOMS IF WE GET THE BREAKOUT/FAKEOUT AS SHOWN ON THE CHART UNLESS YOU PREFER TO WAIT IT OUT FOR THE LONG . OPEN TO ALL CONSTRUCTIVE OPINIONS OF MY WORK .


CRM getting ready to touch ATH Flag pattern breakout with strong master candle, volume spike indicates that CRM is ready to touch 275-280 zone.

#DowJones new Breakout ??#Dow Jones heading to 32000 slowly and triumphantly..........
on the verge of fresh breakout on daily chart....

US30 is finally falling to 0.38 fibsUS30 is currently making new highs which will make buyer to sell their positions (psychology)
Fibs from previous big move will be perfect TP area ( 0.38 )
Stop loss above Higher High
Entry around 31250 - 31300
On 4H chart TDI is showing bearish trend beginning.
And there is a Bearish momentum squeeze.

US30 IDEA NEW IMPORTANT LEVELS 4H DOW JONES INDUSTRIAL AVERAGEUS30 IDEA NEW IMPORTANT LEVELS 4H DOW JONES INDUSTRIAL AVERAGE
