Dow aka Us30 possible trade setup for July MonthHi,
US30 is not our trading script but it can affect the world market. Just tracking DOW to get an idea for our Market. Here is the July Month Possibility.
Dowjonesindustrial

DJI Short Trade Setup!Welcome to Profitlio Trading!
What's up traders! Thanks for Jumping back on my Analysis, 👨💻 Trader champ is here on your Service, Also hit thumbs up 👍 and support the work
Sketch up your own trade setup and make sure you meet with the required confirmations first before you make your move!
⭕️ ✅ Scroll Down 👇 ⬇️ to signature section for 📲 contact details 💰💰💰
Profitlio Trading ( Since 2014 in Financial Markets )
________________________________________________
Traders Disclaimer: Non of our analysis or trade setups being shared here on trading view is a trading advice. As we keep on weekly updates with our predictions and expectations. We may take them as a trade only if trade setup meets the required criteria ( Confirmations ). Unless we will never take them as a trade if it never reach our trading requirements.
Take them at your own risk as trading is highly risky and you may loss your investments. Our trades are based on Swinging and Mid to long term approaches. All trades executed will be handled under the name of Profitlio Trading only.

😯 Uh Ohhhh! (DJI)💰 LET'S GET INTO SOME DOW JONES ANALYSIS!💰
1️⃣ First off SMASH that LIKE BUTTON & Give us a FOLLOW for DAILY ANALYSIS! 👍
- The 3 day is starting to show signs of blood as it is the first start to red since the bottom.
- I've been bearish on a lot of my post for the longterm approach.
- DJI been short since 26,990. The close at the end of this week will tell us a lot on how the 3 day wants to lead us into the weekly chart.
Best of luck to you and all of your trades this week! 🤜
Drop your charts and comments down below, share with us what you think is going on in the markets! ❤❤❤
Thanks for checking out our analysis! ✌😁✌
🥇MLT | MAJOR LEAGUE TRADER

🤔 Long-term View Still Early To Call. (DJI)💰 LET'S GET INTO SOME DOW JONES ANALYSIS!💰
1️⃣ First off SMASH that LIKE BUTTON & Give us a FOLLOW for DAILY ANALYSIS! ❤❤❤
(Overall Market Sentiment) 🤷 Neutral
- If you've been keeping up with the MLT Trades then you know that we got short avg. Price 26,990 on a shorter timescale.
- Overall based off the 3 day chart you can see that the candles are still green, no crossover and that the ema dots have not completely lined up just quite yet.
- We are in a more aggressive position on the wallet timeframe and for now will continue to hold and get a feel for how this week wants to start out.
- For a longer term confirmation we are going to want to see the ema dots align red, candles shift red and crossover.
- On the shorter timeframes based off my previous post on a lot of the market you know that we are leaning bearish. We won't know until long term confirmation.
Best of luck to you and all of your trades this week! 🤜
Drop your charts and comments down below, share with us what you think is going on in the markets! ❤❤❤
Thanks for checking out our analysis! ✌😁✌
🥇MLT | MAJOR LEAGUE TRADER


💰 Dow Jones Rejected? (DJI)💰 LET'S GET INTO SOME DOW JONES ANALYSIS!💰
1️⃣ First off SMASH that LIKE BUTTON & Give us a FOLLOW for DAILY ANALYSIS! ❤❤❤
(Overall Market Sentiment) 🐻 Bearish
- I have been tracking this big boy heavy lately as I do hold a short from 26,990 area. I let the most recent coercive way push back up and held onto my position because I wanted to see if the longterm break of support would turn into new Resistance. You can see we shot back up with some engulfing candles but now seem to of have found some Resistance as the candles begin to compress and start to Crossover red.
- Let's also take into consideration that all of thr ema dots are beginning to shift back towards red. This is my play to try and capture a massive swing on the dow, I don't look forward to selling anytime soon.
Thanks for checking out our analysis! ✌😁✌
🥇MLT | MAJOR LEAGUE TRADER

Four possible scenario's using Parabolic SAR & Monthly MA'sBiggest question. Will we get a cross. Devise a wining strategy for both outcomes. Not predicting. Not Forecasting. NOT ADVICE. DYOR.


💥 Still Holding My Short. (DJI)🥇 We are now testing predicted next major support levels from previous post below in related ideas.
First off. If your objective is to trade large timeframes like the 3 day then you need to be willing to absorb noise in a market. If you are going to trade a large timeframe you have to cut out your emotions and let it go. You will never become a successful swing trader if you can't do this. You look for your entry set your stoploss and move on to the next trade and continue to diversify your capital. You will NEVER capture every single exact bottom or every exact top. IT WILL NOT HAPPEN! It's going to take a lot of micro structures to form to create one overall massive trend. If you can't understand this and get caught up in emotions, trading probably isn't for you. I speak about a lot of the basic aspects of trading over and over again to help make my fellow traders understand regardless of what strategy you trade with, the core fundamentals play a bigger role than anything! Cut loss, use stop loss, let the timeframe play out, don't marry bad trades, don't dollar cost average on the way down, cut out emotions.
We have been short on the dow jones since 26,990 which is still roughly around 5% in profit. We had taken this trade based off the 3 hour timeframe as we scouted previous major structure to play. We lined up the Crossover strategy and the ema dots and went with it. We have now broken the green major support level and now are testing major key levels on previous horizontal green supports. You see that price has rebounded off those levels to try and test the upward green strong longterm old support. Remember support can become new Resistance. Let the trade play out. We are starting to get some green compression on the 3 hour candle looking for a crossover and ema dots to line up. My main focus is that we are under that longterm support. If it can hold than we could see a bigger selloff and start to roll this trade over into the larger timeframes for a longer hold, which I would prefer. I am not worried about it and will let it ride to see how it holds up on key s&r levels.
Have an awesome week! Look at some of the previous dji calls in the related ideas below. 👍

🤔 Will We Be Saved? (DJI)😯 It's very interesting to look at the large multi year cycles. This is a 3 month chart. Currently the upward support is being breached. Is this just the beginning or will we be saved?
3 Month Timeframe
Crossover Strategy: Red Doji
The EMA Dots: 3/3 Red (Last was april 2008)
The crash we have experienced stopped at old Resistance to find temporary support. Interesting. If broke the red line I believe we would see a serious collapse. Very critical to see if this recent rebound we've had can hold.
Have an awesome day! ✌
🥇MLT | MAJOR LEAGUE TRADER


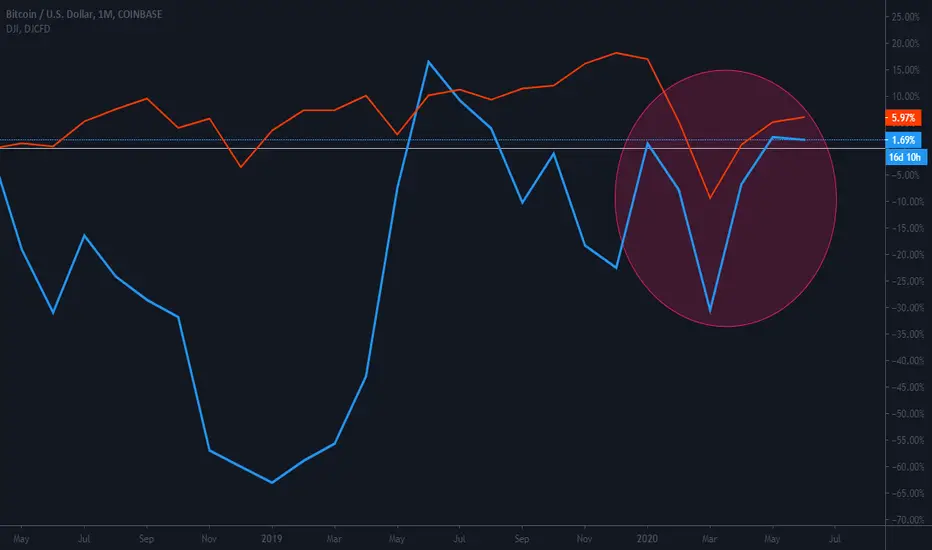
DJI and BTC recently correlated or manipulatedAs you can see we a had a tiny bit of correlation during other times but nothing like after the Covid19 outbreak. IMO, there is clearly correlation or manipulation between these 2 assets. Trading advice not found here...
MLT Called The Top! 6.9% Gain! 🥇 (DJI)👌 Well, Well, Well.... she seemed to of had a rough Thursday just as we expected it to have.
The main upward support level has been breached, which is not a good sign.
What we are looking for next to be test and try to hold is not not too far away.
25k-24.6k as I have it label as a key level of support.
We took this position on a 3 hour timeframe as the Crossover strategy and the ema dots shifted towards the red alignment.
We will look to see if we can get a reversal here or if it decides to just melt through the bottom. 🔥🔥🔥
Best of luck to you all! 🎲🎲🎲
🥇MLT | MAJOR LEAGUE TRADER

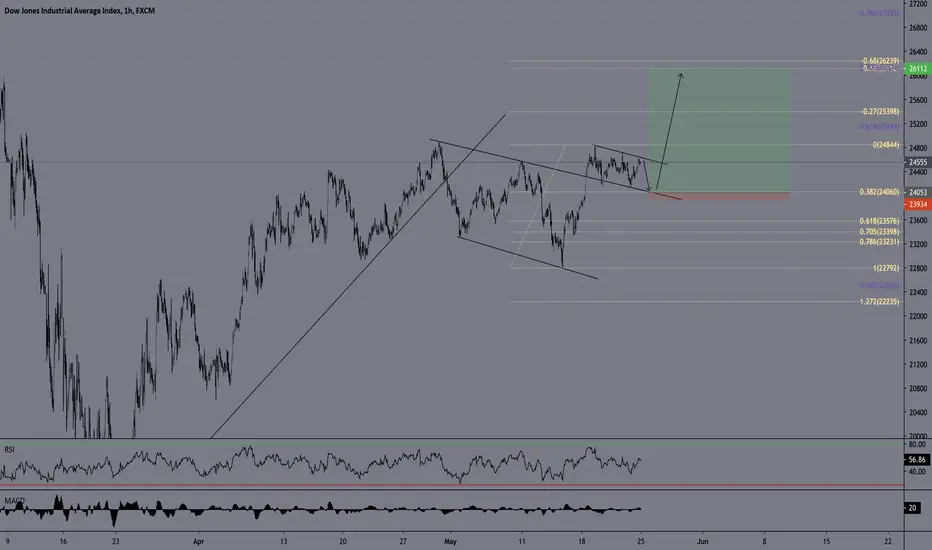
US30 S&D (UPDATE 4!!) BACK UP OR DOWN??These turbulent swings in Price is exactly why we book profits when we hit new levels. Manage your exposure - Trade smart, comment if where you think we are headed next for the DOW!

Trump Said It... The BIG "V" (DJI)🤔 Will the stock market drop or fly high... Let's take a look!
What is the big V pattern and what does it represent? I want you to focus on the structural support that we have drawn out connecting the 3 green arrows bottoms. This is a very key level of support that we want to take very seriously! We are all aware of the massive market selloff that we had in early 2020. We found a major level of support around 18.5k and then rebounded to run up towards 27.5k. The big v can also be considered a cup pattern which is a bullish pattern to show that the bulls are in control as we continue to print higher lows. But, let's keep in mind that patterns can change and do not always go according to the textbook of what It represents.
Next let's look where our most valuable piece of historical structural data was developed at. I have circled it in red. You can see that this was an area during the selloff where we had some relevant form or an impulse to try and push the market back up. We want to correlate that piece of information with where price sits at now. As of now we have attempted to breach above that structural top where Resistance was at that ended up crashing the market back down. Their is a saying where old support and old resistance can do the opposite and act as the opposite later down the road. Support and Resistance is a very critical thing to understand when trading any market!
This is a 3 hour chart as I am taking a more aggressive approach to play a short here at 26,990. We are getting early signs of a Crossover from red candles developing to Crossover the green line below. We want to see it travel towards 26,919 as that is the level of the historical top to see if it acts as new major support to push the market higher. If I wanted to long the dow jones I would look to play the breakout of 27,451. I will be applying a stoploss here of 1.72% on this short. Risk management is also a very important concept to understand when trading the market, probably the most important!
If we break 26,919 next we will want to look to travel towards the cups green arrow major support level to see how that holds. Look for a textbook Crossover strategy play there or hold if the candles stay red and push through it.
The next level on the way down would be the 2 green levels I've drawn out in the range of 25,000-24,600 to see if that old Resistance acts as new support.
As of now let's not get carried away and not hink too far ahead. Let's play the current range and walk with it.
I hope that I've helped you learn something today! 😁
If you would like to get training on how to trade the markets with our custom strategies and Indicators, then please consider checking out our website below!
We wish you the best and will stay updated on this one!
🥇MLT | MAJOR LEAGUE TRADER

LONG - Dow Jones Industrial Average (DJI)Hi there!
This idea/trade is pretty simple and it comes up few and far between. It is strictly based on price and nothing else. Human nature never changes and it's interesting that the two times this has happened in the past were also during "panics". These trades typically last a few months so just keep that in mind. The details are below.
All the best,
Andre
CHART INTERVAL
2W (2 Weeks)
THE SIGNAL
When the close is more than -3 standard deviations below the 20 period linear regression on this time frame, it indicates an amazing long opportunity. The exit is a 2W close above a 10 period simple moving average.
THE RESULTS
This has only ever happened twice:
First Time
Entry: November 11 1929 @ the open (220.39)
Draw down: -11.36%
Run up: +24.78%
Exit: February 2 1930 @ the open (270.54 +22.76%)
Second Time
Entry: October 26 1987 @ the open (1839)
Draw down: -5.72%
Run up: +13.00%
Exit: February 29 1988 @ the open (2032.20 +10.51%)
THE RISK
As you can see from the trade draw downs the maximum is -11.36%, of course it is absolutely possible to exceed that.
**Important: Remember that leverage increases the draw down number... i.e -11.36% with 3x leverage is -34.08%***

DOW JONES - Will history repeat?Since April 6, 2020, the Dow Jones Industrial Average includes 30 companies
Which company from this list will be the strongest in the next 54 years?
3M Co. (NYSE: MMM) (industrial conglomerate)
American Express Co. (NYSE: AXP) (credit services)
Apple Inc. (NASDAQ: AAPL) (Electronics)
Boeing Co., The (NYSE: BA) (aircraft and defense)
Caterpillar, Inc. (NYSE: CAT) (agricultural and construction equipment)
Chevron Corp. (NYSE: CVX) (petroleum industry)
Cisco Systems (NASDAQ: CSCO) (Telecommunications)
Coca-Cola Co. (NYSE: KO) (drinks)
Dow, Inc. (NYSE: DOW) (chemical industry)
Exxon Mobil Corp. (NYSE: XOM) (oil and gas company)
The Goldman Sachs Group, Inc. (NYSE: GS) (finance)
Home Depot, Inc. (NYSE: HD) (building supplies stores)
International Business Machines Corp. (NYSE: IBM) (computing)
Intel Corp. (NASDAQ: INTC) (semiconductors)
Johnson & Johnson Inc. (NYSE: JNJ) (chemistry, pharmaceuticals)
JPMorgan Chase and Co. (NYSE: JPM) (financial group)
McDonald’s Corp. (NYSE: MCD) (fast food restaurants)
Merck & Co., Inc. (NYSE: MRK) (pharmaceuticals)
Microsoft Corp. (NASDAQ: MSFT) (software)
Nike Inc. (NYSE: NKE) (clothing)
Pfizer, Inc. (NYSE: PFE) (pharmaceuticals)
Procter & Gamble Co. (NYSE: PG) (household chemicals)
Travelers (NYSE: TRV) (financial services)
UnitedHealth Group Inc (NYSE: UNH) (Healthcare)
Raytheon Technologies (NYSE: RTX) (industrial conglomerate)
Verizon Communications (NYSE: VZ) (telecommunications)
Visa, Inc. (NYSE: V) (finance)
Walmart, Inc. (NYSE: WMT) (distribution network)
Walgreens Boots Alliance, Inc. (NYSE: WBA) (pharmacies)
Walt Disney Co., The (NYSE: DIS) (entertainment industry)

DOW SUPPLY AND DEMAND (UPDATE 2!!)27133 met too, wait for pullbacks and asses fundamentals if you do not have good positions priced in already.
Back to all time highs soon. Thank you Fed.

Is the Dow Jones 🐂 Ready to Rumble? | DOW JONES MINI FUTURES ($🐮 The DOW (DJI, DIA, YM1!, UDOW, etc) is rallying based on recent strength shown by key players like Disney, the banks, Boeing, Exxon, etc. Looking at Dow Jones Mini Futures (YM1!) we can see a new clear bull trend forming... but we also see a clear-as-day support level to be tested to help confirm this rally. Perhaps the shift out of the NASDAQ's COVID hedge plays and into DOW darlings causes a correction in all markets, perhaps bank stocks run up against resistance and need to cool down. Whatever spurs on the retest of support, so be it. The plan here is simple regardless, we are aiming to buy support and catch a ride on the post-COVID bull.
Resource: www.investors.com + www.fool.com + www.cnbc.com
✨ Drop a comment asking for an update, we do NEW setups every day! ✨
Like, Comment & Follow to help the community grow 🎉🎉
---
1. Fractal Trend is showing an uptrend (Aqua colored bars) on the 4-hour timeframe. This is the first notable confirmation of an uptrend on YM1! and is indicative of the recent strength in DOW holdings.
2. With this strategy, we are looking for long setups in an uptrend and as such want to enter long on retests of bullish order blocks plotted by Orderblock Mapping (Aqua colored lines) and/or bullish S/R levels plotted by Directional Bias (Aqua colored lines).
3. The goal here is to take a long position at the S1 S/R flip since that has been a major price pivot point during the COVID correction.
4. Our stop loss is placed just below S1, with the logic being that S1 will hold.
5. Our target is the R2 highs formed during a dead cat bounce back in March.
6. If S1 doesn't hold, then S2 offers another support level, although the current bullish bias on the DOW would be lost at that point.
Good luck bulls!

SIRI ANALYSIS Hello my friends
the analysis of this market shows that there is a very high probability that in the next few days will experience a bearish trend for more information please contact me on
youssef.lyazidi5@gmail.com

TSLA ANALYSISHi friends
the TSLA market graph shows that there is a high probability that this market will experience an upward trend in the coming days
for more information please contact me on
youssef.lyazidi5@gmail.com

DJI Running on hopium of a new VaccineDouble top on the Dow, has failed thus far to reach the 61.8 retracement level in hopes of the market making a recovery, According to the wall street cheat sheet id say we are between the "Complacency and the Anxiety" stage, Its just a dead cat bounce IMO, Although some restrictions are slowly easing in some country's, the world is in turmoil, the recession as we know it we are only at the tip of the ice berg, Sell-offs that we have seen in March will make the next wave look like a hiccup, The Dow is running on hopes of a Corona Vaccine that will hopefully make the world into a better place again and things will go back to normal, The vaccine is still in testing stages which could make it 12+ months until its ready to go. This recession will make "The Great Depression" look like a speed-hump, Just wait until the Q2 data comes out, There will be millions more that have filled for unemployment. Oh no thats ok tho, The fed have the money printers working over time, = Inflation, watch global currencies die out
"We are in a recession and there is a global pandemic happening at the same time" The world is not going back to normal anytime soon.
