Dow Jones Industrial Average - Short OpportunityDJI might have some percent upside, but the market is starting to show weakness. This recession is just starting. Here is a shorting idea.
Dowjonesindustrial

US Markets Maintain Gravity Defying Despite Current World EventsSimilar write up to last week much remains the same until S&P and Dow Break previous highs (S&P above 2900 / DJI above 24600)
S&P: If P action in the next week closes below the orange line at 2723.3 attention will turn more bearish and watch for market to fall to 2460.2. In this instance will reassess market dynamics as it may bounce in this range or continue to fall
Dow: The same flows for Dow Jones with P action in the next week close below the orange line at 22931.5 attention will turn more bearish and watch for market to fall to 20842.4. In this instance will reassess market dynamics as it may bounce in this range or continue to fall
If markets stay above these initial levels for the next 3 months (i’ll be surprised) however this will look like economies are back in order from COVID-19 and running ‘normal economics’
(Print source set to close)

Dow Jones Long Term OutlookDow Jones crashed about 11,000 points, hit the .5 Fibonacci and then went about about 6,000. Points. Long term Dow Jones Forecast.

Dow Jones - Swing Key S/R zonesHey Guys,
Check out my swing key levels and S/R zones on YM where I am goint to trade.

Dow Jones Looking Bearish (Chart Signals)The Dow Jones Industrial Average Index (DJI) is also looking bearish.
This chart tends to look very similar, almost the same, as the SPX (S&P 500 Index).
The signals coming from this chart goes as follow:
1) Decreasing trading volume.
2) Lower high.
3) Bounce completed.
4) Drop below EMA10 and EMA50.
5) MACD bearish cross while trending lower.
6) RSI broke below 50 while trending lower.
All these are pointing to a drop.
If prices move back up the purple line, there can be another attempt at resistance before more low.
Right now the chart is looking bearish and value can continue to drop.
S&P 500 Index Falling Wedge Broken, Time To Drop? (Chart Signals)
Thanks a lot for reading.
Namaste.

#DJI.. SELL IN MAY AND RUN AWAY!.. I think that there will be a long-term correction wave in the global markets on a macro scale, and it is getting closer.. Markets will become very interesting in the coming years, we will wait and see..
For DJI, the structure I expressed in the chart is very important and should be watched carefully.. I firmly believe that, we will observe wedge pattern in the chart of many markets in the big correction wave..
What I wrote is about strong possibilities that most investors and analysts do not express or expect.. Please do your own due diligence when it comes to trading.. Invest at your own risk..
I wish you all the best..

Update $US30 $Dowjonesin the last analysis We fell into the correction trap, specially with the fake crash Trap, But we stressed that the entry areas are between 24100 -- 24150, Due the high risks in the US stock market over the past week.
In my own view I think that the price is trying to change the orientation specially that the correction Plan a third, both in terms of time and price.
I think the price now hit the targets (the previous support level and the current evaluation) 24000 mainly and directly, and breaking the resistance means confirming the correction and targeting the level of 24900, then if it will be breached, personally I expect that we will see a new top of 25500.
Also a very important point, today the May candle opened, on the monthly calendar the price always moves near Moving Average 200, that's mean it's have to hit 25500 at least and make a new top

possible head and shoulder for the DowJones going forward?holy batman and robin.... is this even possible with all the stimulus Fed is BRRRRRRRRRRRRRRing??


Is It Time For The Recovery? Or More Down Side? (DJI)Their is a lot to study here.
Ever since our initial breakout we have not seen a retest on the breakout to test for a support.
Each impulse has decreased roughly by 7% each push back up.
The last wave was a 7% impulse as we reach the level of Resistance.
The decrease in buy percentage could represent a correction to come.
24815 is key break level for upside continuation.
If it did fail to breakout out I'd look to play a bounce off the downward breakout level to see if we can find support.
Total we have 5 waves up to current level. Could be end of a wave cycle.
I know that these times have impacted many lives and ultimately I just wish it would fly back up and the world can go back to work.
Very critical area for the stockmarket around these levels.
Enjoy.

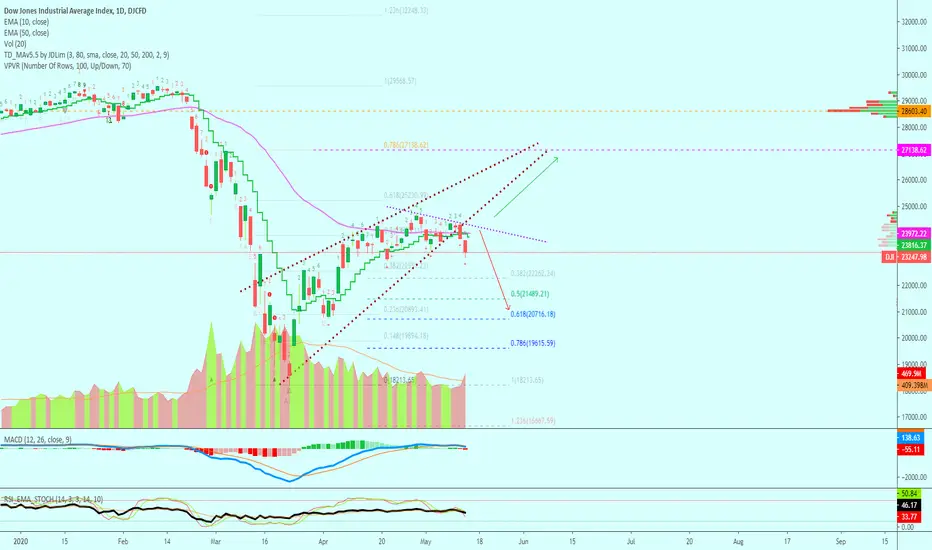
US30, Fifth Wave Completion, ABC Reversal begins (Time to Short)Hey guys, check this shit out...
The five wave Elliott cycle has pretty much come to an end (nice divergence can be seen by the fifth wave climbing while the RSI shows an overbought situation with consecutively descending peaks) which is also confirmed by a zone of possible resistance coinciding with the same zone evident on the 10th of March 2020. In this case my prediction is that a nice reversal is due (as illustrated by the ghost feed I've drawn on my short box) with a first take profit targeting the 0.382 retracement on Fibonacci and a possible second take profit at the 0.618 Fib zone (the first take profit leaves us with a R/R ratio of roughly 1:3.
Let's get this bread guys and feel free to leave any comments! :)

Dow- 25k should be soldFrom an economical perspective, Dow has no place at 25k...
From a technical perspective, 25k is the confluence of Fibo 61% and horizontal resistance and it should be sold
SL must be kept wide to avoid spikes and aberrations and as target 20k should be a soft one


Dow Jones : Long up to 25 300 ? (Elliott's Waves)After today's situation, I came to the conclusion that we are in a 5th wave that can lead up to 25 300, AS LONG AS IT DOESN'T GET TRUNCATED
25 300 would match a 0.618 retracement of the big drop to 18 200
If we reach 25 300 and then move back down, it might mean that we would start the 3rd wave (3 out of 5) which would go lower than the first wave (at 18 200).
I might go long if we break the 3rd wave high, and then if we hit target of 25 300, all SHORT !

Dow Futures now short. MACDH divergenceHere we are with another go at a dow short after the failed attempt last night (but with some nice follow through longs today).
Now we can see a 1hr MACDH and RSI divergence in overbought territory. We can also see an inverted hammer candle showing potential reversal. There should be some downside potential here. These types of divergences are my A* trades and often give good profit due to the extreme divergence on the MACD histogram. Stop is at 24220. If I get stopped out again that would indicate a lot of buying power and I would expect a run up again, so another opportunity to simply reverse and go long if this short fails.

My Outlook On The DOW (DJI)Ascending wedge break to the right of long term upward support with highs being hit at 24150 key area of Resistance to test for an attempt at an upward breakout.
23000 is support area for the current range.
Weekly crossover for bullish shift and the ema dots are firing green.
But, keep in mind that we don't have a close on the weekly till may 4th.
Overall the weekly is in development and trying to recover from the crash.
We want to watch the open and see if it can push through 24150 with good volume pushing on the books.
Currently the one hour is green. If I get a Crossover on the 1 hr to the downside from rejection I'd than look for a 24000 break for a short to test 23000
If breaks to the upside your going to want to see it push towards the old wedge support and see if it rejects as new Resistance. That would be a good place to take profits.
We need to keep in mind that the monthly and the 3 month are overall bear pressure.
We now scout the weekly to try and find a good long term position to enter here, but it results in if we want to make higher highs or lower lows on the smaller timeframes
We still have to be conservative with the higher timeframes.
If this ranges breaks down than it could be a Distribution play and could result in a good size drop.
I hope this helps, I wish you all the best of luck trading this week!
Have a blessed day. 😁

Dow Jones, Elliott's Waves, Wave C to be completedHello,
here is my first graph with Elliott's Waves. I m new to this, and it can be totally wrong, but I do see 3 potential short-term targets on the 4h chart. Any of those could act as a resistance and then we would start going back down.
I might try a quick LONG with a tight SL if we break the 23 878 and then get SHORT anytime we get close to 24 200 with a SL at 24500. And go short directly if we don't confirm a break above 23 878
Let me know what you think, thanks !

Time to long - RSI is above 60, this is a bull signal for my strategy.
- Price is above 200 EMA.
- There is a clear Reversal head & shoulder pattern.
If all works, we're ready to go.
TP1 and TP2 are on chart.
Follow Red trend line for SL ( follow 4h close price)

Dow sell. Lower high post breakoutHere we have a lower high on the 1hr chart on the dow after a breakout of the rising wedge on the daily. Nice engulfing pattern too on the 1 hr candle. Its currently trading above the 200HMA but with all other moving averages are crossed under so its good value for a short here. We could expect some selling pressure here in overbought territory and a test in the first instance of the rising trend line and maybe lower. 4 Hr 200MA is still sloping downwards and daily MA's are still bearish. I'l be looking to scale out some profits at the rising trend line and a break of the swing low on the hourly charts.

DJI ideaH&S within a rising wedge on the hourly. Higher high has not been made and a reversal candle has formed on the hourly (Confirmed on the 15 min)

#Dow30 - 1929 vers. 2020? #US30USD #DJIIn 2020 everything went much faster than in 1929 but could the Dow30 go through the same structure?
If in 2020 the A = C becomes the same as in 1929, then the Dow still has room for 25,558 points in the short term.
Maybe the Dow will do something completely different and climb to new all-time highs, because everything is only half as bad and the world is back to the "old" on Monday and everything is back to normal.
However, this structure should be observed more intensively at least in the coming weeks.
Greeting
Stefan Bode
#Dow30 - 1929 vers. 2020? #US30USD #DJI

dow slow down !Here u can see price isoving in decending chanel, where risk reward ratio might great.
and you can think to buy put,for short term.
close down to 50 ema ,and rsi divergin is showing downtrend,as well mass index .
