Broadening Top Inside a Broadening Top? That Can't Be Good...The Dow just made a smaller version of the pattern it was already in to complete the formation. I found it interesting, so here it is:
Dowjonesshort

DJI - Short with great Risk/RewardSimple trade for the week
Entry on trend line break
Invalidation level : 25815
Target 1 : 25600
Target 2 : 25500

Take A LOOK @ THe BiG Picture.Hey guys
Your remember that megaphone pattern.
Hell yea. 16.000 DOW and it crashes to 5000 area.
It came to 16.000 people waited to crash 10.000. But it didnt.
It Rallyed to 10.000 more. Yes This is crazy.
Nearly same points. Waited to go down 10.000 but it go up same 10.000.
Maybe ! This balooon came to an end.
If this crashes to 16.000 level from 26.000 levels. Crazy thing. So imaginary if it crashes to 16.000 level is it cheap ?
Hell no. This can crash to 5.000 ? MAYBE. Maybe not..16.000 BEFOre was over in mind. but now if it crashes to 16.000 people think is its free..
26.000 level is a BUBBBBLEEEEEEEEEEEEE for me..
Good LUck..

US Indices – Bearish Intermediate (C) – Aggressive SELL - Part 1During the Bull Market in Intermediate 3, Nasdaq was my favorite because of its Wave Count, hence the reason for the successful view on the NASDAQ100 – Bullish Minor 5 - Bulls Come-Back article.
US Indices synchronized their individual Bearish legs once they reached the tops back on the 2nd of Jan.
Same day, right before the sell-off began, I posted the CBOE (VIX) - Volatility Index - Pointing towards a Market Crash article in which I mentioned that volatility could return, explaining how complacency can turn into fear.
Primary Correction officially started then, with US Indices falling off the edge of the cliff and ending the first sell-off on the 9th of Feb.
This was mentioned and signaled multiple times during the Advanced Video Course (see Macro sections and Charting).
Since the sell-off, US Indices performed rather well, unfolding a Bullish Correction which ended on the 27th of Feb.
2nd of March low and 6th of March high are viewed as Bearish Minor degree 1 & 2 (red), therefore, I am starting to believe that the Major Sell-off could have started for Intermediate (C) (red).
Below you may find some Aggressive views and possible scenarios in which the risk is higher than usual but the potential reward could be worth it.
The S&P500 possible drop was mentioned in the SNP500: 2018-2019 Buy & Sell Orders - Correction & Market Crash post.
Warning, these set-ups involve high risk and aggressive approach, do not trade if you are not an aggressive trader!
Dow Jones (US30) - Short Position:
Entry @ 24660.00 (or Market)
SL @ 25000.00
Targets: 24000.00 / 23000.00 / 22000.00


Dow Jones Short SetupChecking back my article from a week ago... I could not have been more correct in anticipating this move.
Check it out HERE

DOW SHORT EDUCATIONALAnother trade I am not actually taking. Usually I just try to buy the dip as it's safer. It's obvious the manipulation in the index will continue as long as possible but the current situation doesn't look very good from technical perspective.
We have a long developed bearish div, a rising wedge and a reversal spinning top candle on the 4h.
Please share your opinions below.

Reversal on the cards for DOW Jones?Dow Jones monthly chart. We have an ascending curve (shown in blue) going through major turning points of this index. As the curve gets steeper the acceleration of this index to the upside increases. The index is now retesting the curve for the second time after trading below it from 2009. Very sharp gains as of late may be capped at 21000 which is also a cloned range resistance (shown in blue boxes), with distance between blue zones being equivalent. From the gradient of the curve lately we can see the speed of growth may not be sustainable and we now may see a pullback/reversal.


Dow Johns Sell advice on Divergence Dow Johns Trading around 20750 where its high 20810 if its hold below 20850 we can see a correction toward 20400-20200.
Where we can see Divergence in RSI also. Its giving more Strong sign for sell.
Advice sell in range of 20750-20830 SL above 20900 TP1 20400- TP2 20200

Update on Dow Jones: expect correction lowerThis is an update on this earlier forecast from 28-01-2017:
We have seen a retrace below the 19925 followed by a surge up to 20250 as predicted.
See snapshot below:
It looks like the Dow Jones is topping.
Notice how (on balance) volume and price start to diverge. This is a clear sign of weakness.
The previous analysis is still valid: Expect a notable correction in the days ahead. First target is 19275.

Forecast Dow Jones: Move up to 20250, then major move downForecast Dow Jones for next few months: Small retrace, then move up to 20250 (162 Fib level), then swift move down.
Move up should happen between now and mid March.
This is the first time i analyse DJIA, so don't hold your breath ;]


DOW MINI Future @ 60 min Chart @ How 2 Trade BlackFriday & laterAbove 18919 still short-term upside trend
purple upside trendline (from 11/11 18683 & 11/15 18754)
purple sideway trendline (from 11/14 18919)
I would still prefer to trade the long side, after Trump election (zoom back @ chart)
19020 Points are a good entry capability, if the prices are comming back
19012 Points are a good entry capability, if the prices are comming back
19002 Points are a good entry capability, if the prices are comming back
18988 Points are a good entry capability, if the prices are comming back
18980 Points are a good entry capability, if the prices are comming back
18919 Points are a good entry capability, if the prices are comming back
How ever,
in my opinion are the 18919 Points important, if you`re an technical trader,
cause pirces above - which story ever the market is driving actuallity - suggesting an intact upside trend ...
Take care
& analyzed it again
- it`s always your choice ...
Best regards
4XSetUps

E-MINI DOW JONES @ 60 min. @ slightly optimistic upside trendFrom the technical point of view, the E-MINI DOW JONES FUTURE is in an intact slightly optimistic upside trend.
I am pretty kosher bullish and would prefere to buy back above 19000 - even between 19150 & 19100 ...
I don`t think that US Labour Data or even FED Chair Woman Yellen will stop this trend !?
Take care
& analyzed it again
- it`s always your choice ...
Best regards
4XSetUps

DOW JONES @ Daily @ Basic Scenario 2016 (Brexodus & Trump)Basic Numbers
18172.87 @ 1st Basic Yearly High 2016 before BREXODUS
18629.96 @ 1st High before Back 2 School Season & President Election
18674.74 @ 2nd High before Back 2 School Season & President Election
The Market breakedUp @ no questions :) but i am still not blindly optimistic
- `cause the unpredictabble noises around our new president Trump are too loud ...
How ever, volatility is garanteed, so i wouldn`t be surprised if the Market comes back until 18629.96 & 18674.74. And a fall until 18172.87 (even until 1st Basic Yearly High 2016 before BREXODUS) - inlusive a turnaround above - would only create an evidence of the long-term Bull market which we`re trading now.
long-term Bull Market > 18172.87
mid-term Bull Market > 18629.96 & 18674.74
I am excepting a trading range beetwen 18600 & 19000 while this week and next weeks.
After we could rise, if no politic impacts bites the markets, until 20000 Points - into 2017 !?
Even when our new president Trump will take over the White House offically (21st january) with his team ...
Take care
& analyzed it again
- it`s always your choice ...
Best regards
4XSetUps

Longer Term Outlook on the DOW 30Market should be ripe for a long pull trade come July IMO.
Set those stop and let 'er rip.

DOW JONES SHORT: Monthly Divergence, Fed HikeThe Dow reached as low as 17905 earlier in the day, but has since recovered somewhat to 18150.
Technically: The Dow is due for a large correction to the downside. There is strong divergence on the monthly chart towards 18500. The target would be the missed monthly pivot at 16300.
Fundamentally: US stocks are due for a correction to the downside, because the Fed will hike at least once this year. If they do not hike in September, this will be an opportunity to add to short positions through the election.
I am short on the Dow from 18500, and added on the pullback to 18150. This index should reach 16300 given enough time, as the Fed has to hike sooner rather than later if it wants its credibility to remain intact.


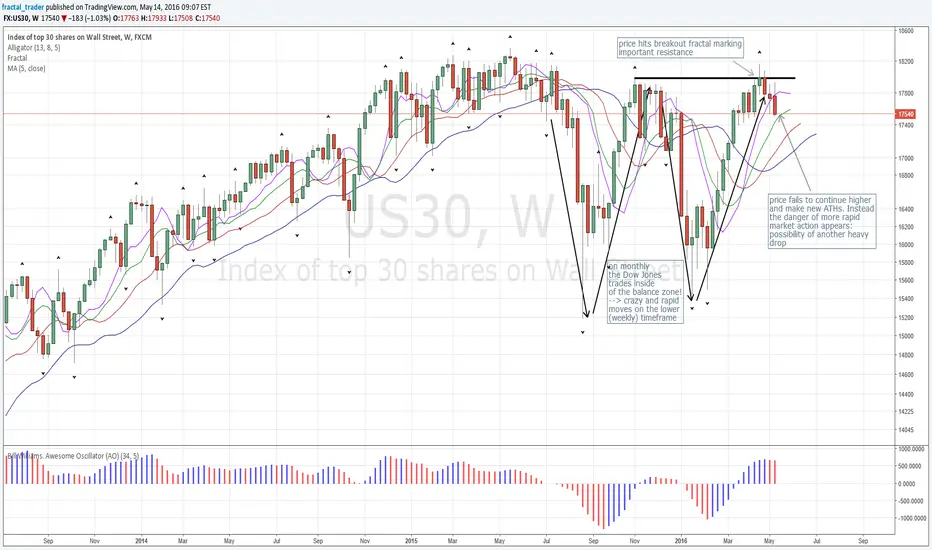
Dow Jones Moving in Range of 1000s of Pts: Pssblty for Drop!After failing to breakout and continue higher, the Dow Jones seems to resume its current behavior: moving straight down after having moved straight up. On the monthly this market is trading right inside of the balance zone, now we might see a simple continuation of this correction by a heavy drop down, just like we saw it twice already.